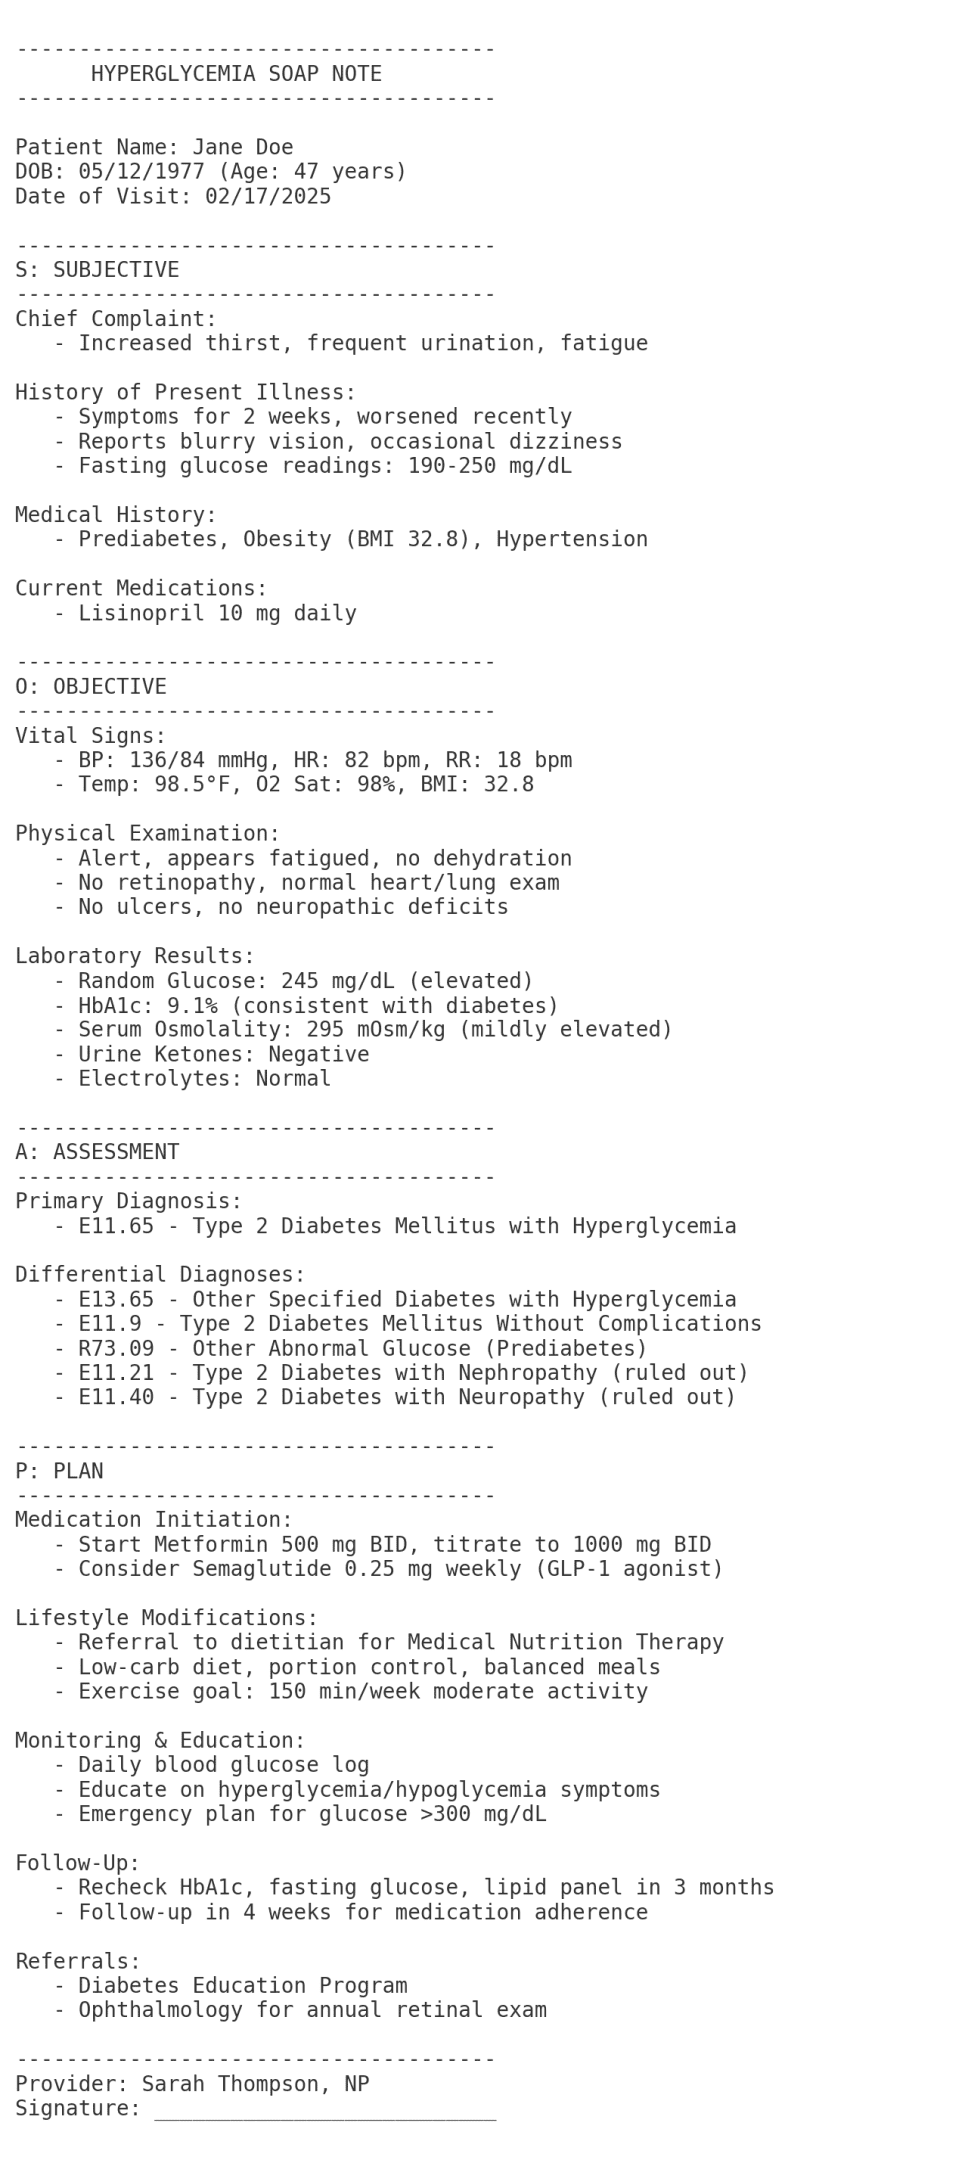
A Diabetes SOAP Note is a structured method of documentation used by healthcare providers to record patient information, observations, and treatment plans specifically for patients with diabetes mellitus type 2. This standardized format ensures that all essential aspects of a patient’s diabetic condition are consistently captured and communicated among healthcare professionals.
SOAP stands for Subjective, Objective, Assessment, and Plan. In the context of diabetes management, a SOAP note helps healthcare providers track the progress of a patient’s condition, monitor treatment effectiveness, and make informed decisions about ongoing care.
Components of a SOAP Note
Subjective: This section includes the patient’s reported symptoms, concerns, and experiences related to their diabetes. It may cover aspects such as fatigue, increased thirst (polydipsia), frequent urination (polyuria), blurred vision, or any other symptoms associated with diabetes type 2.
Objective: This component documents measurable and observable data, including vital signs, physical examination findings, and laboratory results. For diabetes patients, this often includes blood glucose levels, hemoglobin A1C results, blood pressure readings, and weight.
Assessment: In this section, the healthcare provider evaluates the patient’s condition based on the subjective and objective information gathered. It may include the current status of diabetes management, potential complications, and any new or ongoing issues related to the patient’s diabetes.
Plan: The final section outlines the treatment plan, including any adjustments to medications, lifestyle modifications, follow-up appointments, and patient education needs.
Diabetes SOAP Note Example
SUBJECTIVE:
Chief Complaint: “My blood sugar has been really high for the past week, and I feel very thirsty”
History of Present Illness: 58-year-old male with Type 2 Diabetes Mellitus (diagnosed 5 years ago) presents with one week of elevated blood glucose readings (ranging 250-400 mg/dL), increased thirst, frequent urination, and fatigue. Patient reports poor medication adherence over the past month due to financial constraints. Denies fever, chest pain, or shortness of breath. Has been drinking more water but hasn’t modified diet. Denies recent illness or new medications.
Current Medications:
Metformin 1000mg BID (reports missing ~50% of doses in past month)
Glipizide 10mg daily (reports missing ~50% of doses in past month)
Lisinopril 10mg daily for hypertension
Allergies: NKDA
Review of Systems:
Positive:
Constitutional: Fatigue, polydipsia
Urinary: Polyuria
Endocrine: Polyphagia Negative:
No chest pain, shortness of breath, nausea, vomiting
No visual changes
No numbness/tingling in extremities
No wounds or infections
OBJECTIVE:
Vital Signs:
BP: 142/88 mmHg
HR: 88 bpm
RR: 16/min
Temp: 98.6°F
SpO2: 98% on room air
Weight: 92 kg (stable)
Physical Examination: General: Alert, oriented, no acute distress HEENT: Mucous membranes slightly dry Cardiovascular: Regular rate and rhythm, no murmurs Respiratory: Clear to auscultation bilaterally Abdominal: Soft, non-tender, non-distended Skin: No lesions or infections Neurological: Alert, oriented x3, intact sensation Extremities: No edema, no ulcers
Laboratory Results:
Point of care glucose: 342 mg/dL
HbA1c: 10.2% (previous was 7.8% three months ago)
Basic Metabolic Panel:
Sodium: 138 mEq/L
Potassium: 4.2 mEq/L
Chloride: 102 mEq/L
CO2: 24 mEq/L
BUN: 18 mg/dL
Creatinine: 1.1 mg/dL
Calculated osmolality: 295 mOsm/kg
Urinalysis: Glucose 3+, no ketones
Urine microalbumin: 45 mg/24h
ASSESSMENT:
Primary Diagnosis:
Type 2 Diabetes Mellitus with Hyperglycemia (E11.65) Rationale: Elevated blood glucose, increased HbA1c, symptoms of hyperglycemia, and known history of T2DM
Contributing Factors:
Medication non-adherence due to financial constraints
Poor dietary control
Possible medication resistance
Differential Diagnoses:
Diabetic Ketoacidosis (E11.10) Rationale: Ruled out by absence of ketones, normal pH, and mental status
Hyperosmolar Hyperglycemic State (E11.00) Rationale: Ruled out by normal osmolality and mental status
New-onset infection (R50.9) Rationale: Ruled out by normal temperature and absence of symptoms
Complications Assessment:
Early diabetic nephropathy (elevated urine microalbumin)
No current diabetic retinopathy or neuropathy
PLAN:
Medications:
Resume previous doses of Metformin and Glipizide
Add Empagliflozin 10mg daily (provided samples for 1 month)
Continue Lisinopril 10mg daily Rationale: Add SGLT2 inhibitor to improve glycemic control
Laboratory Monitoring:
Basic metabolic panel in 1 week
HbA1c repeat in 3 months
Comprehensive metabolic panel in 1 month Rationale: Monitor response to therapy and assess organ function
Diabetes Management:
Provided glucometer and testing supplies
Instructions for blood glucose monitoring 4x daily
Detailed dietary counseling with emphasis on carbohydrate counting
Referral to diabetes educator
Signs/symptoms of hyper/hypoglycemia reviewed Rationale: Improve self-management skills
Social Support:
Referral to social worker for medication assistance programs
Provided information about generic medication options Rationale: Address financial barriers to care
Follow-up:
Return visit in 1 week
Call office if blood glucose >400 mg/dL or symptoms worsen
Provided after-hours contact information
Patient Understanding: Patient verbalizes understanding of medication changes, glucose monitoring, and follow-up plan. Agrees to contact office if symptoms worsen.
Time Spent: 30 minutes
HyperglycemiaSOAP Note Example
S: Subjective
Chief Complaint: “I’ve been extremely thirsty, urinating a lot, and feeling tired for the past week.” HPI:
48-year-old female with 7-day history of polyuria, polydipsia, fatigue, and blurred vision.
Reports unintentional weight loss of 4 lbs over 2 weeks.
Denies nausea, vomiting, abdominal pain, or recent illness.
No history of diabetes. Family history: Mother with type 2 diabetes.
Diet: High in sugary snacks and fast food; minimal physical activity. PMH: Hypertension, obesity (BMI 32). Medications: Lisinopril 10 mg daily. Allergies: NKDA. Social: Smokes ½ pack/day; denies alcohol/drug use.
O: Objective
Vital Signs:
Temp: 98.6°F (oral)
HR: 88 bpm
RR: 16/min
BP: 142/88 mmHg
Weight: 88 kg
Blood Glucose (fingerstick): 298 mg/dL (fasting)
Physical Exam:
General: Alert, obese, fatigued appearance.
HEENT: Dry mucous membranes; no acanthosis nigricans.
Cardiac: Regular rate/rhythm, no murmurs.
Abdomen: Soft, non-tender, no hepatomegaly.
Skin: No lesions or infections; poor skin turgor.
Neurologic: Alert, oriented; no focal deficits.
Labs (if available):
HbA1c: 9.2% (elevated, indicative of chronic hyperglycemia)
Urinalysis: Glucose 3+, no ketones.
Basic Metabolic Panel: Serum glucose 310 mg/dL, normal anion gap.
A: Assessment
Primary Diagnosis:
Hyperglycemia, likely due to New-Onset Type 2 Diabetes Mellitus (ICD-10: R73.9 – Hyperglycemia, unspecified; E11.65 – Type 2 DM with hyperglycemia if confirmed)
PCP follow-up in 1 week for medication adherence and glucose logs.
Ophthalmology referral for blurred vision (rule out diabetic retinopathy).
Monitoring:
Renal function tests (BUN/Cr) before starting metformin.
Foot exam for neuropathy at next visit.
Rationale for ICD-10 Selection:
R73.9: Initial code for hyperglycemia without confirmed diabetes.
E11.65: Used if type 2 diabetes is confirmed (pending further evaluation).
Differentials excluded based on labs, exam, and history.
Clinical Decision-Making:
Hyperglycemia likely reflects undiagnosed type 2 diabetes given risk factors (obesity, family history). Immediate focus on glycemic control and lifestyle changes to prevent complications.
Mastering the diabetes SOAP note is an essential skill for nursing students entering clinical practice. A well-crafted diabetes SOAP note provides a comprehensive framework for documenting patient care, tracking progress, and ensuring proper diabetes management. As a nursing student, understanding how to properly document patient encounters related to diabetes mellitus can significantly impact patient outcomes and your professional development.
SOAP Note Structure
The SOAP note format has become the standard documentation method in healthcare settings. When applied to diabetes care, a diabetes SOAP note allows healthcare professionals to systematically record relevant information about patients with diabetes.
A SOAP note consists of four distinct components:
S (Subjective): Information reported by the patient
O (Objective): Measurable and observable data gathered during assessment
A (Assessment): Clinical conclusions based on subjective and objective information
P (Plan): Treatment strategies and next steps
For diabetes care, each component of the SOAP note addresses specific aspects of the condition, from symptoms to treatment plans. Let’s explore how to effectively document each section for patients with diabetes.
The Subjective Component of Diabetes SOAP Notes
The subjective section of a diabetes SOAP note captures the patient’s personal experience with their condition. This includes their chief complaints, symptoms, and how diabetes affects their daily life.
When documenting the subjective component for patients with diabetes, focus on:
Symptoms of hyperglycemia: Patients may report polyuria, increased thirst, blurred vision, or fatigue
Blood glucose monitoring: Patient-reported blood glucose levels and testing frequency
Medication adherence: Information about insulin administration or oral medications
Dietary habits: Food intake patterns and relationship to blood sugar levels
Physical activity: Exercise routines and their effect on glucose control
Recent changes: Any recent modifications to medication, diet, or lifestyle
A thorough subjective section might include statements such as: “Patient reports blood glucose readings ranging from 180-250 mg/dL over the past week. Denies fever, chest pain, or shortness of breath. Patient admits to dietary non-compliance during weekend family gathering. Denies dizziness or abdominal pain.”
The Objective Component in Diabetes SOAP Notes
The objective section of a diabetes SOAP note documents clinical findings and measurable data. This critical component provides concrete evidence of the patient’s current health status.
Key elements to include in the objective section for diabetes care:
Vital signs: Blood pressure (goal blood pressure for patients with diabetes is typically <140/90 mmHg), heart rate, respiratory rate, temperature
Weight and BMI: Important for tracking changes over time
Laboratory results: HbA1c (target is generally less than 7%), fasting plasma glucose, oral glucose tolerance test results if applicable
Blood glucose readings: Current readings and patterns from patient logs
Medication review: Current diabetes medications including insulin types and dosages
For example: “Vital signs: BP 138/84 mmHg, HR 78, RR 16, Temp 98.6°F. Weight 192 lbs (no change from last visit). Random blood glucose: 187 mg/dL. HbA1c: 7.8% (increased from 7.2% three months ago). Physical exam reveals no acute findings. No signs of peripheral neuropathy. Foot exam shows intact skin, normal sensation.”
Assessment in Diabetes SOAP Notes
The assessment section synthesizes the subjective and objective information to form clinical judgments about the patient’s diabetes management. This section identifies problems and evaluates the patient’s condition in the context of diabetes.
Important considerations for the assessment section:
Diabetes classification: Type 1 diabetes, type 2 diabetes, or gestational diabetes
Glycemic control: Whether blood glucose levels are well-managed
Complications: Presence of acute or chronic diabetes-related issues
Risk factors: Identification of factors affecting diabetes management
Comorbidities: Other conditions like hypertension or rheumatoid arthritis that may impact diabetes care
A comprehensive assessment might read: “58-year-old male with type 2 diabetes mellitus with suboptimal glycemic control evidenced by elevated blood glucose readings and increased HbA1c. Patient demonstrates adequate medication adherence but struggles with dietary compliance. No signs of acute complications. Hypertension is currently well-controlled.”
The Plan Component of Diabetes SOAP Notes
The plan section outlines the treatment strategy for managing the patient’s diabetes and related conditions. This section should be clear, specific, and actionable.
Elements to address in the plan section:
Medication adjustments: Changes to insulin doses or oral agents
Glucose monitoring: Recommendations for timing and frequency
Education: Topics for diabetes self-management education
Referrals: Consultations with specialists if needed
Follow-up: Timing for next appointment and monitoring parameters
An effective plan might include: “1. Continue Metformin 1000mg BID. 2. Increase Glipizide to twice daily dosing. 3. Monitor blood glucose levels before meals and at bedtime. 4. Referral to diabetes educator for dietary counseling, focusing on whole grains and portion control. 5. Encourage 30 minutes of physical activity 5 days per week. 6. Reduce sodium intake to 2 grams daily to manage hypertension. 7. Return for follow-up in 1 month with blood glucose log.”
Diabetes SOAP Note Example for Type 2 Diabetes
To illustrate the application of the SOAP format in the context of diabetes, here’s an example diabetes SOAP note for a patient with type 2 diabetes:
S: 50-year-old African American male with type 2 diabetes presents for a routine follow-up. Reports average morning blood glucose readings of 150-180 mg/dL. Denies hypoglycemic episodes. States he has been “mostly” taking medications as prescribed but occasionally misses evening dose. Denies chest pain, shortness of breath, or blurred vision. Reports maintaining a healthy diet during weekdays but admits to poor choices on weekends. Currently walking 15 minutes daily.
O: Vital signs: BP 142/88 mmHg, HR 76, RR 18, Temp 98.4°F. Weight 202 lbs (up 3 lbs from last visit). Random plasma glucose: 163 mg/dL. HbA1c: 7.9% (previous was 7.5%). Current medications were mentioned: Metformin 1000mg BID, Glipizide 5mg daily, Lisinopril 10mg daily. Physical exam reveals normal heart sounds, clear lungs. Foot exam shows no lesions or decreased sensation. No edema noted.
A: Type 2 diabetes mellitus with worsening glycemic control. Contributing factors include medication non-adherence and inconsistent dietary habits. Hypertension borderline controlled. Weight gain since last visit indicating need for therapy in order to lower cardiovascular risk. No evidence of diabetic neuropathy or other acute complications.
P:
Adjust Glipizide, increased to twice daily
Emphasize medication adherence, especially evening doses
Recommend drinking more water and limiting caloric beverages
Encourage increased physical activity to 30 minutes daily
SMART goal: Patient will track blood glucose levels 2 times daily for next 2 weeks
Avoid drinking alcohol as it has a negative interaction with current medications
Follow up in 4 weeks with blood glucose log
Lab work including lipid panel and kidney function in 2 weeks to reduce CVD risks by maintaining healthy cholesterol levels
Type 1 Diabetes SOAP Note Considerations
While many aspects of documentation are similar, a diabetes SOAP note for type 1 diabetes has some unique considerations. Type 1 diabetes management differs significantly from type 2 diabetes management, primarily due to the absolute insulin deficiency.
In a SOAP note for type 1 diabetes:
Subjective: Focus on insulin administration, carbohydrate counting, and hypoglycemic episodes
Objective: Include insulin-to-carbohydrate ratios and correction factors
Assessment: Address insulin management and technology use (pumps, continuous glucose monitors)
Plan: Often includes more detailed insulin adjustments and hypoglycemia prevention strategies
Best Practices for Effective Diabetes SOAP Notes
To improve your diabetes SOAP note documentation, consider these best practices:
Use specific, measurable terms: Instead of “high glucose,” document actual readings (e.g., “blood glucose 275 mg/dL”).
Maintain chronological order: Present information in a logical sequence.
Avoid subjective judgments: Focus on facts rather than assumptions about patient behavior.
Document patient understanding: Note the patient’s comprehension of their condition and management plan.
Address barriers to care: Identify factors affecting the patient’s ability to manage their diabetes.
Use appropriate terminology: Accurately describe diabetes-related concepts using proper medical terminology.
Diabetes SOAP Note Template for Student Practice
To help nursing students practice documentation, here’s a basic diabetes SOAP note template:
S:
Chief complaint
History of present illness
Diabetes history (type, duration, previous control)
When structuring a SOAP note for a patient with type 2 diabetes, it’s important to include specific information relevant to diabetes management. Here’s a general structure:
Foot examination (checking for ulcers, infections, or neuropathy)
Skin examination (looking for acanthosis nigricans, insulin injection sites)
Eye examination (if possible, or noting recent ophthalmology visits)
How to Assess Blood Sugar Levels in Diabetes Type 2?
Monitoring Blood Glucose: Tools and Techniques
Assessing blood sugar levels is a crucial aspect of diabetes management. Here are some common tools and techniques:
Glucometers: These portable devices allow patients to check their blood glucose levels at home using a small blood sample.
Continuous Glucose Monitoring (CGM) Systems: These devices provide real-time glucose readings throughout the day and night, offering a more comprehensive view of glucose patterns.
Fasting Plasma Glucose Test: This test measures blood sugar levels after an 8-hour fast, typically performed in a laboratory setting.
Oral Glucose Tolerance Test (OGTT): This test involves measuring blood glucose levels before and 2 hours after consuming a glucose-rich drink.
Random Plasma Glucose Test: This test can be done at any time of the day, regardless of when the patient last ate.
Understanding A1C Levels and Their Importance
Hemoglobin A1C (HbA1c) is a crucial marker for long-term blood glucose control:
What is A1C?: It’s a blood test that reflects average blood glucose levels over the past 2-3 months.
Target A1C: For most adults with diabetes, the target A1C is less than 7%. However, this may vary based on individual factors.
Frequency of Testing: A1C is typically measured every 3-6 months, depending on how well the patient’s diabetes is controlled.
Interpretation:
Below 5.7%: Normal
5.7% to 6.4%: Prediabetes
6.5% or above: Diabetes
Importance: Regular A1C testing helps healthcare providers assess the effectiveness of the current treatment plan and make necessary adjustments.
Identifying Symptoms of Hyperglycemia and Hypoglycemia
Recognizing the symptoms of high and low blood sugar is essential for both patients and healthcare providers:
Hyperglycemia (High Blood Sugar):
Increased thirst (polydipsia)
Frequent urination (polyuria)
Fatigue
Blurred vision
Slow-healing wounds
Recurrent infections
Hypoglycemia (Low Blood Sugar):
Shakiness
Sweating
Rapid heartbeat
Confusion
Irritability
Hunger
Weakness
In severe cases, loss of consciousness
What Lifestyle Modifications are Recommended for Patients with Diabetes?
Dietary Changes to Manage Diabetes Type 2
Carbohydrate Management: Encourage patients to monitor their carbohydrate intake and choose complex carbohydrates over simple sugars.
Portion Control: Teach patients about appropriate portion sizes to help manage calorie intake and blood sugar levels.
Increased Fiber Intake: Recommend a diet rich in fiber, including whole grains, legumes, fruits, and vegetables.
Limit Saturated and Trans Fats: Advise patients to reduce intake of saturated fats and eliminate trans fats to support heart health.
Consistent Meal Timing: Encourage regular meal times to help maintain stable blood glucose levels.
Hydration: Stress the importance of adequate water intake.
Importance of Physical Activity in Diabetes Management
Regular physical activity is crucial for managing diabetes type 2:
Weight Management: Physical activity aids in maintaining a healthy weight or achieving weight loss goals.
Cardiovascular Health: Regular exercise reduces the risk of heart disease and stroke, common complications in diabetes.
Stress Reduction: Physical activity can help manage stress, which can affect blood glucose levels.
Recommendations: Aim for at least 150 minutes of moderate-intensity aerobic activity per week, spread over at least 3 days, with no more than 2 consecutive days without exercise.
Managing Hypertension and Cholesterol Levels
Controlling blood pressure and cholesterol is essential in diabetes management:
Blood Pressure Goals: The target blood pressure for most patients with diabetes is below 140/90 mmHg.
Cholesterol Management:
LDL Cholesterol: Target is generally <100 mg/dL
HDL Cholesterol: Target is >40 mg/dL for men and >50 mg/dL for women
Triglycerides: Target is <150 mg/dL
Lifestyle Modifications:
Reduce sodium intake
Increase consumption of fruits, vegetables, and whole grains
Limit alcohol consumption
Quit smoking
Medication: If lifestyle changes are insufficient, medications may be prescribed to manage hypertension and hyperlipidemia.
How to Document a Patient’s History of Present Illness?
Key Questions to Ask During Patient Assessment
When documenting the history of present illness for a patient with diabetes type 2, consider asking the following key questions:
What brings you in today? Are you experiencing any new symptoms?
How well controlled do you feel your blood sugar has been recently?
Have you had any episodes of very high or very low blood sugar?
Are you experiencing any symptoms like increased thirst, frequent urination, or blurred vision?
Have you noticed any changes in your energy levels or weight?
Are you having any problems with your feet, such as numbness, tingling, or wounds that won’t heal?
Have you been able to follow your diet and exercise plan?
Are you taking your medications as prescribed? Any side effects?
Have you had any recent illnesses or stressors that might have affected your blood sugar?
When was your last eye exam?
Identifying Common Complaints in Type 2 Diabetes Patients
Common complaints that should be noted in the history of present illness include:
Type 2 diabetes is a chronic condition where your body either doesn’t produce enough insulin or has become resistant to its effects. This leads to high blood sugar levels, which can cause various health problems over time. It’s often related to lifestyle factors and can be managed through diet, exercise, and sometimes medication.
What is the best description of type 2 diabetes?
Type 2 diabetes is a metabolic disorder characterized by high blood sugar levels resulting from the body’s ineffective use of insulin. It’s the most common form of diabetes, often developing in adults and associated with obesity and sedentary lifestyle.
What is the clinical presentation of diabetes mellitus type 2?
The clinical presentation of type 2 diabetes can include increased thirst, frequent urination, unexplained weight loss, fatigue, blurred vision, slow-healing wounds, and recurrent infections. However, some patients may be asymptomatic and diagnosed through routine blood tests.
What is diabetes type 2 concept?
The diabetes type 2 concept refers to the understanding that this form of diabetes is primarily characterized by insulin resistance and relative insulin deficiency. Unlike type 1 diabetes, where the pancreas doesn’t produce insulin, in type 2 diabetes, the body becomes less responsive to insulin or doesn’t produce enough to maintain normal blood glucose levels.
Diabetes self-management (DSM) is recognized as a cornerstone of effective diabetes care. Araujo-Soares et al. (2019) emphasize that DSM encompasses individual behavior changes, particularly in dietary patterns and physical activity, for patients with Type 2 Diabetes Mellitus (T2DM). As healthcare professionals, nurses are crucial in educating and supporting patients to develop the skills necessary for successful DSM.
This diabetes nurse teaching plan is designed to address the educational needs of patients with T2DM. The plan aims to provide patients with the knowledge, skills, and motivation required to effectively manage their condition and improve their quality of life.
Nurse Teachings on Diabetes type 2
Theoretical Framework for Nurse Teachings on Diabetes Type 2
This diabetes nurse teaching plan with T2DM as the selected patient care problem relies on the capability, opportunity, motivation, and behavior (COM-B) framework which is heavily informed by behavioral change theories of planned behavior theory (PBT) and the self-determination theory (SDT).
According to Hood et al. (2018), PBT significantly improves T2DM patient outcomes because the magnitude to which an individual perceives their ability to control those factors that either facilitate or hinder the conduct of behavior determines not just their actual behavior but also their planned intentions. Likewise, SDT works on the rationale that people believe they have the capacity and opportunity as well as the motivation to behave in ways that are healthy and effective.
The COM-B framework, therefore, underscores the fact that T2DM patients’ autonomy, and competence in how they relate to one another in their social setting is bound to impact their creativity, persistence, and performance in the management of this chronic condition.
Target Audience and Special Considerations
The audience for this TP includes patients diagnosed as people with Diabetes and includes those flagged off as pre-diabetics and their families. The targeted individual should be above 21 years old, both males and females. Patient AB personifies the audience as a 36-year-old African American male diagnosed with T2DM recently. He is a single parent (following the death of his wife of 12 years) to a young girl Angel who at 11 years identified as pre-diabetic.
Patient AB’s Nurse Teachings on Diabetes Type 2 seeks to educate him on the likely effects of T2DM. This nursing professional anticipates that AB, the group of T2DM patients, will be empowered with this disease’s knowledge so that he can change to a T2DM-friendly diet and physical as well as mental exercises so that this family reduces the need to be dependent on insulin injections in managing their conditions. The planned lesson targets to last 80 min (1 hr. 20 min) and the venue is the local community hall.
Learning Outcomes
By the conclusion of this Nurse Teachings on Diabetes type 2 teaching plan, patients will be able to:
Identify and describe their T2DM medications, including proper administration methods.
Differentiate between Type 1 and Type 2 Diabetes based on pathophysiology and clinical manifestations.
Explain the importance of diet and exercise in T2DM management.
Develop a personalized plan for incorporating lifestyle changes into their daily routines.
Teaching Methods and Resources
The Nurse Teachings on Diabetes type 2 plan employs a variety of methods to accommodate different learning styles and enhance engagement:
Lectures and discussions
Demonstrations and hands-on practice
Visual aids (posters, charts, brochures)
Interactive problem-solving exercises
Q&A sessions
Resources include a whiteboard, marker pens, informational charts, glucometers, and posters depicting T2DM risk factors, complications, and prevention strategies.
Nurse Teachings on Diabetes type 2 Detailed Lesson Plan
The following table outlines the structure of the 80-minute teaching session:
Teaching Step
Time Allocated
Content
Teaching and Learning Activities
1. Introduction
5 min
Introduce DM as a general condition due to lack of insulin, a hormone in the blood, resulting from metabolic issues; discuss signs and symptoms.
Lecture and discussion
2. Topic Presentation
25 min
Explain the role of the pancreas, DM pathophysiology, and types (Type 1 insulin-dependent and Type 2 non-insulin dependent); discuss risk factors and clinical manifestations of T2DM. Cover management of T2DM, including pharmacological interventions (oral hypoglycemic agents), the role of nutrition, and the benefits of exercise.
Lecture, discussion, and description of posters
3. Comparison/Association
20 min
Use specific examples and link them to facts. Guide patients to make their generalizations about pharmacological and non-pharmacological interventions.
Group discussions on the benefits of various management strategies
4. Generalizations
15 min
Use charts and posters on facts about T2DM and engage participants in reflective thinking.
Insightful questions on the role of dietary changes and health education
5. Application
10 min
Engage participants in DSM activities, including foods to adhere to and those to avoid. Explain why and how they should prepare meals, check their weight, and engage in physical activities.
Demonstration on how to prepare a T2DM-recommended meal plan
6. Recapitulation
5 min
Use questions to recap the lesson. Participants provide feedback and suggestions for improving the teaching-learning process.
Questions and lesson assessment questionnaire
Evaluation Methods
The effectiveness of the Nurse Teachings on Diabetes type 2 plan will be assessed through multiple methods:
Follow-up appointments to track progress in self-management behaviors
Long-term monitoring of A1C levels
Conclusion
This comprehensive Nurse Teachings on Diabetes type 2 teaching plan, grounded in the COM-B framework, aims to empower patients with T2DM to effectively manage their condition. By addressing both pharmacological and non-pharmacological aspects of diabetes care, the plan provides patients with the knowledge, skills, and motivation needed to improve their health outcomes and quality of life.
As Kourakos (2017) emphasizes, enhancing self-management in diabetes through therapeutic education is crucial for long-term success. This teaching plan serves as a valuable tool for nurses in their role as diabetes educators, facilitating patient empowerment and promoting better health outcomes for individuals living with T2DM.
The structured approach, combined with interactive teaching methods and comprehensive evaluation strategies, ensures that patients receive the support they need to navigate the complexities of T2DM management. By focusing on practical skills and personalized strategies, this plan aims to foster sustainable behavior changes that can significantly improve patients’ quality of life and long-term health outcomes.
Hood, K. K., Hilliard, M., Piatt, G., & Ievers-Landis, C. E. (2015). Effective strategies for encouraging behavior change in people with diabetes. Diabetes management (London, England), 5(6), 499.
Kourakos, M. (2017). Enhancing self-management in Diabetes: the value of Therapeutic Education.
5 FAQs on Nursing Teaching Plans for Diabetes Education
Q: What are the essential components of an effective diabetes nursing teaching plan? A: An effective diabetes nursing teaching plan should include:
Varied teaching methods to accommodate different learning styles (e.g., lectures, demonstrations, hands-on practice)
Appropriate resources and materials (e.g., handouts, visual aids, glucose meters for demonstration)
Strategies for evaluating patient understanding and skill acquisition
A plan for follow-up and ongoing support
Q: How can nurses ensure their teaching plan is patient-centered and culturally sensitive? A: To create a patient-centered and culturally sensitive teaching plan:
Assess the patient’s current knowledge, beliefs, and practices related to diabetes
Consider the patient’s cultural background, including dietary habits and health beliefs
Use language and examples that are relevant and understandable to the patient
Involve family members or support persons when appropriate and desired by the patient
Be flexible and willing to adapt the plan based on the patient’s individual needs and preferences
Use interpreters or translated materials when necessary to overcome language barriers
Q: What are effective strategies for evaluating the success of a diabetes teaching plan? A: Effective evaluation strategies include:
Pre- and post-session knowledge assessments to measure immediate learning gains
Follow-up appointments to assess behavior changes and address ongoing questions or concerns
Monitoring of clinical outcomes such as A1C levels, blood pressure, and weight
Patient self-efficacy assessments to measure confidence in diabetes self-management
Patient satisfaction surveys to gather feedback on the education process
Q: How can nurses address common barriers to effective diabetes education? A: Nurses can address common barriers by:
Breaking complex information into manageable chunks to prevent information overload
Using teach-back methods to ensure patient understanding
Employing motivational interviewing techniques to address patient resistance or ambivalence
Providing resources for ongoing support, such as diabetes support groups or online educational materials
Collaborating with other healthcare team members (e.g., dietitians, pharmacists) to provide comprehensive care
Considering the use of technology (e.g., diabetes management apps, telemedicine) to enhance education and support
Q: How often should a diabetes nursing teaching plan be updated, and what should prompt revisions? A: A diabetes nursing teaching plan should be reviewed and updated:
At least annually to ensure alignment with current best practices and guidelines
When new significant research findings or treatment options become available
Based on feedback from patients and healthcare team members
In response to changes in patient population demographics or needs
When evaluation data indicates areas for improvement in patient outcomes or satisfaction
Prompts for revision may include:
Publication of new diabetes management guidelines
Introduction of new diabetes medications or technologies
Consistent feedback from patients indicating difficulty understanding certain topics
Observed gaps in patient knowledge or skills during follow-up assessments
IV Fluids for Dehydration: A Complete Guide to IV Therapy and Fluid Replacement
Dehydration is a clinical condition that develops when the body loses more fluid than it replaces, creating a deficit that can affect circulation, electrolyte concentrations, cellular function, and, when severe, the function of vital organs. Fluid can be lost through vomiting, diarrhea, fever, excessive sweating, increased urine output, bleeding, burns, or inadequate intake. The clinical effects depend not only on the amount of fluid lost but also on how quickly the loss occurs and whether water and electrolytes are being lost together. For this reason, dehydration ranges from a relatively mild problem that can be corrected with oral fluids to a potentially serious condition requiring close assessment and intravenous fluid therapy.
The body’s response to dehydration involves several compensatory mechanisms. As fluid levels fall, the kidneys conserve water by producing less urine, while thirst encourages increased fluid intake. At the same time, reduced circulating volume can activate hormonal and cardiovascular responses intended to preserve blood pressure and perfusion. If fluid loss continues or replacement is inadequate, these compensatory mechanisms may no longer be sufficient. A patient may develop tachycardia, hypotension, reduced urine output, dizziness, weakness, altered mental status, and other signs of worsening volume depletion. Severe dehydration can progress to hypovolemia and impaired tissue perfusion, making timely recognition and appropriate fluid replacement particularly important.
IV Fluids for Dehydration are one method of restoring fluid when oral replacement is insufficient or cannot be safely used. Intravenous fluids are administered directly into the bloodstream, allowing fluid to enter the circulation without depending on the gastrointestinal tract for absorption. This can be particularly useful when a person has persistent vomiting, impaired consciousness, significant gastrointestinal losses, or substantial volume depletion. However, IV therapy is not automatically necessary whenever dehydration occurs. The route and amount of fluid replacement should be based on the patient’s clinical condition, severity of dehydration, ongoing losses, electrolyte status, underlying conditions, and ability to drink and absorb fluids.
When IV Fluids for Dehydration are considered, several clinical factors must be evaluated rather than simply selecting a commonly used solution. These include:
Severity of fluid loss: Mild dehydration may respond to oral fluids, whereas more substantial losses may require intravenous replacement.
Ability to tolerate oral fluids: Persistent vomiting, reduced consciousness, severe weakness, or other factors may make oral hydration ineffective or unsafe.
Cause of dehydration: Treatment may differ depending on whether fluid loss results from diarrhea, vomiting, fever, excessive sweating, inadequate intake, or another condition.
Electrolyte status: Sodium, potassium, chloride, glucose, and other laboratory findings can influence fluid selection and monitoring.
Cardiovascular and renal function: Patients with heart failure, kidney impairment, or other conditions affecting fluid handling may be particularly vulnerable to excessive fluid administration.
Ongoing losses: Continued vomiting, diarrhea, bleeding, fever, or excessive urine output may require ongoing reassessment and adjustment of fluid replacement.
Understanding IV Fluids for Dehydration therefore involves more than knowing the names of solutions such as normal saline or Lactated Ringer’s solution. Different intravenous solutions have different electrolyte compositions, osmolalities, and physiological effects. The choice of an IV fluid should correspond to the patient’s clinical needs rather than being based on a single “best” solution for every case. In addition, the rate and volume of administration matter because insufficient replacement may fail to correct the deficit, while excessive administration can contribute to fluid overload or electrolyte disturbances.
The nursing role extends throughout the entire process of IV Fluids for Dehydration. Before treatment, assessment helps establish the patient’s baseline condition and identify factors contributing to fluid loss. During therapy, nurses monitor vital signs, urine output, intake and output, peripheral perfusion, mental status, laboratory findings, and the IV site. After fluid administration, reassessment determines whether hydration and circulation are improving and whether treatment needs to continue, change, or transition to oral fluids.
This makes IV Fluids for Dehydration an important component of understanding fluid therapy and safe patient care. A sound approach begins with recognizing dehydration and determining its severity, followed by deciding whether oral or intravenous replacement is appropriate. From there, appropriate fluid selection, safe administration, continuous monitoring, recognition of complications, and evaluation of the patient’s response all contribute to effective dehydration treatment. The following discussion examines these principles in detail, including the types of IV fluids used, their role in fluid replacement, administration and nursing care, potential risks, special considerations, and practical clinical examples.
Understanding Dehydration and Its Severity
Dehydration occurs when the body loses more water than it replaces, resulting in a deficit of body water that can progressively interfere with normal physiological function. Because water is distributed throughout intracellular and extracellular compartments and is essential for circulation, temperature regulation, cellular metabolism, and electrolyte transport, even relatively modest losses can produce noticeable clinical effects. The severity depends on the amount and rate of fluid loss, the patient’s ability to replace lost fluids, the composition of the fluid lost, and underlying health conditions.
It is also important to distinguish dehydration from isolated fluid volume depletion. Dehydration specifically refers to insufficient body water, whereas volume depletion generally describes a reduction in extracellular fluid volume, often involving losses of both water and sodium. The two commonly occur together, particularly with vomiting, diarrhea, sweating, or other causes of significant fluid loss. This distinction matters when determining the appropriate IV Fluids for Dehydration, because the composition of the fluid lost and the patient’s electrolyte status influence the type and amount of replacement required.
The body normally maintains fluid balance through coordinated mechanisms involving thirst, the kidneys, hormones, and cardiovascular responses. When fluid levels begin to fall, thirst encourages intake while the kidneys conserve water by reducing urine production. As losses continue, however, these compensatory mechanisms may become insufficient. Progressive volume depletion can reduce circulating volume and tissue perfusion, producing increasingly serious clinical manifestations.
Understanding the severity of dehydration is therefore fundamental to determining whether a patient can be managed with oral replacement or may require IV therapy. The following factors are particularly important when assessing the condition:
Amount of fluid lost: A larger deficit generally produces more pronounced clinical findings.
Rate of fluid loss: Rapid losses can cause hemodynamic instability before the body has adequate time to compensate.
Ability to replace lost fluids: A patient who can drink and retain fluids has different treatment needs from someone with persistent vomiting or impaired consciousness.
Electrolyte losses: Vomiting, diarrhea, sweating, and other losses may remove sodium, potassium, chloride, and other electrolytes along with water.
Age and health status: Infants, children, and older adults can be particularly vulnerable to dehydration.
Underlying disease: Kidney disease, diabetes, adrenal disorders, and other conditions can alter fluid regulation and increase the risk of dehydration.
Causes of Dehydration and Fluid Loss
There are two broad mechanisms by which dehydration develops: excessive fluid loss and inadequate fluid intake. In many clinical situations, both occur simultaneously. For example, a patient with gastroenteritis may lose large amounts of water through diarrhea and vomiting while also being unable to drink enough because of nausea.
Common causes include:
Gastrointestinal losses Vomiting and diarrhea are among the most important causes of acute dehydration. Repeated vomiting removes water and electrolytes from the body while also making it difficult for the patient to replace those losses orally. Diarrhea can produce substantial losses of water, sodium, potassium, bicarbonate, and other substances. The combination of diarrhea and vomiting can therefore cause rapid deterioration, particularly in infants, young children, and frail adults. Example: A patient experiencing repeated vomiting and watery diarrhea for 24 hours may have difficulty keeping down even small amounts of fluid. Continued losses combined with poor intake can progress from mild dehydration to significant volume depletion.
Excessive sweating Sweating is an important mechanism for regulating body temperature, but prolonged sweating can result in substantial water and electrolyte losses. This may occur during intense physical activity, prolonged exposure to high temperatures, fever, or physically demanding work in hot environments.
Increased urine production Excessive urinary losses can occur with certain diseases and medications. Diabetes mellitus with significant hyperglycemia can cause osmotic diuresis, while diuretics can increase urinary water and sodium losses. Kidney disorders and certain hormonal abnormalities can also interfere with the body’s ability to conserve water and electrolytes.
Inadequate fluid intake A person may become dehydrated simply because they cannot consume enough fluid to meet their needs. This can occur with severe illness, swallowing difficulties, nausea, restricted access to drinking water, reduced consciousness, physical disability, or an impaired ability to recognize or respond to thirst.
Fever and increased insensible losses Fever can increase water losses through the skin and respiratory tract. Faster breathing can also increase respiratory water loss. Although these losses may appear small individually, they become clinically important when combined with poor intake or other sources of fluid loss.
Burns and extensive skin injury Major burns can cause substantial losses from damaged skin and can also produce shifts of fluid into tissues. Such patients require careful assessment and specialized fluid management rather than simply replacing water according to thirst.
Blood and other significant fluid losses Hemorrhage causes loss of circulating volume and can produce signs that overlap with dehydration. However, bleeding is not simply treated as dehydration because the patient has lost blood components as well as volume. Significant bleeding requires urgent evaluation and appropriate resuscitation.
Third-space fluid losses Fluid can sometimes move out of the functional circulating compartment and become sequestered in areas where it is not readily available for circulation. Examples include certain abdominal or intestinal conditions. Although total body water may not initially be lost from the body, effective circulating volume can decline.
Several causes can occur together. For instance, a patient with fever may have increased insensible losses while simultaneously experiencing diarrhea and poor oral intake. In such circumstances, simply asking how much the patient has drunk does not provide a complete picture of the cause of dehydration; both intake and losses must be assessed.
Signs and Symptoms of Dehydration
The signs of dehydration vary according to severity and the patient’s age, underlying conditions, and electrolyte status. Early manifestations may be relatively subtle, while more advanced dehydration can affect cardiovascular function, renal perfusion, and neurological status.
Common symptoms of dehydration include:
Thirst
Dry mouth or dry mucous membranes
Reduced urine output
Darker or more concentrated urine
Fatigue and weakness
Headache
Dizziness or light-headedness
Reduced sweating
Reduced skin elasticity
Orthostatic symptoms
In more serious cases, confusion or altered mental status
Thirst is an important early signal because the brain responds to changes in body water and plasma concentration by stimulating the desire to drink. However, thirst should not be considered a reliable indicator of hydration status in every patient. Older adults, individuals with altered mental status, and some seriously ill patients may not recognize or communicate thirst effectively.
Urine output is another useful clinical indicator. As the body attempts to conserve water, the kidneys reduce urine production. Oliguria, or markedly reduced urine output, may therefore accompany significant volume depletion. However, urine output must be interpreted in context because kidney disease, medications, obstruction, and other conditions can alter urinary patterns independently of dehydration.
Cardiovascular findings become increasingly important as fluid loss progresses. A patient may develop:
Increased heart rate
Weak peripheral pulses
Orthostatic tachycardia
Orthostatic hypotension
Reduced blood pressure
Delayed capillary refill
Cool or poorly perfused extremities
These findings reflect the body’s attempt to preserve circulation despite declining effective circulating volume. With more substantial losses, reduced blood flow to tissues can progress to hypoperfusion and shock.
Neurological changes are particularly concerning. A patient who becomes increasingly lethargic, confused, difficult to arouse, or unconscious may be suffering from severe dehydration or another serious condition requiring immediate assessment. Confusion is especially concerning because severe dehydration can compromise cerebral perfusion and because electrolyte disturbances may further affect neurological function.
Physical examination findings should also be interpreted carefully. Dry mucous membranes and decreased skin turgor can support the assessment of dehydration, but neither finding is perfectly reliable in every patient. For example, skin turgor can naturally be reduced in older adults, while mouth breathing can cause dry mucous membranes without significant volume depletion. Therefore, assessment should combine multiple findings rather than relying on a single sign.
A practical assessment may include:
History: Ask about fluid intake, vomiting, diarrhea, sweating, fever, urination, medications, and recent illness.
Vital signs: Evaluate heart rate, blood pressure, respiratory rate, and orthostatic changes when appropriate.
Urine output: Assess frequency, volume, and concentration.
Neurological status: Assess alertness, orientation, behavior, and mental status.
Laboratory assessment when indicated: Evaluate electrolytes, renal function, glucose, and other relevant laboratory values.
These findings help establish the severity of dehydration and determine whether oral replacement is likely to be sufficient or whether more intensive fluid replacement may be necessary.
Mild, Moderate, and Severe Dehydration
Dehydration exists along a continuum rather than as three completely separate conditions. The categories of mild, moderate, and severe dehydration provide a framework for describing increasing fluid deficits and clinical effects, but exact thresholds vary according to the population and clinical context. In particular, estimates based on percentage body weight are commonly used in pediatric assessment but should not be applied mechanically to every adult patient.
Mild dehydration may produce relatively subtle findings. A person may notice increased thirst, a dry mouth, slightly reduced urine production, fatigue, or mild dizziness. In an otherwise healthy person who can drink normally, these early changes may improve with appropriate oral fluid intake and correction of the underlying cause.
Moderate dehydration produces more noticeable physiological changes. Reduced urine output may become more pronounced, the mouth and mucous membranes may be clearly dry, and the patient may develop tachycardia, weakness, lethargy, or orthostatic symptoms. Clinical assessment may also reveal reduced skin turgor or other evidence of volume depletion.
Severe dehydration represents a medical emergency because the reduction in circulating volume can compromise tissue and organ perfusion. Findings can include marked tachycardia, hypotension, rapid breathing, delayed capillary refill, weak or thready pulses, confusion, fainting, and other signs of shock. Severe cases can result in kidney injury, brain dysfunction, circulatory collapse, and death if not promptly treated.
A simplified clinical progression can be understood as follows:
Severity
Typical clinical picture
Mild
Thirst, dry mouth, mild reduction in urine output, possible fatigue
The progression is not always predictable. A patient can deteriorate quickly when losses are rapid, particularly when vomiting or diarrhea prevents adequate replacement. Conversely, some patients with chronic fluid deficits may have relatively subtle findings despite clinically important volume depletion.
Age also affects presentation. Infants and young children can become dehydrated rapidly because their fluid requirements and fluid losses are proportionally greater, while they cannot independently obtain fluids or communicate thirst reliably. Older adults are also vulnerable because thirst perception may decline with age, and conditions such as cognitive impairment, mobility limitations, or medications may interfere with adequate fluid intake.
The severity of dehydration also cannot be determined from symptoms alone in every patient. Laboratory testing may be necessary when the clinical picture is unclear or the patient is significantly ill. Serum electrolytes, blood urea nitrogen, creatinine, and other investigations can help identify associated abnormalities and guide management. In patients with cardiac or renal disease, more careful assessment may be required because both dehydration and excessive fluid administration can create significant complications.
For example, consider two patients with similar complaints of weakness and thirst. The first has mild dehydration after exercising in hot weather, remains alert, has stable vital signs, and can drink normally. The second has persistent vomiting, very little urine output, tachycardia, orthostatic hypotension, and increasing confusion. Although both patients are suffering from dehydration, their severity and treatment needs are very different. The first may be managed with appropriate oral replacement and monitoring, whereas the second requires urgent clinical assessment and may require IV Fluids for Dehydration because of significant volume depletion and inability to replace lost fluids adequately by mouth.
Recognizing this progression is central to safe dehydration treatment. The goal is not simply to identify that a patient has lost fluids, but to determine how severe the deficit is, what caused it, whether electrolytes have also been lost, and how effectively the patient can replace those losses. These factors provide the clinical foundation for deciding when oral hydration is sufficient and when intravenous fluid therapy should be considered.
When IV Fluids Are Needed for Dehydration
Not every patient with dehydration requires intravenous treatment. The decision to use IV Fluids for Dehydration should be based on the severity of the fluid deficit, the patient’s ability to drink and absorb fluids, the cause and rate of fluid loss, the presence of circulatory compromise, and the response to oral replacement. In many cases, oral rehydration is effective and avoids the risks associated with an invasive IV procedure. WHO guidance emphasizes that oral rehydration can successfully manage most cases of dehydration, while intravenous treatment becomes particularly important in severe dehydration or when oral replacement is not possible or adequate.
The clinical decision can therefore be viewed as a progression rather than a simple choice between “oral” and “IV.” A patient may begin with oral replacement, require closer observation if losses continue, and then need IV therapy if the condition worsens or oral replacement fails. Conversely, a patient who initially requires IV Fluids for Dehydration may transition back to oral fluids once the circulation and hydration status improve and the patient can drink safely.
Oral Hydration vs. IV Therapy
Oral hydration is generally preferred when the patient is alert, able to drink, able to absorb fluids through the gastrointestinal tract, and does not have severe circulatory compromise. The oral route is less invasive, does not require vascular access, and allows the patient to replace fluid gradually according to tolerance. For dehydration associated with diarrhea, oral rehydration solution (ORS) is particularly important because it contains glucose and electrolytes that facilitate intestinal absorption of water and replace substances lost through stool. WHO identifies ORS as an effective treatment for dehydration in all but the most severe cases of diarrheal illness.
Oral rehydration is different from simply drinking large quantities of plain water. Water provides fluid but does not replace sodium, potassium, and other electrolytes lost through substantial gastrointestinal fluid loss. ORS contains an appropriate combination of water, glucose, and electrolytes designed to promote absorption in the intestine. This is especially relevant when diarrhea is the cause of dehydration, because substantial amounts of water and electrolytes may be lost simultaneously.
For example, consider an otherwise healthy adult who develops mild dehydration after several episodes of diarrhea. The patient is alert, has stable vital signs, can drink without difficulty, and has no evidence of shock. In this situation, oral rehydration would generally be preferable to immediately placing an IV. The patient can receive ORS and be monitored for improvement while the underlying illness and ongoing losses are addressed.
IV Fluids for Dehydration, by contrast, provide fluid directly into the bloodstream. This makes the IV route particularly valuable when the gastrointestinal tract cannot provide adequate replacement or when rapid restoration of circulating volume is required. NICE guidance identifies several circumstances in which intravenous fluids may be necessary, including acute illness requiring substantial fluid for resuscitation, inability to drink, inability to absorb adequate fluid, and excessive ongoing losses.
The differences can be summarized as follows:
Oral hydration
IV therapy
Preferred when the patient can drink safely
Used when oral replacement is inadequate or inappropriate
Requires functioning gastrointestinal absorption
Delivers fluid directly into the bloodstream
Appropriate for many mild and moderate cases
Particularly important in severe dehydration and circulatory compromise
Less invasive
Requires vascular access
ORS replaces water and electrolytes
Allows controlled administration of prescribed IV solutions
Can often continue outside the hospital when clinically appropriate
Usually requires healthcare-professional administration and monitoring
A patient may also move from one route to the other. For instance, a person with significant vomiting may initially be unable to tolerate oral fluids and therefore receive IV treatment. Once vomiting settles and the patient can drink safely, oral fluids can be introduced and the IV infusion can be reduced or discontinued according to the clinical plan. WHO guidance similarly recommends adding ORS when a severely dehydrated patient becomes able to drink and transitioning toward oral replacement as hydration improves.
The important principle is that IV therapy should not replace oral hydration simply because it is faster or more convenient. Intravenous treatment carries potential complications, including fluid overload, electrolyte disturbances, infiltration, phlebitis, and infection. Therefore, the need for an IV should be clinically justified rather than based solely on the presence of dehydration.
Indications for IV Fluids
The primary indication for IV Fluids for Dehydration is a clinically significant fluid deficit that cannot be corrected adequately or safely through oral replacement. The decision should incorporate the patient’s assessment findings rather than relying on a single symptom or laboratory value.
Important indications include:
Severe dehydration Severe dehydration can produce significant circulatory and neurological abnormalities. Patients may develop hypotension, marked tachycardia, weak peripheral pulses, altered mental status, reduced urine output, poor peripheral perfusion, or other evidence of impaired circulation. Severe dehydration requires prompt treatment because prolonged hypoperfusion can damage vital organs. WHO identifies severe dehydration as a medical emergency requiring urgent treatment and recommends immediate IV therapy in appropriate severe cases.
Inability to drink adequately Some patients cannot consume sufficient fluids despite having a significant deficit. Causes may include reduced consciousness, severe weakness, confusion, unsafe swallowing, or physical limitations that prevent independent drinking. In these circumstances, relying on oral intake may delay effective fluid replacement. NICE specifically identifies inability to drink as an indication for intravenous fluid administration.
Persistent vomiting Repeated vomiting can make oral replacement unsuccessful because fluids are expelled before adequate absorption occurs. A patient may repeatedly attempt to drink but continue losing the fluid through emesis. If oral replacement cannot keep pace with ongoing losses, IV Fluids for Dehydration may be necessary while the cause of vomiting is investigated and treated.
Inadequate gastrointestinal absorption Even when a patient can swallow fluids, the gastrointestinal tract may not be capable of absorbing enough fluid to correct the deficit. Certain gastrointestinal conditions can interfere with effective absorption, making intravenous replacement necessary. NICE includes inability to absorb adequate quantities of water among situations in which IV administration may be indicated.
Large ongoing fluid losses Significant diarrhea, extensive sweating, burns, bleeding, or other substantial losses can exceed the patient’s ability to replace fluids orally. In these circumstances, clinicians may need to provide controlled intravenous replacement while continuously assessing ongoing losses and the patient’s response.
Circulatory compromise When dehydration has progressed to significant reduction in circulating volume, the immediate priority may be restoration of adequate tissue perfusion. Signs such as hypotension, tachycardia, weak pulses, altered mental status, and delayed peripheral perfusion indicate that the problem has moved beyond simple thirst or dryness. IV treatment may then be required as part of urgent fluid resuscitation.
Failure of oral rehydration A patient may initially receive oral rehydration but fail to improve because losses remain excessive or the patient cannot tolerate sufficient intake. Lack of clinical improvement requires reassessment of the diagnosis, severity of dehydration, ongoing losses, and treatment approach. WHO guidance supports escalation to intravenous treatment when severe dehydration is present or oral replacement is unsuccessful or impossible.
High-risk clinical circumstances Certain patients require a lower threshold for careful medical assessment because dehydration can progress rapidly or because their ability to compensate for fluid loss is limited. These include some infants and young children, older adults, and people with significant underlying cardiovascular, renal, or other systemic disease.
It is important to understand that an indication for IV therapy does not automatically determine the exact type of IV fluid, volume, or infusion rate. Those decisions depend on the patient’s clinical condition, laboratory findings, ongoing losses, age, body size, and underlying conditions. In other words, identifying that a patient needs an IV for dehydration is only the first step; safe fluid therapy also requires appropriate selection, administration, and reassessment.
For example, imagine a patient with persistent diarrhea who is thirsty but alert and able to drink. If vital signs are stable and oral replacement is tolerated, ORS may be sufficient. If the same patient develops severe weakness, reduced urine output, tachycardia, hypotension, confusion, and an inability to drink adequately, the clinical situation has changed. The patient may now require urgent assessment and IV treatment because oral replacement is no longer sufficient for the degree of fluid depletion.
Severe Dehydration and Urgent Care
Severe dehydration is fundamentally different from uncomplicated thirst or mild fluid loss. At this stage, the reduction in body water and effective circulating volume can interfere with cardiovascular function and tissue perfusion. If treatment is delayed, the patient may progress to hypovolemic shock, acute kidney injury, altered consciousness, and other life-threatening complications.
Signs that should raise concern for severe dehydration include:
Marked weakness or inability to perform normal activities
Very low or markedly reduced urine output
Rapid heart rate
Low blood pressure
Weak or difficult-to-detect peripheral pulses
Cool extremities or poor peripheral perfusion
Significant dizziness or fainting
Confusion, lethargy, or reduced level of consciousness
Inability to drink or inability to keep fluids down
Rapid breathing or other signs of physiological distress
WHO identifies inability to drink, lethargy or unconsciousness, sunken eyes, and markedly delayed skin return among clinical indicators used to identify severe dehydration in diarrheal illness. The exact assessment criteria vary according to age and clinical setting, but the central concern is whether fluid loss has progressed to significant physiological impairment.
A patient showing these findings should receive urgent care rather than being advised simply to increase water intake at home. Severe dehydration requires rapid clinical assessment, determination of the cause, evaluation of circulation and electrolyte status, and prompt fluid replacement when indicated. In severe diarrheal dehydration, WHO recommends immediate IV treatment and continued oral rehydration as soon as the patient can drink.
The urgency becomes particularly apparent in patients with rapidly progressing gastrointestinal losses. Cholera, for example, can produce large-volume watery diarrhea and severe fluid loss within a short period. WHO notes that severe cholera can cause life-threatening dehydration and that patients with severe disease require intravenous fluids alongside ORS and other appropriate treatment.
Example: A patient arrives at an emergency department after several hours of profuse diarrhea and vomiting. The patient is confused, has a rapid pulse, low blood pressure, very little urine output, and cannot keep fluids down. This is not a situation in which oral fluids alone should be relied upon. The patient requires immediate clinical assessment, vascular access, close monitoring, and appropriately prescribed IV Fluids for Dehydration as part of urgent management. Laboratory testing can help identify associated electrolyte and renal abnormalities, but treatment should not be unnecessarily delayed while waiting for laboratory results when severe circulatory compromise is evident.
The management of severe dehydration also requires careful reassessment. Giving an IV solution is not a one-time intervention after which the patient can simply be left unattended. Healthcare professionals need to determine whether circulation, mental status, urine output, and other indicators are improving. NICE emphasizes regular reassessment of patients receiving IV fluid therapy, while WHO guidance for severe dehydration recommends close monitoring and frequent reassessment during IV rehydration.
This monitoring is important because both too little and too much fluid can cause harm. Insufficient replacement may leave the patient hypovolemic and poorly perfused, while excessive administration can contribute to fluid overload, including pulmonary complications in susceptible patients. WHO specifically warns that pulmonary edema can occur when excessive IV fluid is administered during severe dehydration treatment.
For this reason, the decision to get IV treatment should be viewed as part of a broader clinical process:
Assess the severity of dehydration.
Identify the cause and ongoing sources of fluid loss.
Determine whether oral replacement is possible and adequate.
Identify signs of circulatory compromise or severe illness.
Initiate IV therapy when clinically indicated.
Select and administer an appropriate IV solution according to the patient’s condition and prescribed treatment.
Continuously reassess the patient’s response and adjust treatment as needed.
Transition toward oral hydration when the patient is stable and able to drink safely.
The central principle is that IV Fluids for Dehydration are a treatment for clinically significant fluid deficits, not simply a faster alternative to drinking fluids. Mild cases can often be managed effectively through oral hydration, while patients with severe dehydration, substantial ongoing losses, inability to drink or absorb fluids, or circulatory compromise may require intravenous replacement. Recognizing that distinction allows fluid therapy to be used appropriately while reducing unnecessary IV exposure and its associated risks.
Types of IV Fluids for Dehydration
Choosing the appropriate IV fluids for dehydration is an important part of intravenous fluid therapy because different solutions have different concentrations of sodium, chloride, potassium, glucose, and other components. The type of IV fluid determines how administered water and electrolytes distribute between the bloodstream and the body’s fluid compartments. Therefore, an IV solution should be selected according to the patient’s degree and type of fluid loss, electrolyte status, hemodynamic condition, ongoing losses, age, and underlying medical conditions.
Most IV fluids used for dehydration are crystalloid solutions. Crystalloids contain water and small dissolved substances that can move across capillary membranes. Common examples include normal saline, Lactated Ringer’s solution, half-normal saline, and dextrose-containing solutions. Isotonic crystalloids such as 0.9% sodium chloride and Lactated Ringer’s are commonly used when the immediate goal is to restore extracellular and intravascular volume.
The terms isotonic, hypotonic, and hypertonic describe the relative concentration or osmotic characteristics of an IV solution compared with plasma. Understanding these categories helps nurses anticipate where water will move after an IV fluid is administered. However, tonicity alone should never determine which fluid a patient receives. A solution that is appropriate in one clinical situation may be inappropriate or potentially harmful in another.
Normal Saline
Normal saline, also called 0.9% sodium chloride (0.9% NaCl), is one of the most commonly used IV fluids for dehydration. It is generally classified as an isotonic crystalloid because its effective osmotic concentration is similar to that of plasma. When infused intravenously, normal saline expands the extracellular fluid compartment and can increase intravascular volume.
Normal saline contains sodium and chloride but does not contain potassium, calcium, lactate, or glucose. This composition makes it relatively straightforward to use when the immediate objective is to replace extracellular fluid and sodium-containing losses without administering additional electrolytes or glucose through the same solution.
For example, consider an adult with significant fluid loss from repeated vomiting who has become hypotensive and has poor peripheral perfusion. An isotonic solution such as normal saline may be selected to help restore circulating volume while the underlying cause and laboratory abnormalities are evaluated. The precise amount and rate depend on the patient’s clinical condition and the treatment protocol being followed.
Normal saline is also useful when a patient requires rapid volume replacement and a balanced crystalloid is unavailable. WHO guidance for severe dehydration identifies normal saline as an alternative when Ringer’s lactate is unavailable.
However, normal saline is not simply a universal solution for dehydration. Large amounts can produce a substantial chloride load. This may contribute to hyperchloremia and hyperchloremic metabolic acidosis, particularly when considerable volumes are administered. Balanced crystalloids such as Lactated Ringer’s contain less chloride and may therefore be preferred in some clinical circumstances.
A useful nursing consideration is that normal saline does not replace every electrolyte that may have been lost. A patient experiencing prolonged vomiting or diarrhea may have potassium and other electrolyte abnormalities that require laboratory assessment and targeted management rather than assuming that sodium-containing fluid alone will correct the entire deficit.
Example: A patient with severe diarrhea may lose water, sodium, potassium, chloride, and bicarbonate. Administering normal saline can help restore extracellular volume, but it does not automatically replace potassium or correct every electrolyte abnormality. The patient’s laboratory results, ongoing losses, and clinical response must therefore guide further treatment.
Normal saline is consequently an important IV for dehydration, particularly when extracellular volume replacement is needed, but the clinical context determines whether it is the best choice.
Lactated Ringer’s Solution
Lactated Ringer’s solution (LR), also known as Ringer’s lactate or Hartmann’s solution in some settings, is another commonly used isotonic crystalloid. It contains sodium, chloride, potassium, calcium, and lactate in concentrations designed to provide a more balanced electrolyte composition than normal saline.
The presence of several electrolytes makes Lactated Ringer’s particularly useful when dehydration is accompanied by broader electrolyte and extracellular fluid losses. WHO guidance identifies Ringer’s lactate as a first-choice IV fluid for severe dehydration in several diarrheal disease treatment protocols, with normal saline used as an alternative when it is unavailable.
One important distinction between Lactated Ringer’s and normal saline is their chloride content. Lactated Ringer’s has a lower chloride concentration and includes a buffering component. This can reduce the likelihood of hyperchloremic metabolic acidosis when compared with large-volume administration of normal saline. Merck Manual notes that Ringer’s lactate and other buffered solutions may reduce the development of hyperchloremic metabolic acidosis.
The lactate in Lactated Ringer’s should not be confused with lactic acid accumulation caused by tissue hypoxia. Lactate in the solution is metabolized by the body and contributes to bicarbonate generation under appropriate metabolic conditions.
Lactated Ringer’s also contains a small amount of potassium and calcium. These components are generally useful in fluid replacement, but they mean the solution is not interchangeable with every other crystalloid in every clinical circumstance. The patient’s electrolyte results, renal function, acid-base status, and other conditions should be considered before selecting a particular fluid.
Example: Suppose a patient develops significant dehydration after several days of diarrhea. Because gastrointestinal losses can involve multiple electrolytes, a balanced crystalloid such as Lactated Ringer’s may be appropriate for intravascular volume replacement when IV therapy is clinically indicated. Oral rehydration should be resumed when the patient can safely drink, because IV therapy does not replace the role of oral electrolyte and nutrient intake during recovery.
Lactated Ringer’s is therefore an important option among fluids used for dehydration, especially when the clinical objective includes restoring extracellular volume while providing a more balanced electrolyte composition.
It is important, however, not to interpret “balanced” as meaning that Lactated Ringer’s is automatically the best IV fluid for every patient. Certain neurologic conditions, electrolyte abnormalities, metabolic problems, and other circumstances may influence fluid selection. The solution must be matched to the patient’s specific clinical needs.
Hypotonic, Hypertonic, and Dextrose Solutions
Not all IV fluids for dehydration are isotonic. IV solutions can also be classified as hypotonic or hypertonic, and some contain dextrose. These fluids have different effects on the distribution of water between the extracellular and intracellular compartments.
Hypotonic solutions have a lower effective osmotic concentration than plasma. Examples include 0.45% sodium chloride, commonly called half-normal saline, and certain dextrose-containing solutions after the dextrose is metabolized.
Hypotonic fluids generally allow more water to move into cells and are therefore not the preferred choice when the immediate problem is significant intravascular volume depletion requiring rapid resuscitation. Merck specifically notes that hypotonic fluids such as 0.45% saline and D5W should not be used for resuscitation because relatively little of the infused fluid remains in the intravascular compartment.
However, hypotonic solutions can have a role in carefully selected patients after initial intravascular volume has been restored, particularly when the remaining problem involves a free-water deficit rather than significant extracellular volume depletion. The patient’s serum sodium, osmolality, renal function, urine output, and overall fluid status must be considered.
For example, a patient may initially require an isotonic crystalloid to correct clinically significant volume depletion. Once circulation has been stabilized, a clinician may reassess the remaining water deficit and electrolyte abnormalities and determine whether a different solution is appropriate. This illustrates why the type of fluid may change during treatment rather than remaining the same throughout the entire course of IV therapy.
Hypertonic solutions have a higher effective osmotic concentration than plasma. Examples include 3% sodium chloride. Hypertonic saline draws water toward the extracellular compartment and is primarily used for specific indications, such as certain cases of severe symptomatic hyponatremia or neurologic conditions involving cerebral edema. It is not a routine IV treatment for dehydration.
Because hypertonic solutions can produce rapid changes in serum sodium and fluid distribution, they require careful clinical assessment and monitoring. They should not be selected simply because a patient has severe dehydration.
Dextrose solutions contain glucose in water or in combination with saline. Common examples include D5W, which contains 5% dextrose in water, and solutions containing both dextrose and sodium chloride.
Dextrose-containing IV solutions have specialized roles. Dextrose can provide glucose and, depending on the solution, can contribute to water replacement after glucose is metabolized. However, plain dextrose in water is not an adequate stand-alone replacement for the electrolyte losses associated with many cases of severe dehydration. WHO guidance specifically cautions against using plain 5% glucose alone for severe dehydration because it does not provide the electrolytes needed to correct major electrolyte deficits.
This distinction is particularly important when dehydration results from diarrhea or vomiting. A patient may have lost sodium, chloride, potassium, and other electrolytes in addition to water. Giving a solution that contains only water and glucose does not adequately replace those extracellular electrolytes.
Dextrose may nevertheless be incorporated into an appropriate IV fluid regimen when clinically indicated. For example, a patient may require a dextrose-containing solution because of hypoglycemia, an ongoing glucose requirement, or a particular electrolyte and fluid management strategy. The reason for adding dextrose should be clinically established rather than assuming that glucose automatically makes an IV solution a better solution for dehydration.
The following comparison illustrates the major differences:
IV fluid category
Examples
General characteristics
Common clinical role
Isotonic crystalloid
0.9% normal saline, Lactated Ringer’s
Expands extracellular/intravascular volume
Initial volume replacement when clinically indicated
Hypotonic
0.45% saline
Provides proportionally more free water to cells
Selected water-deficit/electrolyte situations after assessment
Hypertonic
3% saline
Raises extracellular osmolality and serum sodium
Specific indications such as severe symptomatic hyponatremia; not routine dehydration treatment
Dextrose-containing
D5W, dextrose-saline combinations
Provides glucose and, depending on formulation, water/electrolytes
Selected metabolic, maintenance, or electrolyte situations
The exact formulation, concentration, indication, and administration rate vary by patient and clinical protocol. Nurses should therefore verify the prescribed solution and concentration rather than relying on the name of a fluid alone.
Choosing the Best IV Fluid
There is no single best IV fluid for every patient with dehydration. The appropriate IV fluids for dehydration depend on what the patient has lost, what needs to be restored, and whether the immediate priority is intravascular volume expansion, correction of an electrolyte abnormality, replacement of free water, or management of an ongoing loss.
A useful way to approach fluid selection is to consider several clinical questions.
First, what type of fluid has the patient lost? Fluid loss from vomiting, diarrhea, sweating, burns, kidney losses, or other causes may have different electrolyte compositions. Merck notes that volume depletion can result from vomiting, diarrhea, excessive sweating, burns, diuretic use, and renal disorders, and treatment requires replacement of both sodium and water while addressing the underlying cause.
Second, is the patient intravascularly depleted? If significant extracellular or intravascular volume depletion is present, an isotonic crystalloid is generally considered rather than immediately choosing a hypotonic solution. Normal saline and Lactated Ringer’s are the major examples. These fluids remain sufficiently within the extracellular compartment to support circulating volume more effectively than hypotonic solutions.
Third, what do the laboratory results show? Serum sodium, potassium, chloride, bicarbonate, glucose, creatinine, and other relevant laboratory values can influence fluid selection. A patient with a major electrolyte disturbance may need a different approach from someone who simply needs volume replacement.
Fourth, what is the patient’s underlying medical condition? A patient with heart failure or significant kidney dysfunction may be less able to tolerate large volumes of IV fluid. In such patients, fluid administration requires particularly careful monitoring because fluid overload can produce peripheral edema, pulmonary congestion, impaired oxygenation, and other complications. Merck emphasizes that fluid administration must be guided by the patient’s clinical status and that excessive administration can result in fluid overload.
Fifth, are there ongoing losses? Rehydration does not end when the initial IV bag is completed. Continued vomiting, diarrhea, fever, excessive sweating, high-output drainage, or other losses may continue to remove water and electrolytes. The treatment plan may therefore need adjustment according to the patient’s changing fluid levels and ongoing losses.
For example, consider three different patients:
Patient A: An otherwise healthy adult has significant vomiting and diarrhea with signs of extracellular volume depletion. An isotonic crystalloid such as normal saline or Lactated Ringer’s may be selected for IV fluid replacement while the cause and electrolyte abnormalities are assessed.
Patient B: A patient has a specific free-water deficit after initial circulation has been stabilized. A hypotonic solution may be considered if appropriate to the patient’s sodium level and overall condition.
Patient C: A patient has severe symptomatic hyponatremia rather than uncomplicated dehydration. A carefully controlled hypertonic saline regimen may be indicated, but this is a specialized electrolyte emergency rather than routine IV hydration therapy.
These examples demonstrate why the phrase “best IV fluid” must always be interpreted in context. The goal is not simply to put fluid into the bloodstream; it is to restore the appropriate compartment and correct the relevant fluid and electrolyte disturbance without creating a new problem.
For severe dehydration associated with diarrheal illness, WHO guidance identifies Ringer’s lactate as the preferred IV fluid in its relevant treatment protocols, with normal saline as an alternative when Ringer’s lactate is unavailable. For other causes of dehydration, fluid selection may differ according to the patient’s clinical and laboratory findings.
Nursing assessment plays a central role in this decision-making process. Before and during IV fluid therapy, the nurse should pay attention to blood pressure, heart rate, respiratory status, peripheral perfusion, urine output, weight when appropriate, mental status, laboratory findings, intake and output, and signs of fluid overload. The response to the infusion of fluids should be reassessed rather than assuming that the prescribed volume will produce the expected response.
It is also important to recognize that IV fluids used for dehydration are not a substitute for treating the underlying cause. A patient who is dehydrated because of persistent vomiting, diarrhea, uncontrolled hyperglycemia, excessive diuretic use, infection, heat exposure, or another condition may continue to lose fluid after IV therapy begins. Effective fluid therapy therefore combines appropriate fluid selection with treatment of the cause, replacement of ongoing losses, electrolyte management, and reassessment.
The central principle is that the best IV fluid is the solution that most appropriately matches the patient’s current physiological needs. Isotonic crystalloids are commonly used when extracellular volume needs to be restored, while hypotonic, hypertonic, and dextrose-containing solutions have more specific indications. Careful assessment allows intravenous fluid therapy to restore hydration and fluid and electrolyte balance while reducing the risk of inappropriate fluid administration.
Oral Hydration Vs Therapy
How IV Fluids Treat Dehydration
IV fluids for dehydration work by replacing water and electrolytes that the body has lost and by restoring the physiological conditions necessary for normal circulation, cellular function, and organ perfusion. Unlike fluids taken by mouth, an IV fluid is delivered directly into the vascular system, allowing it to become immediately available for distribution throughout the extracellular fluid compartment.
The physiological goal of intravenous fluid therapy is not simply to increase the amount of water in the body. Effective IV rehydration must address the relationship between water, sodium, potassium, chloride, and other electrolytes while also considering the movement of fluid between the intravascular, interstitial, and intracellular compartments. NICE describes the fundamental objectives of IV fluid administration as replacing normal and abnormal fluid and electrolyte losses, replenishing significant deficits or ongoing losses, supporting circulation when necessary, and avoiding excessive fluid accumulation.
This means that IV fluids for dehydration can serve several related purposes. They may restore circulating volume, improve tissue perfusion, replace extracellular fluid, correct selected electrolyte abnormalities, and provide water when the patient cannot adequately replace losses through oral intake.
The response to IV hydration is therefore assessed clinically rather than by simply counting how many bags of fluid have been administered. Blood pressure, heart rate, peripheral perfusion, urine output, mental status, respiratory findings, body weight, laboratory results, and ongoing losses can all help determine whether fluid replacement is achieving its intended effect.
Intravenous Fluid Replacement
The central principle of IV therapy for dehydration is intravenous fluid replacement. This means providing an appropriate amount and type of fluid to compensate for an existing deficit and, when necessary, replace continuing losses.
When an IV fluid enters a peripheral vein, it first enters the intravascular space. From there, water and dissolved substances distribute between the vascular and interstitial spaces according to the characteristics of the solution and the body’s physiological conditions. Isotonic crystalloids primarily expand the extracellular compartment, making them useful when the immediate problem involves extracellular or intravascular volume depletion.
This process can be understood through a simple example. Imagine a patient who has lost a substantial amount of fluid through several days of vomiting and diarrhea. The patient may have reduced circulating volume, resulting in decreased venous return to the heart and reduced tissue perfusion. When an appropriate isotonic crystalloid is administered, part of the infused volume remains in the intravascular space and part distributes into the interstitial space. As circulating volume improves, cardiac filling and tissue perfusion can improve as well.
The objective is therefore more than simply “putting fluid into the patient.” The goal is to restore sufficient circulating volume to support the delivery of oxygen and nutrients to tissues while maintaining appropriate fluid distribution.
NICE emphasizes that IV fluids should be prescribed following clinical assessment, biochemical evaluation, and review of available fluid-balance information such as intake and output and body weight.
IV fluid replacement generally addresses three related components:
Replacement of the existing deficit – correcting fluid that has already been lost.
Replacement of ongoing losses – compensating for continued vomiting, diarrhea, drainage, excessive urine production, or other losses.
Maintenance of appropriate fluid status – providing enough fluid to meet physiological requirements while oral intake remains inadequate or unavailable.
These components should not be confused. A patient may receive enough fluid to correct an initial deficit but continue to require replacement if diarrhea or vomiting persists.
For example, suppose a patient receives IV fluids after arriving at an urgent care or hospital with significant dehydration caused by gastroenteritis. If the patient continues having frequent watery stools, the original fluid deficit may improve while new losses continue to occur. The healthcare team therefore reassesses the patient and adjusts the infusion of fluids according to clinical response and ongoing losses.
The rate of IV infusion is also important. Administering fluid too slowly may fail to correct clinically important volume depletion, whereas administering excessive amounts too rapidly can contribute to fluid overload. The appropriate rate depends on the patient’s condition, the purpose of therapy, the selected solution, age, weight, cardiac function, kidney function, and relevant clinical protocols.
In patients with severe dehydration, rapid IV rehydration may be necessary because inadequate circulating volume can threaten organ perfusion. For example, CDC guidance for children with severe dehydration describes immediate IV rehydration with an isotonic solution such as Lactated Ringer’s or normal saline, with repeated assessment of pulse, perfusion, and mental status.
The response to IV treatment is therefore dynamic. A patient may initially require more intensive fluid replacement and then require a slower rate or transition to oral hydration after circulation and hydration have improved.
Another important concept is that IV fluids do not remove the cause of dehydration. If a patient is dehydrated because of uncontrolled vomiting, diarrhea, excessive sweating, fever, diuretic therapy, hyperglycemia, or another condition, the underlying problem must also be addressed. Otherwise, fluid loss can continue despite treatment.
The nurse therefore observes whether the patient’s condition is moving in the expected direction. Improving blood pressure, stronger peripheral pulses, improved capillary refill, increasing urine output, improved alertness, and decreasing thirst may indicate a favorable response, although these findings must always be interpreted within the broader clinical picture.
Conversely, increasing respiratory distress, new crackles, worsening edema, falling oxygen saturation, or rapidly increasing body weight may suggest that fluid administration is exceeding the patient’s ability to handle the volume. In that situation, continuing to administer fluid without reassessment could be harmful.
Electrolyte and Fluid Balance
Water cannot be considered separately from electrolytes when discussing IV fluids for dehydration. Sodium, potassium, chloride, bicarbonate, calcium, and other electrolytes participate in processes essential for cellular function, nerve transmission, muscle contraction, acid-base regulation, and maintenance of normal fluid distribution.
The most important extracellular electrolyte is sodium. Sodium contributes substantially to extracellular osmolality and therefore plays a major role in determining where water is distributed within the body. When substantial amounts of sodium and water are lost together, replacing only water may not adequately restore fluid and electrolyte balance.
This is one reason that the selection of an IV solution must be based on the patient’s physiological needs rather than simply choosing the solution that contains the greatest amount of water.
For example, a patient with substantial gastrointestinal losses may lose both water and sodium. Administration of an appropriate isotonic crystalloid can replace extracellular fluid and sodium-containing losses. However, if laboratory testing demonstrates a significant potassium abnormality, that problem may require additional management rather than assuming that the initial IV solution will correct it.
Fluid balance describes the relationship between fluid entering the body and fluid leaving it. Intake may include oral fluids, enteral fluids, IV fluids, and medications administered in solution. Output may include urine, vomiting, diarrhea, drainage, bleeding, and insensible losses through the skin and respiratory tract.
In a patient receiving IV hydration therapy, nurses frequently monitor this balance through intake and output measurements. A patient may appear to be receiving substantial amounts of fluid, but if losses remain high, the net fluid balance may still be inadequate.
Conversely, a positive fluid balance that becomes excessive can be harmful, particularly in patients with limited cardiac or renal reserve.
Electrolyte balance is equally important. Different causes of dehydration can produce different electrolyte patterns.
For example:
Vomiting can result in loss of hydrogen ions, chloride, sodium, potassium, and water, with the precise biochemical effects depending on the duration and severity of the vomiting and other factors.
Diarrhea can result in substantial losses of water and electrolytes, including sodium, potassium, chloride, and bicarbonate.
Excessive sweating primarily involves water and sodium losses, although sweat also contains smaller quantities of other electrolytes.
Excessive urine production can produce water and electrolyte losses that vary according to the underlying cause.
This variation explains why the same IV for dehydration should not automatically be used for every patient.
Laboratory assessment can help identify abnormalities that are not obvious from physical examination alone. Depending on the clinical situation, healthcare professionals may evaluate serum sodium, potassium, chloride, bicarbonate, glucose, urea, creatinine, and other measurements.
The goal is not necessarily to normalize every laboratory value immediately. Rapid correction of certain electrolyte abnormalities can itself be dangerous. Instead, treatment should correct abnormalities at an appropriate rate while restoring overall fluid and electrolyte balance.
A useful example is a patient with severe hypernatremic dehydration. The patient has both water depletion and an elevated serum sodium concentration. Although the patient needs fluid replacement, rapidly giving large quantities of hypotonic fluid without appropriate assessment could cause an excessively rapid fall in serum sodium and potentially serious neurological complications. Such patients require carefully controlled rehydration and monitoring.
The opposite problem can occur with excessive free-water administration. If water is given without sufficient attention to sodium balance, serum sodium can fall to dangerously low levels.
Therefore, IV fluid therapy involves balancing two interconnected objectives:
Replace what has been lost while avoiding an inappropriate change in the concentration of what remains.
This principle is particularly important in patients with prolonged dehydration, abnormal serum sodium, kidney disease, heart failure, endocrine disorders, or other conditions that affect the body’s ability to regulate water and electrolytes.
The extracellular fluid compartment is especially relevant during the initial treatment of significant volume depletion. Isotonic crystalloids expand extracellular volume, while different IV solutions have different effects on water distribution. Understanding these movements helps nurses anticipate why a particular type of fluid has been prescribed and what clinical response should be monitored.
Electrolytes also influence cellular function. Potassium, for instance, is essential for normal cardiac and skeletal muscle activity. A patient who has lost potassium through prolonged gastrointestinal or renal losses may require potassium replacement, but potassium should not be added to an IV solution without appropriate clinical assessment and safeguards.
This is why fluid and electrolyte balance should be considered together rather than treating dehydration as an isolated water deficit.
Rehydration After Vomiting and Diarrhea
Vomiting and diarrhea are among the most common causes of substantial fluid loss because they can remove both water and electrolytes. When these losses occur repeatedly, the patient can become progressively dehydrated, particularly when fluid intake is unable to keep pace with losses.
IV fluids for dehydration caused by vomiting and diarrhea are used when the patient’s clinical condition requires intravenous replacement. However, IV therapy does not mean that oral rehydration should be abandoned as soon as an IV is started. When the patient can safely drink and gastrointestinal absorption is adequate, oral rehydration remains an important component of recovery.
CDC guidance emphasizes that oral rehydration is the standard approach for many cases of acute gastroenteritis and that IV therapy is particularly important when severe dehydration is present.
The physiological challenge is that vomiting and diarrhea can continue while treatment is taking place. A patient may therefore have two simultaneous problems:
an existing fluid deficit + continuing gastrointestinal losses.
The initial IV treatment addresses the existing deficit and circulatory needs, while continued assessment is necessary to determine whether additional replacement is required.
Consider a patient who has experienced 12 episodes of watery diarrhea and repeated vomiting over 24 hours. The patient arrives with significant dehydration and cannot initially tolerate oral fluids. An appropriate IV treatment may be started to restore circulating volume. While the IV infusion is running, the healthcare team continues monitoring stool frequency, vomiting, urine output, vital signs, mental status, and relevant laboratory findings.
Once vomiting becomes less frequent and the patient can tolerate small amounts of oral fluid, the treatment approach can begin shifting toward oral rehydration.
This transition is important because the gastrointestinal tract is normally the preferred route for maintaining hydration whenever it can be used safely and effectively. IV therapy is invasive and carries risks that oral rehydration does not, including IV-site complications, infection, and fluid administration errors.
Rehydration After Vomiting
Vomiting presents a particular challenge because giving large amounts of fluid at once can trigger additional vomiting.
When a patient is able to drink, small and frequent amounts of an appropriate oral rehydration solution may be better tolerated than large volumes at once. CDC guidance notes that many vomiting patients can still be successfully rehydrated by giving small volumes of ORS frequently and gradually increasing the amount as tolerated.
When vomiting is severe and the patient cannot maintain adequate oral intake, getting IV fluids may become necessary depending on the degree of dehydration and clinical condition.
For example, a patient who vomits immediately after every attempt to drink may be unable to replace ongoing losses despite understanding the importance of hydration. If dehydration becomes significant, IV rehydration can temporarily bypass the gastrointestinal tract and provide direct access to the vascular system.
As hydration improves, vomiting may also decrease. In children with acute gastroenteritis, CDC notes that correction of dehydration can lessen vomiting and that small, frequent amounts of oral rehydration solution may still be successful even when vomiting is present.
The nurse should therefore avoid assuming that every episode of vomiting means oral hydration has completely failed. The patient’s ability to tolerate small amounts, frequency of vomiting, hydration status, and overall condition determine whether oral or IV replacement is appropriate.
Rehydration After Diarrhea
Diarrhea can produce very large quantities of stool containing water and electrolytes. The treatment challenge is therefore not only to correct the initial deficit but also to replace lost fluids as diarrhea continues.
For patients who can drink, oral rehydration solution is particularly valuable because it provides both water and electrolytes. The intestinal sodium-glucose transport mechanism allows sodium and water to be absorbed together, which is the physiological basis for the effectiveness of oral rehydration therapy.
When dehydration is severe, IV fluids may be required first. CDC guidance recommends immediate IV rehydration for severe dehydration and emphasizes close monitoring of pulse, perfusion, mental status, and other clinical findings.
For example, consider an adult with profuse diarrhea who arrives with marked weakness, poor peripheral perfusion, and inability to drink enough to compensate for losses. An appropriate isotonic IV fluid may be administered to restore circulating volume. Once the patient is stabilized and able to drink, oral rehydration can be incorporated into ongoing management.
The distinction between rehydration and maintenance is particularly important in gastrointestinal illness. Rehydration replaces the deficit that already exists. Maintenance and ongoing-loss replacement address what the patient continues to lose afterward. CDC describes acute gastroenteritis treatment in these phases and recommends continuing to replace fluid losses from vomiting and diarrhea while maintaining appropriate nutrition.
Nutrition also matters during recovery. Prolonged restriction of food can contribute to nutritional deficits, especially in children. CDC recommends returning to an age-appropriate diet after rehydration rather than unnecessarily withholding nutrition.
Therefore, IV fluids used for dehydration should be viewed as one component of a broader rehydration strategy. The complete approach may include:
Monitoring urine output and other indicators of response.
Treating the underlying cause of the gastrointestinal illness when necessary.
Resuming oral fluids as soon as they can be tolerated safely.
Returning to appropriate nutrition during recovery.
A patient with mild dehydration from diarrhea may never need an IV drip if oral rehydration is effective. A patient with severe dehydration, shock, persistent inability to drink, or inadequate gastrointestinal absorption may require immediate IV rehydration. CDC guidance specifically identifies severe dehydration as a medical emergency requiring immediate IV treatment.
This illustrates an important principle in IV therapy for dehydration: the route of fluid administration should change according to the patient’s physiological needs. IV therapy can provide rapid and controlled fluid replacement when necessary, but once the patient is stable and capable of maintaining hydration through the gastrointestinal tract, oral hydration becomes an important part of continued recovery.
Careful reassessment is essential throughout the process. A patient who initially needs an IV for dehydration may no longer require intravenous therapy several hours later. Conversely, a patient whose condition is deteriorating despite initial treatment may require additional investigation, adjustment of fluid therapy, or treatment of another underlying condition.
The effectiveness of IV hydration should therefore be judged by the patient’s clinical response rather than by the volume of fluid administered alone. Restoration of appropriate circulation, improving urine output, improved mental status and peripheral perfusion, stabilization of vital signs, correction of relevant electrolyte abnormalities, and the ability to resume adequate oral intake are all important indicators that the rehydration strategy is working.
For patients with vomiting and diarrhea, the most effective treatment for dehydration is consequently individualized. IV fluids can rapidly replace water and electrolytes when oral replacement is inadequate, while oral rehydration and appropriate nutrition remain central to continued recovery once the patient can tolerate them.
IV Fluid Administration and Nursing Care
The safe administration of IV fluids for dehydration requires much more than inserting an IV catheter and connecting an infusion bag. Intravenous fluid therapy is a clinical intervention that requires appropriate assessment, preparation, administration, monitoring, documentation, and reassessment. The nurse plays an important role in identifying changes in the patient’s condition, maintaining the safety of the IV system, recognizing complications, and determining whether the patient is responding appropriately to fluid therapy.
Before administering IV fluids, the patient’s clinical condition should be assessed carefully. The healthcare team considers the patient’s hydration status, vital signs, weight, urine output, fluid intake and losses, relevant laboratory results, underlying conditions, prescribed IV solution, and the reason for treatment. NICE emphasizes that patients receiving IV fluids require competent assessment of their fluid and electrolyte needs and ongoing monitoring of their response because the appropriate volume and rate cannot always be predicted from the initial assessment alone.
The nursing process continues throughout the infusion. A patient who initially requires rapid IV rehydration may later need a slower infusion, a different fluid strategy, or a transition to oral hydration. Conversely, inadequate improvement may indicate that additional fluid replacement is needed or that another condition is contributing to the patient’s symptoms.
Preparing for IV Treatment
Preparation for IV treatment begins with assessment rather than with the IV insertion itself. The nurse should verify the prescription or treatment protocol, identify the patient correctly, assess the patient’s condition, review relevant laboratory information, and determine whether there are factors that could affect the safety of fluid administration.
The initial assessment should establish a clinical baseline against which the patient’s response can be compared. Depending on the patient’s condition, this may include:
Blood pressure
Heart rate
Respiratory rate
Oxygen saturation
Temperature
Level of consciousness and mental status
Peripheral perfusion and capillary refill
Skin and mucous membrane findings
Urine output
Recent body weight
Current oral and IV fluid intake
Recent vomiting, diarrhea, bleeding, drainage, or other fluid losses
Relevant electrolyte, renal, glucose, and acid-base results
Presence of edema or other evidence of excessive fluid accumulation
Body weight can be particularly useful when evaluating changes in fluid volume because relatively rapid changes in weight can reflect changes in total body water. NICE recommends considering weight, fluid balance charts, clinical examination, and laboratory findings when assessing patients receiving IV fluids.
The nurse should also review the patient’s medical history. Conditions such as heart failure, kidney impairment, liver disease, severe malnutrition, and certain endocrine disorders can alter the patient’s response to IV fluids for dehydration. A patient with reduced cardiac or renal reserve may be unable to tolerate the same volume or infusion rate as an otherwise healthy patient.
For example, consider two adults who arrive with dehydration after several days of gastrointestinal illness. One has no significant medical history, while the other has advanced kidney disease and a history of fluid retention. Although both patients may require fluid replacement, the second patient requires especially careful assessment and monitoring because excess fluid may accumulate more readily.
Verifying the IV Fluid Prescription
Before beginning the infusion, the nurse should verify:
The correct patient.
The prescribed IV fluid or solution.
The concentration and volume.
The prescribed infusion rate or treatment schedule.
The route and appropriate IV access.
The indication for the therapy.
Any additives or medications prescribed with the fluid.
Relevant allergies or contraindications.
The prescribed monitoring requirements.
The IV solution should be inspected for its integrity, expiration date, clarity, and evidence of contamination, leakage, particles, or damage to the container.
The nurse should also verify whether the solution corresponds with the current treatment plan. This is particularly important because types of IV fluids have different physiological effects. A bag containing normal saline should not be assumed to be interchangeable with Lactated Ringer’s, a hypotonic solution, or a dextrose-containing solution.
Assessing the IV Site
The selected IV site should be assessed before administration. The nurse considers the condition of the vein, surrounding skin, previous IV sites, and the suitability of the selected catheter for the prescribed therapy.
A functioning peripheral IV should allow appropriate infusion without excessive resistance, swelling, leakage, or significant pain. The site should be monitored for signs of infiltration, extravasation, phlebitis, bleeding, or infection.
If an IV site is already present, the nurse should not assume that it remains functional simply because it was previously working. The site should be inspected and assessed according to institutional policy before continuing the infusion.
Preparing the Patient
The patient should be informed about what is being done and why getting IV fluids may be necessary. Explaining the procedure can reduce anxiety and encourages the patient to report symptoms such as pain, burning, swelling, shortness of breath, or discomfort during the infusion.
For example, a patient receiving an IV drip after severe vomiting may be told that the IV provides fluid directly into the bloodstream because the patient has not been able to replace losses adequately by mouth. The patient should also understand that oral fluids may be reintroduced when tolerated.
Patient education should include instructions to report:
Pain or burning at the IV site
Swelling or tightness around the catheter
Leakage
Chills or sudden discomfort
Shortness of breath
Chest discomfort
Increasing weakness
Any new or unusual symptoms
Preparation should also include appropriate hand hygiene and aseptic technique. The IV equipment must be handled carefully to reduce the risk of introducing microorganisms into the vascular system.
Starting and Managing the IV Drip
Once the patient has been assessed and the prescribed IV solution verified, the nurse establishes or accesses appropriate venous access according to institutional policy and scope of practice. The catheter is secured, the infusion system is connected, and the prescribed IV fluid is initiated at the ordered rate.
The exact procedure for IV insertion varies according to institutional policy, available equipment, patient age, clinical setting, and the nurse’s scope of practice. Regardless of the specific equipment used, the principles of correct patient identification, aseptic technique, correct solution, correct rate, appropriate access, and ongoing assessment remain essential.
The nurse should ensure that the IV line is appropriately primed according to the equipment manufacturer’s instructions and local policy. Air should be managed according to institutional procedures, and connections should be secure.
Controlling the Infusion Rate
The rate of IV infusion is a critical component of treatment. The prescribed rate should not be treated as an insignificant technical detail because the rate determines how quickly fluid enters the patient’s circulation.
A patient receiving IV fluids for dehydration may require a different infusion rate depending on whether the purpose is rapid volume replacement, correction of an existing deficit, replacement of ongoing losses, or maintenance.
For severe dehydration associated with diarrheal disease, WHO guidance describes rapid IV rehydration with Ringer’s lactate as a first-choice solution in its relevant treatment protocols, with close reassessment during therapy.
The exact regimen, however, should be determined by the applicable clinical protocol and the individual patient’s condition. The nurse should never independently increase the infusion rate simply because the patient still reports thirst or weakness.
For example, if a patient is prescribed an isotonic crystalloid at a specified rate, the nurse should administer it according to the prescription and monitor the patient’s response. If the patient remains hypotensive or poorly perfused, the nurse should promptly communicate the finding so that the treatment plan can be reassessed rather than simply increasing the rate without authorization.
Managing the IV Line
During IV hydration, the nurse should maintain the integrity of the infusion system. This includes checking connections, tubing, the catheter site, the remaining fluid volume, and the prescribed rate.
The nurse should also ensure that the IV bag or container is correctly labeled when required by institutional policy. Any additives should be verified carefully because an incorrect additive or concentration can cause serious harm.
The infusion pump, when used, should be programmed according to the prescribed rate and checked for alarms or interruptions. If a pump indicates occlusion or another problem, the nurse should assess the entire system and the patient rather than repeatedly overriding the alarm.
The IV line should also be protected from unnecessary manipulation. Every break in the system can create an opportunity for contamination.
Example of IV Fluid Management
Consider a patient admitted after several days of vomiting and diarrhea. The patient has poor oral intake and requires IV rehydration.
The nurse verifies the prescribed isotonic crystalloid, establishes appropriate IV access, begins the infusion at the prescribed rate, and documents the intervention. During the first part of the infusion, the nurse reassesses blood pressure, heart rate, peripheral perfusion, urine output, mental status, and the IV site.
If the patient’s blood pressure improves and perfusion becomes better without signs of fluid overload, the response suggests that the fluid replacement is having the desired effect.
If the patient develops worsening shortness of breath, crackles, new edema, or other concerning findings, the nurse should recognize that the expected response is not occurring and promptly escalate the concern for further assessment.
Monitoring the Patient During IV Infusion
Monitoring is one of the most important nursing responsibilities during IV fluid therapy. The patient should not be considered “treated” simply because the IV has been started.
NICE emphasizes the importance of regular reassessment because the patient’s response to IV fluids can change over time. Fluid therapy should be adjusted or stopped when appropriate rather than continuing automatically for an arbitrary period.
Monitoring should occur at a frequency appropriate to the patient’s clinical condition and the type of IV therapy being administered.
Monitoring Vital Signs
Vital signs provide important information about the patient’s response to IV fluids for dehydration.
The nurse monitors trends in:
Blood pressure
Heart rate
Respiratory rate
Oxygen saturation
Temperature
An improving blood pressure and decreasing tachycardia may indicate improvement in circulating volume when interpreted alongside other clinical findings. However, vital signs should never be considered in isolation.
For example, a patient’s blood pressure may improve while the patient simultaneously develops respiratory distress from excessive fluid administration. This illustrates why the entire clinical picture must be assessed.
WHO guidance for severe dehydration recommends frequent reassessment during IV treatment; in some severe dehydration protocols, patients are reassessed every 15–30 minutes during the initial phase.
The exact monitoring interval depends on the patient’s condition and applicable clinical protocol.
Monitoring the IV Site
The IV site should be inspected regularly for:
Redness
Swelling
Pain
Tenderness
Warmth
Leakage
Bleeding
Infiltration
Phlebitis
Signs of infection
An IV site that becomes painful or swollen may indicate infiltration or another complication. Continuing the infusion without assessment can worsen tissue injury and compromise treatment.
The nurse should also check whether the infusion is flowing as intended. A slow or stopped infusion may result from a positional problem, occlusion, kinked tubing, catheter displacement, or other issue.
Monitoring Fluid Balance
Fluid balance monitoring helps determine whether the patient is receiving enough fluid without accumulating excessive amounts.
The nurse records relevant fluid intake, including:
IV fluids
Oral fluids
Enteral fluids
Fluids administered with medications, when applicable
Output may include:
Urine
Vomitus
Diarrheal stool
Drainage
Other measurable losses
Accurate intake and output documentation is particularly important when ongoing gastrointestinal or renal losses are substantial.
For example, a patient with severe diarrhea may receive an IV drip that replaces part of the fluid deficit. If large-volume diarrhea continues, the patient may still have a negative fluid balance despite receiving IV therapy. Continued assessment allows the treatment plan to account for those ongoing losses.
Monitoring Urine Output
Urine output is an important indicator of renal perfusion and overall fluid status, although it must be interpreted in context.
Reduced urine output can occur with dehydration and reduced renal perfusion, but it can also occur because of kidney disease, urinary obstruction, medications, or other conditions.
Improvement in urine output after appropriate fluid replacement may support the conclusion that renal perfusion is improving. Persistent oliguria despite rehydration requires further assessment because it may indicate acute kidney injury or another problem.
WHO guidance for severe dehydration emphasizes monitoring urine output and recognizing persistent low output as a potential indicator of kidney injury.
Monitoring for Fluid Overload
One of the most important risks of IV hydration therapy is giving more fluid than the patient can safely accommodate.
Signs that may suggest fluid overload include:
New or worsening peripheral edema
Increasing respiratory rate
Shortness of breath
New or worsening crackles
Reduced oxygen saturation
Rapid weight gain
Increasing jugular venous pressure
Worsening pulmonary congestion
Patients with heart failure, kidney impairment, liver disease, or other conditions affecting fluid regulation require particularly careful observation.
WHO guidance specifically warns that excessive IV fluid administration can cause pulmonary edema in severe dehydration treatment.
For example, an older adult with dehydration and chronic cardiac disease may initially benefit from IV fluid replacement but develop shortness of breath as fluid accumulates. The nurse should recognize the change promptly and communicate it to the treating team.
Monitoring Laboratory Results
Laboratory monitoring may be required depending on the severity and cause of dehydration and the patient’s underlying conditions.
Potentially relevant tests include:
Serum sodium
Potassium
Chloride
Bicarbonate
Blood glucose
Urea
Creatinine
Other tests based on the clinical situation
Laboratory values should be interpreted as trends rather than isolated numbers. A patient may have an abnormal electrolyte level before treatment and require repeat testing to determine whether the IV fluids and other interventions are producing the desired correction.
NICE emphasizes assessment of laboratory indices alongside clinical findings and previous trends when monitoring IV fluid therapy.
Evaluating Response to Fluid Therapy
Evaluation determines whether the IV fluid therapy is accomplishing its intended purpose. The nurse compares the patient’s current condition with the baseline assessment and looks for evidence of improving circulation, hydration, organ perfusion, electrolyte status, and overall clinical stability.
A favorable response may include:
Improved blood pressure when hypotension was related to volume depletion
Reduced tachycardia when volume loss was contributing to the elevated heart rate
Improved peripheral perfusion
Improved capillary refill
Increased urine output when reduced output was caused by volume depletion
Improved alertness or mental status
Reduced thirst and dry mouth
Improved general strength
Stabilization of relevant laboratory values
Ability to tolerate oral fluids when appropriate
These findings should be considered together rather than interpreted individually.
For example, increasing urine output can be encouraging, but it does not by itself prove that the patient is fully rehydrated. Similarly, a normal blood pressure does not necessarily mean that the patient’s total fluid deficit has been corrected.
Assessing Whether Fluid Replacement Is Adequate
The nurse should ask whether the patient is moving toward the intended clinical goals.
Is the blood pressure more stable? Is the heart rate improving? Are peripheral pulses and perfusion better?
Has renal perfusion improved?
Is urine output increasing appropriately?
Has the patient’s mental status improved?
Is the patient more alert and responsive?
Are ongoing losses being controlled?
Has vomiting decreased? Has diarrhea become less frequent? Are other sources of fluid loss being addressed?
Are there signs of excessive fluid administration?
Has the patient developed edema, respiratory distress, pulmonary crackles, or other evidence of fluid overload?
Are electrolyte abnormalities improving appropriately?
Do laboratory trends indicate that the patient’s sodium, potassium, and other relevant values are moving in the desired direction?
This structured evaluation helps distinguish effective fluid therapy from simply administering a predetermined volume.
Recognizing an Inadequate Response
Not every patient responds as expected to IV rehydration. Failure to improve should prompt reassessment rather than automatic administration of more fluid.
An inadequate response may occur because:
The amount of fluid administered is insufficient.
Fluid losses are continuing at a high rate.
The wrong type of fluid was selected for the patient’s physiological problem.
The patient has significant electrolyte abnormalities.
The patient has ongoing bleeding or another source of volume loss.
Kidney function is impaired.
Heart function is impaired.
Sepsis or another serious illness is present.
The original diagnosis was incomplete or incorrect.
WHO guidance recommends frequent reassessment during treatment of severe dehydration and advises further evaluation when hydration does not improve as expected.
For example, suppose a patient with presumed dehydration receives appropriate IV fluids, but blood pressure remains low, mental status worsens, and peripheral perfusion remains poor. Simply continuing the same infusion without reassessing the patient could delay recognition of septic shock, hemorrhage, cardiac dysfunction, or another serious condition.
The nurse should therefore recognize unexpected findings and promptly communicate them to the healthcare team.
Recognizing an Excessive Response
Evaluation also involves identifying when the patient has received too much fluid.
A patient who initially appeared dehydrated may become fluid overloaded if replacement exceeds the patient’s ability to redistribute or excrete the administered fluid.
Warning signs can include new pulmonary crackles, increasing oxygen requirements, respiratory distress, peripheral edema, rapid weight gain, or other evidence of excessive fluid accumulation.
This is particularly important in patients with impaired kidney or cardiac function.
The goal of IV hydration therapy is not to produce the greatest possible increase in fluid volume. The goal is to restore an appropriate physiological state without creating a new fluid or electrolyte problem.
Documenting the Response
Accurate documentation is an essential part of nursing care during IV fluid administration.
Documentation should reflect the patient’s assessment before treatment, the prescribed fluid and administration details, the condition of the IV site, relevant monitoring findings, intake and output, patient response, and any complications or changes communicated to the healthcare team.
For example, documentation might include that an isotonic crystalloid was administered as prescribed, the IV site remained free of swelling or redness, vital signs were monitored, urine output improved, and the patient became more alert and able to tolerate oral fluids.
Documentation should describe objective findings rather than vague statements such as “patient doing better.”
A strong nursing record allows another healthcare professional to understand:
Why the patient received IV therapy
What fluid was administered
How the therapy was administered
How the patient responded
What ongoing losses occurred
What complications were observed or ruled out
What changes were communicated
Whether the patient was ready for transition away from IV therapy
NICE recommends that adults receiving IV fluids have a clear fluid-management plan that specifies fluid and electrolyte therapy and arrangements for assessment and monitoring.
Transitioning From IV to Oral Hydration
Evaluation also determines when the patient may no longer need getting IV fluids. If the patient’s circulation and hydration have improved and the patient can drink safely and absorb fluids adequately, treatment can often transition toward oral hydration.
WHO guidance for severe dehydration recommends switching to ORS when hydration has improved and the patient can drink.
This transition reduces unnecessary exposure to IV-related complications and allows the gastrointestinal tract to resume its normal role in hydration.
For example, a patient who initially arrived with severe vomiting and dehydration may require IV therapy because oral fluids could not be tolerated. Several hours later, vomiting may have stopped, vital signs may have stabilized, urine output may have improved, and the patient may be able to drink small amounts without vomiting. At this point, the clinical team can reassess the need for continued IV fluids for dehydration and determine whether oral hydration can replace IV therapy.
The transition should be based on the patient’s clinical condition rather than simply completing an entire IV bag.
The nursing role in IV fluid administration and nursing care therefore extends from the first assessment through the final evaluation of treatment response. Safe practice requires careful preparation, accurate administration, frequent monitoring, recognition of complications, documentation, and timely communication when the patient’s condition changes.
The central nursing principle is simple: administer the prescribed fluid, observe how the patient responds, and continuously reassess whether the current fluid plan remains appropriate. This approach helps ensure that IV therapy for dehydration corrects fluid deficits while minimizing complications such as fluid overload, electrolyte disturbances, and IV-site problems.
Benefits, Risks, and Complications of IV Therapy
IV fluids for dehydration can be highly effective when a patient cannot adequately replace fluid losses through the gastrointestinal tract or when rapid restoration of circulating volume is clinically necessary. However, IV therapy is an invasive treatment and should not be considered risk-free simply because the administered fluid is intended to correct dehydration.
The same intervention that restores circulation and improves hydration can cause harm if the wrong IV fluid is selected, too much fluid is administered, the infusion is given too quickly, electrolyte abnormalities are corrected too rapidly, or the IV catheter becomes infected or displaced. NICE emphasizes that patients receiving IV fluids require assessment of the appropriate fluid content, volume, and rate because both under-treatment and over-treatment can result in clinically significant complications.
Safe IV hydration therapy therefore depends on finding an appropriate balance. The objective is to replace what the patient needs without creating fluid overload, worsening an electrolyte abnormality, damaging the IV site, or introducing infection.
Benefits of IV Hydration
One of the principal benefits of IV hydration is that it provides direct access to the vascular system. When a patient cannot drink adequately, cannot retain oral fluids because of persistent vomiting, or has severe volume depletion, an IV solution can provide water and electrolytes without depending on the patient’s ability to swallow or absorb sufficient fluid through the gastrointestinal tract.
This makes IV fluids for dehydration particularly useful when timely fluid replacement is needed.
Rapid Availability of Fluid
Oral hydration must pass through the gastrointestinal tract before the absorbed water and electrolytes become available to the circulation. With an IV fluid, the solution enters the vascular system directly and can therefore begin influencing circulating volume immediately.
This is particularly important when dehydration is accompanied by significant circulatory compromise.
For example, a patient with severe gastroenteritis may have repeated vomiting and diarrhea and be unable to drink enough to compensate for losses. If the patient develops marked volume depletion, an appropriate isotonic crystalloid can be administered intravenously while the underlying gastrointestinal illness is evaluated and treated.
IV fluid resuscitation is commonly used for severe dehydration and other conditions involving clinically important volume depletion.
Restoration of Circulating Volume
A second major benefit is the ability to restore intravascular fluid volume.
When substantial extracellular fluid has been lost, circulating volume may fall. Reduced circulating volume can impair venous return and tissue perfusion. Isotonic crystalloid solutions such as normal saline or Lactated Ringer’s are commonly used when the treatment objective is extracellular and intravascular volume replacement.
However, not every milliliter infused remains in the bloodstream. Crystalloids distribute between fluid compartments after administration. Merck notes that after redistribution, only a portion of an isotonic crystalloid infusion remains intravascular.
This explains why clinicians must assess the patient’s response rather than assuming that the volume infused is equivalent to the volume retained in the circulation.
Replacement of Water and Electrolytes
Another benefit of appropriate IV hydration is that certain solutions can replace both water and electrolytes.
For example, Lactated Ringer’s contains sodium, chloride, potassium, calcium, and lactate. Normal saline provides sodium and chloride. Other IV solutions have different electrolyte and glucose compositions.
This allows fluid therapy to be tailored to the patient’s physiological requirements.
For instance, a patient with substantial gastrointestinal fluid loss may require an isotonic crystalloid to restore extracellular volume while the healthcare team evaluates sodium, potassium, chloride, bicarbonate, renal function, and other relevant laboratory values.
The goal is not simply to replace “water.” It is to restore an appropriate fluid and electrolyte balance.
Useful When Oral Hydration Is Not Adequate
Getting IV fluids can be particularly beneficial when the gastrointestinal route cannot provide adequate replacement.
Examples include:
Persistent vomiting
Altered consciousness that prevents safe drinking
Severe dehydration
Significant gastrointestinal losses
Inability to swallow safely
Certain situations involving impaired gastrointestinal absorption
In these circumstances, IV therapy temporarily provides another route for fluid replacement.
Once the patient is stable and can drink adequately, however, IV therapy may no longer be necessary. Avoiding unnecessary IV therapy reduces exposure to catheter-related and fluid-related complications.
Controlled Administration
Another benefit of IV fluids for dehydration is that the volume and rate can be controlled. An infusion pump can deliver a prescribed amount over a specified period, allowing clinicians to adjust therapy according to the patient’s response.
This can be particularly useful in patients whose fluid requirements change rapidly.
For example, a patient may initially need more intensive fluid replacement because of severe volume depletion. After reassessment shows improved circulation, the infusion rate may be reduced, changed, or discontinued as oral hydration becomes possible.
This illustrates why IV therapy for dehydration is an active treatment requiring reassessment rather than a passive intervention in which a bag of fluid is simply allowed to run until empty.
Potential Improvement in Organ Perfusion
When dehydration has caused clinically significant reduction in circulating volume, appropriate fluid replacement can improve perfusion of organs such as the kidneys and brain.
Improved perfusion may be reflected by findings such as improved mental status, stronger peripheral perfusion, stabilization of blood pressure, and improved urine output. Merck identifies vital signs, urine output, mental status, and other clinical findings as useful indicators when evaluating the response to fluid resuscitation.
The benefit depends on the cause of the patient’s deterioration. If hypotension or poor perfusion is caused by something other than fluid loss, simply giving more fluid may not correct the problem.
Fluid Overload and Electrolyte Problems
Although IV fluids for dehydration are intended to correct a deficit, excessive or inappropriate administration can produce serious complications. The two major concerns are fluid overload and disturbances in electrolyte concentration.
NICE specifically identifies over-provision of fluid and electrolyte abnormalities such as hyponatremia, hypernatremia, hypokalemia, hyperkalemia, and hyperchloremic acidosis as important complications of IV fluid therapy.
Fluid Overload
Fluid overload occurs when the amount of fluid administered or retained exceeds the body’s ability to accommodate or eliminate it.
This may happen when:
Too much IV fluid is administered.
Fluid is given too rapidly.
The patient’s kidney function is impaired.
Cardiac function is impaired.
Ongoing fluid losses have been overestimated.
The patient’s condition changes during treatment.
Maintenance fluid is continued after the original indication has resolved.
Fluid overload can cause peripheral edema and, more seriously, pulmonary congestion or pulmonary edema.
A patient receiving IV hydration therapy may therefore begin treatment with dry mucous membranes, poor perfusion, and reduced urine output but later develop increasing shortness of breath, crackles, edema, or falling oxygen saturation if excessive fluid accumulates.
Merck identifies pulmonary edema and acute respiratory distress among potential complications of excessively rapid IV fluid administration.
The nurse should therefore monitor respiratory status carefully, particularly in patients at increased risk.
Recognizing Fluid Overload
Potential signs include:
New or worsening peripheral edema
Rapid weight gain
Increasing respiratory rate
Shortness of breath
New pulmonary crackles
Reduced oxygen saturation
Increasing oxygen requirements
Raised jugular venous pressure
Increasing blood pressure in some patients
Evidence of pulmonary congestion
The presence of one finding does not automatically establish fluid overload. For example, peripheral edema can have causes unrelated to IV therapy. The nurse should evaluate the complete clinical picture and communicate concerning changes promptly.
Example: Fluid Overload in a High-Risk Patient
Consider an older patient with dehydration who also has chronic heart failure. The patient may genuinely require IV fluids for dehydration, but the heart may have limited capacity to accommodate a rapid increase in circulating volume.
If the patient receives excessive fluid, the initial signs of dehydration may improve while pulmonary congestion develops.
This is why “the patient is dehydrated” does not mean that unlimited IV fluid is safe. The clinician must continuously balance the need for fluid replacement against the risk of excessive volume.
Electrolyte Disturbances
An IV solution contains specific concentrations of water, sodium, chloride, potassium, glucose, or other substances. Administering a solution changes the patient’s fluid and electrolyte environment.
If the wrong solution is used or excessive quantities are administered, electrolyte disturbances can develop or worsen.
Potential problems include:
Hyponatremia
Hypernatremia
Hypokalemia
Hyperkalemia
Hyperchloremia
Hyperchloremic metabolic acidosis
Changes in serum glucose
NICE specifically highlights these electrolyte abnormalities as reasons why patients receiving IV fluids require appropriate assessment and laboratory monitoring.
For example, giving large amounts of chloride-rich normal saline can contribute to hyperchloremia and hyperchloremic metabolic acidosis. This does not mean that normal saline is an inappropriate IV for dehydration; rather, it demonstrates why fluid selection and the total volume administered should be considered in context.
Sodium Problems
Sodium is particularly important because it influences extracellular osmolality and water distribution.
A patient with dehydration may have:
Water and sodium loss together
Disproportionately greater water loss
Disproportionately greater sodium loss
A pre-existing sodium abnormality
These situations require different approaches.
For example, a patient with hypernatremic dehydration has lost proportionally more water than sodium. Rapidly correcting the sodium concentration can be dangerous, so fluid replacement must be carefully controlled.
Similarly, administering excessive free water to a patient at risk of hyponatremia can cause the serum sodium concentration to fall.
Therefore, the best IV fluid depends not only on the presence of dehydration but also on the patient’s electrolyte status.
Potassium Problems
Potassium abnormalities are particularly important because potassium plays a major role in cardiac and neuromuscular function.
Vomiting, diarrhea, kidney disease, medications, and other conditions can alter potassium balance. Some IV fluids used for dehydration contain potassium, while others do not.
A nurse should never assume that an isotonic crystalloid will correct a patient’s potassium deficit simply because it contains a small amount of potassium. Significant hypokalemia may require a separately prescribed potassium replacement strategy and appropriate monitoring.
Conversely, patients with impaired renal function may be at increased risk of potassium accumulation.
Hyperchloremic Acidosis
Large-volume administration of chloride-rich fluids such as normal saline can increase serum chloride concentration and contribute to hyperchloremic metabolic acidosis.
This is one reason balanced crystalloids may be preferred in some situations requiring substantial crystalloid administration. The appropriate choice still depends on the clinical circumstances, and normal saline remains an important IV fluid for dehydration in many settings.
The key nursing principle is to understand that fluid therapy can alter laboratory values and acid-base status, making ongoing reassessment necessary.
IV Site Complications and Infection
Because IV therapy requires vascular access, complications can occur at the catheter site or along the vein. These complications can interfere with treatment and, in some circumstances, cause significant tissue injury or infection.
Common local complications include:
Infiltration
Extravasation
Phlebitis
Hematoma
Bleeding
Local infection
Catheter occlusion
Dislodgement
The nurse should inspect and assess the IV site regularly according to institutional policy and the patient’s clinical condition.
Infiltration
Infiltration occurs when a non-vesicant IV solution leaks from the vein into surrounding tissue.
Possible findings include:
Swelling
Coolness
Pallor
Tightness
Slowed or stopped infusion
Discomfort at the site
For example, a patient receiving an IV drip may report that the area around the catheter feels tight. The nurse notices that the surrounding tissue is swollen and the infusion is no longer flowing normally. These findings should prompt immediate assessment for infiltration.
The infusion should not simply be allowed to continue through a suspected malfunctioning catheter.
Extravasation
Extravasation is the leakage of a vesicant or tissue-damaging solution into surrounding tissue. The consequences can be much more serious than ordinary infiltration.
Although many routine IV fluids for dehydration are not vesicants, nurses must still understand the distinction because patients may receive medications or other solutions through the same IV access.
Extravasation can cause pain, inflammation, tissue damage, and in severe cases tissue necrosis.
Management depends on the substance involved and institutional protocol. The infusion should be stopped and the appropriate clinical response initiated rather than continuing to infuse through the affected site.
Phlebitis
Phlebitis refers to inflammation of a vein and may be associated with:
Pain or tenderness
Redness
Warmth
Swelling
A palpable venous cord
The CDC recommends removing peripheral venous catheters when signs of phlebitis, infection, or catheter malfunction develop.
For example, a patient receiving IV hydration may initially have a comfortable IV site, but several hours later develop redness and tenderness along the vein. This finding requires assessment and appropriate intervention rather than being dismissed as minor discomfort.
Hematoma and Bleeding
A hematoma can develop when blood leaks into surrounding tissue during or after IV insertion. Patients receiving anticoagulant therapy or those with bleeding disorders may be at increased risk.
The nurse should observe the insertion site for bleeding, swelling, bruising, or pain and apply appropriate measures according to institutional policy.
Catheter Dislodgement and Occlusion
A catheter may become displaced or blocked, preventing the prescribed IV fluid from entering the circulation appropriately.
An infusion pump may alarm because of occlusion, but an alarm should prompt assessment rather than repeated attempts to force fluid through the line.
The nurse should inspect:
The catheter site
Tubing
Connections
Clamps
Patient positioning
Infusion pump settings
A malfunctioning catheter should be addressed according to institutional policy.
IV-Related Infection
Any device that enters the vascular system creates an opportunity for microorganisms to enter the body. Infection can occur locally at the catheter site or, more seriously, spread into the bloodstream.
Potential signs of local infection include:
Redness
Warmth
Swelling
Pain or tenderness
Purulent drainage
Systemic infection may present with findings such as fever, chills, hypotension, or other evidence of systemic illness.
The CDC recommends that healthcare personnel who insert and maintain intravascular catheters receive appropriate education and demonstrate competence in catheter insertion and maintenance. It also recommends regular assessment of peripheral catheter sites and removal when phlebitis, infection, or malfunction occurs.
Aseptic technique is therefore essential throughout IV treatment, including catheter insertion, connection and disconnection procedures, dressing care, and handling of the IV system.
The nurse should also minimize unnecessary manipulation of the catheter and infusion system.
Why IV-Site Monitoring Matters
An IV site may appear normal initially and develop complications later. Regular assessment allows problems to be recognized before they become more severe.
For example, early detection of infiltration may prevent extensive swelling and tissue injury. Early recognition of phlebitis may prevent progression of inflammation. Recognition of infection may allow prompt treatment before systemic complications develop.
The CDC recommends daily assessment of peripheral catheter sites, including palpation through an appropriate dressing for tenderness and visual inspection when indicated.
Safety Considerations for High-Risk Patients
Not every patient responds to IV fluids for dehydration in the same way. Certain patients have a narrower margin of safety because their ability to regulate fluid volume, electrolytes, or circulation is impaired.
High-risk groups include patients with:
Heart failure
Kidney impairment
Liver disease
Advanced age
Very young age
Severe electrolyte abnormalities
Severe malnutrition
Pregnancy
Significant cardiac or respiratory disease
Complex gastrointestinal losses
Conditions associated with abnormal fluid distribution
These patients may still require IV hydration, but the treatment generally requires more individualized assessment and closer monitoring.
Patients With Heart Failure
Patients with heart failure may have difficulty tolerating rapid increases in circulating volume.
A patient may be suffering from dehydration while simultaneously being at risk for pulmonary edema. Therefore, the presence of dehydration does not eliminate the risk associated with excessive IV fluid administration.
The nurse should monitor:
Respiratory status
Oxygen saturation
Lung sounds
Edema
Blood pressure
Heart rate
Urine output
Weight
Overall fluid balance
For example, an older adult with vomiting and known heart failure may require carefully controlled fluid replacement rather than an aggressive infusion without reassessment.
Merck notes that rapid or high-volume fluid administration can be hazardous in patients who cannot tolerate increased intravascular volume.
Patients With Kidney Impairment
The kidneys are central to maintaining fluid and electrolyte balance. Reduced kidney function can impair the body’s ability to excrete excess water, sodium, potassium, and other substances.
A patient with kidney impairment may therefore develop fluid overload more easily.
Monitoring may include:
Urine output
Serum creatinine
Urea
Sodium
Potassium
Fluid balance
Body weight
Signs of edema or pulmonary congestion
For example, a patient with acute kidney injury may initially have dehydration caused by vomiting. Once IV fluids are administered, urine output may remain low because the kidneys are injured. Continuing to give large volumes without reassessment could result in fluid accumulation.
NICE specifically identifies renal impairment as a factor that can complicate fluid and electrolyte management and may require individualized treatment and monitoring.
Older Adults
Older adults may be particularly vulnerable to both dehydration and complications from IV therapy.
Age-related changes can affect thirst perception, renal concentrating ability, cardiovascular reserve, and overall physiological response to fluid changes.
An older adult may therefore become dehydrated without reporting intense thirst and may also have less capacity to tolerate rapid fluid administration.
For example, an older patient with diarrhea and reduced oral intake may require IV hydration, but the nurse should monitor carefully for both persistent dehydration and signs of fluid overload.
The treatment should be guided by the patient’s current clinical condition rather than age alone.
Children
Children, particularly infants and young children, can experience significant fluid changes over a relatively short period because of their smaller body size.
Their fluid requirements are generally weight-based, and errors in fluid volume or electrolyte administration can therefore have significant consequences.
Children receiving IV fluids for dehydration require careful weight-based assessment, accurate calculation, appropriate equipment, and frequent reassessment. CDC guidance emphasizes immediate IV rehydration for children with severe dehydration and close monitoring of the clinical response.
A nurse should never extrapolate an adult IV-fluid regimen to a child without an appropriate pediatric prescription or protocol.
Patients With Electrolyte Abnormalities
Patients with significant sodium or potassium abnormalities require particular caution.
For example, a patient with severe hypernatremia may require controlled correction of the water deficit rather than rapid administration of large volumes of hypotonic fluid.
Similarly, a patient with significant hypokalemia may require specifically prescribed potassium replacement and cardiac monitoring depending on severity and treatment route.
In such cases, IV hydration is only one part of the overall treatment plan.
Patients With Severe or Ongoing Gastrointestinal Losses
Patients with persistent vomiting, diarrhea, gastrointestinal drainage, or high-output stomas may continue to lose large quantities of water and electrolytes even after IV treatment begins.
NICE specifically identifies vomiting, diarrhea, gastrointestinal drainage, urinary losses, sweating, and fever among abnormal losses that may need to be incorporated into fluid and electrolyte replacement plans.
For example, a patient with continuous high-volume diarrhea may receive an appropriate IV drip and initially improve. If the diarrhea continues, however, the patient may develop another fluid deficit. The nurse therefore needs to document ongoing losses accurately and communicate significant changes.
Patients With Severe Malnutrition
Patients with severe malnutrition require particularly cautious fluid management because their physiological reserves and electrolyte status may be abnormal.
Fluid administration should therefore be guided by an appropriate clinical protocol rather than treating dehydration solely according to the volume that appears to have been lost.
Pregnancy
During pregnancy, maternal fluid management must account for the physiological changes associated with pregnancy as well as the health of the fetus.
A pregnant patient with vomiting and dehydration may require IV fluids for dehydration, but assessment should also consider blood pressure, symptoms, urine output, electrolyte abnormalities, severity of vomiting, and the underlying cause.
The appropriate solution, amount, and rate should be determined by the treating clinician according to the patient’s condition and applicable obstetric protocols.
A General Safety Principle for High-Risk Patients
For high-risk patients, the safest approach is to combine careful assessment with conservative, individualized fluid management and frequent reassessment.
The nurse should continuously consider:
What fluid has been given?
How much has been given?
At what rate?
What has the patient lost?
What is the patient’s current fluid status?
How are the kidneys and heart responding?
Are electrolyte values changing appropriately?
Are there signs that the patient needs more fluid—or signs that further fluid could be harmful?
These questions help prevent a common misconception about IV therapy for dehydration: more fluid is not necessarily better fluid therapy.
The appropriate amount is the amount required to achieve the clinical objective without causing fluid overload or worsening electrolyte abnormalities.
For this reason, NICE recommends regular reassessment of clinical fluid status, laboratory values, fluid balance, and other relevant indicators in patients continuing to receive IV fluids. Patients with replacement or redistribution problems may require monitoring more frequently than routine maintenance patients.
The benefits of IV hydration can be substantial when it is appropriately indicated. It can restore circulating volume, replace water and electrolytes, and support tissue perfusion when oral replacement is inadequate. At the same time, IV therapy carries important risks, including fluid overload, electrolyte disturbances, infiltration, phlebitis, extravasation, catheter malfunction, and infection.
Safe IV fluids for dehydration therefore require individualized fluid selection, appropriate administration, vigilant nursing assessment, and repeated reassessment. The nurse’s role is not simply to administer the prescribed IV fluid, but to recognize whether the patient’s response indicates that treatment is achieving its intended purpose safely.
Special Considerations for Dehydration Treatment
The management of dehydration cannot be approached as a one-size-fits-all process. Although IV fluids for dehydration can restore circulating volume and replace water and electrolytes when clinically indicated, the appropriate fluid, amount, rate, and monitoring requirements vary considerably between patients.
Age, pregnancy, cardiac function, kidney function, the cause of fluid loss, and the presence of ongoing losses can all change how a patient responds to IV therapy for dehydration. A fluid regimen that is appropriate for one patient may be excessive, insufficient, or inappropriate for another.
For example, a young adult with acute gastroenteritis and no significant medical history may tolerate an appropriate isotonic IV fluid relatively well. An older adult with heart failure and chronic kidney disease may also be dehydrated, but aggressive fluid administration could precipitate pulmonary edema. Similarly, an infant can develop significant fluid and electrolyte disturbances with relatively small absolute losses because of the child’s smaller body size.
The central principle is therefore to match IV hydration therapy to the patient’s individual physiological needs. Clinical assessment should continue throughout treatment because the patient’s fluid requirements can change as dehydration improves, ongoing losses continue, or an underlying illness becomes apparent.
Older Adults and Children
Age has an important influence on both the risk of dehydration and the safety of IV fluids for dehydration. Older adults and children can both become dehydrated relatively quickly, but the reasons and clinical considerations differ.
Older Adults
Older adults are particularly vulnerable to dehydration because several physiological and practical factors can reduce their ability to maintain adequate fluid intake.
Thirst perception may become less reliable with age, meaning that an older person may not experience or respond to thirst as strongly as a younger adult. Age-related changes in kidney function can also reduce the ability to concentrate urine and conserve water effectively. In addition, mobility limitations, cognitive impairment, swallowing difficulties, dependence on caregivers, and medications such as diuretics can interfere with adequate hydration.
Illness can increase the problem. Fever, vomiting, diarrhea, excessive sweating, or poor oral intake may cause an older adult to lose fluid faster than it can be replaced.
For example, an older adult living with limited mobility may have diarrhea but avoid drinking because reaching the bathroom is difficult. The patient may therefore develop progressive dehydration without reporting significant thirst.
At the same time, older adults can be more vulnerable to complications from IV fluid therapy. Reduced cardiac or renal reserve may make it more difficult to accommodate a rapid increase in circulating volume. NICE highlights older adults among groups in whom certain IV-fluid-related electrolyte complications can be particularly important.
Consequently, the nurse should monitor an older adult receiving IV hydration closely for both inadequate replacement and excessive fluid administration.
Important considerations include:
Baseline weight and recent weight changes
Blood pressure and heart rate
Mental status
Urine output
Oral intake
Intake and output balance
Renal function
Electrolyte results
Presence of edema
Respiratory status
Cardiac history
Current medications
A common mistake is to assume that because an older patient is dehydrated, a large volume of IV fluids for dehydration is automatically appropriate. In reality, the patient’s cardiovascular and renal capacity must be considered.
Example: An 80-year-old patient presents after several days of vomiting and diarrhea. The patient has dry mucous membranes and reduced urine output but also has chronic heart failure. The patient may genuinely need IV fluids, but the fluid administration requires careful assessment and frequent reassessment for pulmonary congestion. Improvement in blood pressure and urine output should be weighed against the development of dyspnea, crackles, edema, or falling oxygen saturation.
Another consideration is medication use. Diuretics, laxatives, certain antihypertensive medications, and other drugs can influence fluid balance. Medication review can therefore help identify factors that contributed to dehydration or may alter the patient’s response to treatment.
Children
Children require a different approach because their fluid requirements are closely related to body weight and because relatively small absolute fluid losses can represent a substantial percentage of total body fluid.
Infants are particularly vulnerable. CDC guidance notes that infants with acute diarrhea are more likely to become dehydrated than older children because of their higher metabolic rate, greater insensible losses relative to body weight, and dependence on caregivers for fluid intake.
Children may also be unable to communicate thirst or symptoms effectively. A young child may instead present with irritability, lethargy, fewer wet diapers, reduced tears, dry mucous membranes, or changes in behavior.
For children with acute gastroenteritis, oral rehydration is generally preferred when the child has mild or moderate dehydration and can tolerate oral therapy. CDC guidance recommends oral rehydration therapy for most children with mild to moderate dehydration, while severe dehydration is treated as a medical emergency requiring immediate IV rehydration.
This distinction is important because an IV for dehydration is not automatically the first treatment for every dehydrated child.
When IV therapy is required for severe dehydration, isotonic solutions such as Lactated Ringer’s or normal saline are used according to appropriate pediatric protocols. CDC guidance describes weight-based IV rehydration with these solutions and recommends close monitoring of pulse, perfusion, and mental status.
The weight-based nature of pediatric fluid administration means that accurate weight measurement is particularly important. A dosing or fluid-volume error that appears small in absolute terms may represent a substantial difference when calculated per kilogram.
Example: A child weighing 10 kg and an adult weighing 70 kg obviously cannot receive the same volume of IV fluids for dehydration simply because they have similar symptoms. Pediatric fluid therapy must be calculated according to the child’s weight, clinical severity, ongoing losses, and applicable protocol.
The nurse should also monitor children carefully for changes in:
Level of consciousness
Heart rate
Blood pressure
Capillary refill and peripheral perfusion
Respiratory status
Urine output
Body weight
Oral intake
Frequency of vomiting and diarrhea
Serum electrolytes when clinically indicated
In children with gastroenteritis, continued feeding and age-appropriate nutrition are also important after or during rehydration as tolerated. CDC guidance recommends continuing breastfeeding and returning to an age-appropriate diet rather than unnecessarily withholding nutrition.
Pregnancy
Pregnancy introduces additional considerations when treating dehydration because fluid management affects both the pregnant patient and the developing fetus.
A pregnant patient may become dehydrated from common causes such as vomiting, diarrhea, fever, reduced oral intake, or excessive fluid loss. Severe pregnancy-related vomiting, including hyperemesis gravidarum, can also result in substantial dehydration and electrolyte abnormalities.
Pregnancy itself changes cardiovascular and renal physiology, so assessment must consider the patient’s baseline physiological state rather than applying nonpregnant adult assumptions without modification.
For example, a pregnant patient with persistent vomiting may initially be unable to maintain adequate fluid intake. If oral hydration is insufficient and dehydration becomes clinically significant, IV hydration may be required while the underlying cause is evaluated and treated.
The severity of vomiting matters. A patient who has occasional morning nausea but can drink adequately does not necessarily require IV fluids for dehydration. In contrast, a patient with persistent vomiting, inability to tolerate oral fluids, reduced urine output, significant weakness, abnormal vital signs, or laboratory evidence of electrolyte disturbance may require medical evaluation and possibly IV treatment.
Some clinical protocols for hyperemesis gravidarum specifically emphasize assessment of vomiting frequency, dehydration, weight, vital signs, and fluid intake and output.
The nurse should therefore assess:
Frequency and severity of vomiting
Ability to tolerate oral fluids
Urine output
Weight changes
Blood pressure
Heart rate
Electrolyte results when indicated
Renal function
Nutritional intake
Signs of significant dehydration
Associated abdominal, obstetric, or systemic symptoms
Example: A pregnant patient in the first trimester has persistent vomiting and is unable to retain fluids. The patient reports dizziness and weakness and has reduced urine output. The nurse should recognize that this is more than ordinary nausea and warrants assessment for dehydration and electrolyte abnormalities. If IV therapy is prescribed, the patient’s response should be monitored carefully while treatment of the vomiting continues.
An important principle is that IV fluids treat the fluid deficit, not the underlying cause of pregnancy-related vomiting. If vomiting continues, the patient may continue to lose water and electrolytes despite receiving an IV drip. Antiemetic treatment, nutritional support, and management of the underlying condition may therefore be necessary alongside fluid replacement.
Pregnancy also makes careful medication and fluid selection important. The prescribed IV solution, additives, medications, and rate should be appropriate for pregnancy and the patient’s individual clinical condition.
A patient with mild dehydration who can tolerate oral fluids may not require an IV. Conversely, significant dehydration with persistent vomiting may require intravenous treatment because oral replacement is not effective.
This illustrates a broader principle: pregnancy does not automatically mean that IV fluids are required, but it does require careful assessment when dehydration is present.
Heart and Kidney Conditions
Heart and kidney conditions are particularly important when selecting and administering IV fluids for dehydration because both organs play major roles in maintaining fluid balance.
The cardiovascular system distributes circulating volume, while the kidneys regulate water, sodium, potassium, and other electrolytes. Impairment of either system can change how the patient responds to fluid replacement.
Heart Conditions
Patients with heart failure or other significant cardiac disease may have limited ability to accommodate an increase in intravascular volume.
A dehydrated patient with heart failure presents a clinical challenge because the patient needs enough fluid to restore adequate circulation but may not tolerate rapid or excessive fluid administration.
For example, consider a patient with chronic heart failure who develops severe diarrhea. The diarrhea causes substantial fluid loss, and the patient becomes weak and hypotensive. However, administering large quantities of IV fluid without frequent reassessment may increase venous and pulmonary pressures and precipitate pulmonary congestion.
The nurse should therefore monitor:
Respiratory rate
Oxygen saturation
Lung sounds
Peripheral edema
Blood pressure
Heart rate
Jugular venous pressure when clinically assessed
Urine output
Body weight
Overall fluid balance
New shortness of breath, crackles, falling oxygen saturation, or rapidly increasing edema may indicate that the patient’s tolerance for additional fluid is being exceeded.
This does not mean that a patient with heart failure should automatically be denied IV hydration when dehydrated. Rather, it means that the risk-benefit balance must be assessed carefully.
Example: A patient with heart failure presents with vomiting, hypotension, and poor peripheral perfusion. The clinical team determines that IV fluid replacement is necessary. The nurse administers the prescribed fluid while monitoring blood pressure and perfusion but also watches closely for pulmonary congestion. If the patient’s circulation improves but respiratory status deteriorates, the response must be communicated promptly because continued fluid administration may no longer be appropriate.
The principle is to correct the clinically important volume deficit without creating a second problem through excessive fluid administration.
Kidney Conditions
The kidneys are central to maintaining fluid and electrolyte balance. When kidney function is impaired, the patient may have difficulty eliminating excess fluid or regulating sodium and potassium.
This makes fluid therapy more complex.
A patient with chronic kidney disease may become dehydrated because of vomiting or diarrhea, yet the same patient may be unable to excrete an excessive amount of administered fluid efficiently.
Similarly, a patient with acute kidney injury may have both dehydration and reduced urine output. Persistent oliguria after fluid administration should not automatically be interpreted as evidence that the patient needs more fluid.
The nurse should consider:
Baseline and current kidney function
Urine output
Serum creatinine
Urea
Sodium
Potassium
Fluid intake and output
Body weight
Edema
Respiratory findings
The cause of the renal impairment
Example: A patient with chronic kidney disease develops diarrhea and reduced oral intake. The patient is dehydrated and requires medical assessment. After receiving prescribed IV fluids, urine output remains low. Rather than assuming that the patient simply needs more IV fluids for dehydration, the healthcare team must reassess renal function, volume status, ongoing losses, and the possibility of acute kidney injury.
Kidney impairment can also influence electrolyte management. Potassium abnormalities are particularly important because both dehydration and renal dysfunction can affect serum potassium.
A patient with significant renal impairment should therefore not receive electrolyte-containing IV fluids indiscriminately. Laboratory results and the patient’s clinical status should guide the treatment plan.
Combined Heart and Kidney Disease
The situation becomes even more complex when heart and kidney disease occur together.
For example, a patient with both chronic heart failure and chronic kidney disease may develop dehydration after prolonged diarrhea. The patient requires fluid replacement, but both organs have limited capacity to handle a sudden increase in circulating volume.
In such circumstances, fluid management may require:
Smaller or carefully controlled fluid administration
Frequent clinical reassessment
Accurate intake and output measurement
Serial laboratory testing
Close respiratory monitoring
Assessment of edema and weight
Careful review of medications
Early recognition of worsening cardiac or renal function
The treatment should be individualized rather than based solely on the diagnosis of dehydration.
Gastrointestinal and Other Causes of Fluid Loss
The cause of dehydration is one of the most important factors in determining how fluid replacement should be managed. Different conditions produce different patterns of water and electrolyte loss, and some causes continue to remove fluid even after IV therapy has started.
Vomiting
Persistent vomiting can cause substantial loss of water, hydrogen ions, chloride, sodium, and potassium. The longer vomiting continues, the greater the potential for dehydration and electrolyte disturbance.
Treatment must therefore address both the existing deficit and the ongoing cause of fluid loss.
For example, a patient with repeated vomiting may receive an IV fluid because oral fluids cannot be retained. However, if vomiting continues, additional losses may require ongoing assessment and replacement.
The treatment plan may therefore involve:
Appropriate IV fluid replacement when indicated
Antiemetic therapy when prescribed
Monitoring electrolytes
Monitoring urine output
Gradual reintroduction of oral fluids
Treatment of the underlying cause
Once vomiting is controlled and oral intake becomes possible, the patient may transition from IV hydration to oral fluids.
Diarrhea
Diarrhea can cause significant losses of water, sodium, chloride, potassium, and bicarbonate. WHO identifies dehydration as the most serious immediate complication of diarrheal disease and notes that diarrhea can result in substantial water and electrolyte losses.
For most patients with non-severe dehydration, oral rehydration solution is preferred because it replaces both water and electrolytes and can be absorbed through the intestine even during diarrhea. WHO notes that oral rehydration can safely and effectively treat most non-severe diarrheal dehydration.
However, severe dehydration or shock may require IV fluids for dehydration. WHO and CDC guidance both identify IV rehydration as appropriate for severe dehydration.
The nurse should continue to monitor stool frequency and volume when possible because ongoing diarrhea can produce a new fluid deficit after the initial deficit has been corrected.
Example: A patient with severe watery diarrhea receives an isotonic IV solution and initially improves. Several hours later, the patient continues to have frequent high-volume stools. Although the initial dehydration has improved, continued losses may place the patient at risk for recurrent dehydration. Intake and output should therefore be reassessed and the treatment plan adjusted when necessary.
Fever and Excessive Sweating
Fever increases insensible water loss, while excessive sweating can result in substantial loss of water and electrolytes.
These causes are common in hot environments, during strenuous activity, and in illnesses associated with prolonged fever.
A patient with heat-related fluid loss may have dehydration from sweating rather than gastrointestinal disease. The treatment strategy therefore depends on the severity of dehydration and the patient’s ability to drink.
For mild dehydration, oral fluids and appropriate electrolyte replacement may be sufficient. More severe cases may require medical assessment and IV hydration.
The underlying cause must also be addressed. For example, a patient with heat illness may require cooling measures in addition to fluid replacement.
Excessive Urinary Losses
Some conditions cause the body to lose unusually large quantities of water through urine.
Potential causes include:
Diuretic therapy
Uncontrolled diabetes mellitus with osmotic diuresis
Diabetes insipidus
Certain kidney disorders
Other causes of polyuria
In these cases, simply replacing the fluid deficit may not be enough because the underlying cause may continue producing excessive urine.
For example, a patient with uncontrolled hyperglycemia may become dehydrated because glucose-induced osmotic diuresis increases urinary water loss. IV fluids for dehydration may help restore circulating volume, but treatment must also address the underlying hyperglycemia and associated metabolic abnormalities.
This demonstrates why identifying the cause of dehydration is as important as replacing the fluid that has already been lost.
Burns and Extensive Skin Loss
Major burns can cause substantial fluid movement out of the vascular compartment and through damaged skin. This type of fluid loss is different from simply drinking too little water.
Patients with significant burns require specialized fluid-resuscitation protocols based on burn size, body weight, timing, urine output, and clinical response. Such patients should not be managed by simply applying a routine IV for dehydration regimen.
For example, a patient with extensive burns may require carefully calculated IV fluid resuscitation under a specialized burn-management protocol. The nurse monitors urine output, hemodynamic status, peripheral perfusion, and other indicators to determine whether the prescribed therapy is adequate.
High-Output Gastrointestinal Losses
Patients with gastrointestinal drains, fistulas, ostomies, or other sources of high-output fluid loss can develop recurrent dehydration and electrolyte abnormalities.
These patients may appear adequately hydrated immediately after receiving IV fluids, yet become dehydrated again because fluid losses continue.
Accurate measurement of output is therefore essential.
For example, a patient with a high-output ileostomy may lose large volumes of fluid and sodium throughout the day. The nurse should measure the output, monitor fluid intake and relevant laboratory results, and report significant changes so that the fluid replacement plan can be adjusted.
Blood Loss and Other Volume Losses
Not every patient with low circulating volume has simple dehydration.
Blood loss, severe burns, third spacing, and other causes of reduced effective circulating volume may resemble dehydration but require different treatment approaches.
For example, a patient with significant gastrointestinal bleeding may have hypotension and tachycardia. Although IV fluids may be part of initial stabilization, replacing the lost blood and controlling the source of bleeding are fundamentally different from treating uncomplicated water loss.
This distinction is clinically important because giving large quantities of routine IV fluids for dehydration cannot substitute for definitive treatment of hemorrhage.
Multiple Simultaneous Causes
Some patients have more than one source of fluid loss.
A patient may have:
Fever and diarrhea
Vomiting and poor oral intake
Diarrhea and excessive urinary losses
Burns and inadequate oral intake
Heart disease combined with gastrointestinal fluid loss
When several factors occur simultaneously, fluid management becomes more complex.
Example: A patient with diabetes develops an infection accompanied by fever, vomiting, diarrhea, and increased urination. The patient is losing fluid through several pathways at once. In this situation, IV therapy for dehydration may be necessary, but fluid replacement alone is insufficient. The healthcare team must also address infection, glucose abnormalities, gastrointestinal losses, and electrolyte disturbances.
This is why a careful history is an important part of dehydration treatment. Knowing that a patient is dehydrated is not enough; clinicians need to understand why the dehydration occurred and whether the source of fluid loss is still active.
Matching Treatment to the Cause
The source of fluid loss should influence both the route and the composition of replacement.
For gastrointestinal illness, oral rehydration is preferred whenever the patient can drink and absorb fluids adequately. WHO identifies ORS as the primary treatment for most non-severe diarrheal dehydration, while IV fluids are required when dehydration is severe or shock is present.
For persistent vomiting, the ability to tolerate oral intake becomes a major consideration.
For excessive urinary losses, the underlying renal or metabolic cause must be treated.
For burns, specialized resuscitation protocols are required.
For hemorrhage, treatment must address blood loss rather than assuming that the patient has uncomplicated dehydration.
For cardiac or renal disease, the volume and rate of IV fluids must be balanced against the patient’s ability to tolerate additional fluid.
This cause-based approach helps prevent inappropriate treatment and explains why there is no universal best IV fluid or universal volume of fluid for every patient.
Special populations and causes of dehydration therefore require a more individualized approach to IV hydration therapy. Older adults may have reduced physiological reserve, children require careful weight-based assessment, pregnancy introduces maternal and fetal considerations, and heart or kidney disease can significantly alter fluid tolerance. Meanwhile, vomiting, diarrhea, sweating, urinary losses, burns, and bleeding each produce different clinical challenges.
For nurses, the essential principle is to consider not only how much fluid the patient has lost, but also what was lost, why it was lost, whether the loss is continuing, and how the patient’s body can tolerate replacement. This approach makes IV fluid therapy safer and more clinically appropriate while reducing the risk of both persistent dehydration and excessive fluid administration.
Benefits of IV Hydration
Recovery and Prevention of Dehydration
Recovery from dehydration involves more than replacing the fluid that was lost. The patient must be reassessed to determine whether circulation, urine production, electrolyte levels, symptoms, and overall fluid balance are improving. When IV fluids have been used, recovery also includes deciding when intravenous therapy is no longer necessary and when the patient can safely resume adequate oral fluid intake.
The recovery process depends on the severity of dehydration, the cause of fluid loss, the patient’s age and health status, and whether losses are continuing. A patient who became dehydrated after a short episode of vomiting may recover relatively quickly once oral fluids are tolerated. In contrast, a patient with prolonged diarrhea, persistent fever, kidney disease, or another condition causing ongoing fluid loss may require longer monitoring and a more individualized dehydration treatment plan.
An important principle of recovery is that replacing fluid should be guided by the patient’s clinical response rather than by the assumption that a predetermined volume of fluid is appropriate for everyone. Excessive IV fluids for dehydration can produce fluid overload, while inadequate replacement can leave the patient with persistent volume depletion. For this reason, assessment continues throughout IV therapy and during the transition back to oral hydration.
Signs of Improved Hydration
Improved hydration is determined by looking for a pattern of clinical improvement rather than relying on a single sign. The nurse or other healthcare professional compares the patient’s current condition with the findings obtained during the initial assessment.
Several findings may indicate that fluid replacement is working:
Improved vital signs: Tachycardia may decrease as circulating volume improves, while blood pressure may return toward the patient’s usual level when hypotension was caused by volume depletion.
Improved peripheral perfusion: Skin temperature, capillary refill, peripheral pulses, and general circulation may improve as intravascular volume is restored.
Increased urine production: Urine output generally becomes more adequate when renal perfusion improves. Urine concentration may also decrease as the patient becomes better hydrated, although urine appearance should not be used as the sole measure of hydration.
Improved mental status: A patient who was experiencing dizziness, weakness, confusion, irritability, or reduced alertness because of dehydration may become more alert and able to participate in care.
Reduced thirst and dry mouth: Thirst, oral dryness, and other symptoms of dehydration may diminish as the body’s water deficit is corrected.
Improved ability to tolerate oral fluids: A patient recovering from vomiting or diarrhea may gradually become capable of drinking without triggering further gastrointestinal losses.
More stable weight: When appropriate, changes in body weight can help evaluate changes in fluid status, particularly in patients receiving ongoing fluid therapy.
Improved laboratory findings: Abnormal electrolyte concentrations or markers associated with reduced renal perfusion may improve when the underlying fluid and electrolyte disturbance is corrected.
Urine output deserves particular attention because the kidneys play an important role in maintaining fluid balance. However, increased urine output does not automatically mean that all dehydration has been corrected, and low urine output does not always mean that more fluid should be administered. Kidney function, medications, obstruction, shock, and other conditions can influence urine production. Clinical findings and laboratory results therefore need to be interpreted together.
For patients receiving IV fluids, improvement should also occur without evidence of excessive replacement. The healthcare professional should watch for new or worsening peripheral edema, increasing respiratory rate, shortness of breath, crackles, falling oxygen saturation, or other indications that the patient may be developing fluid overload. This is particularly important in patients with cardiac or renal impairment.
Example
Consider an adult who arrives with several days of vomiting and diarrhea. The patient has dry mucous membranes, tachycardia, dizziness when standing, and reduced urine output. After appropriate IV hydration, the patient’s heart rate decreases, blood pressure stabilizes, urine output improves, dizziness resolves, and the patient becomes able to drink small amounts without vomiting.
These findings suggest that the IV fluids for dehydration have helped restore the patient’s fluid status. However, the nurse should not determine recovery solely from the improved heart rate. The patient should also be assessed for continuing gastrointestinal losses, electrolyte abnormalities, oral intake, urine output, and signs of fluid excess.
Another important distinction is between symptom improvement and complete resolution of the underlying problem. A patient may feel less thirsty after receiving an IV fluid infusion while still having diarrhea that continues to cause fluid and electrolyte loss. Recovery therefore requires attention to both hydration status and the cause of dehydration.
Transitioning From IV to Oral Fluids
IV therapy is a means of replacing fluid when oral intake is inadequate, unsafe, or insufficient. It is generally not intended to continue longer than necessary. Once the patient is clinically stable and can safely drink and absorb fluids, treatment can begin transitioning from intravenous replacement to oral hydration.
This transition should be based on the patient’s condition rather than simply on the amount of IV fluid already administered. A patient may have received a substantial volume of IV fluids for dehydration but still require continued replacement if vomiting, diarrhea, fever, excessive sweating, or another source of fluid loss remains active.
Before reducing or stopping IV therapy, the healthcare professional considers several factors:
The patient can drink safely. The patient should be sufficiently alert and able to swallow without a significant aspiration risk.
The gastrointestinal tract can absorb fluid. Oral hydration is less effective when persistent vomiting, severe gastrointestinal dysfunction, or another problem prevents adequate absorption.
Symptoms are improving. Severe dizziness, confusion, marked weakness, or circulatory instability may indicate that further assessment and treatment are necessary.
Hemodynamic status is stable. Blood pressure, pulse, peripheral perfusion, and other indicators should be appropriate for the patient’s condition.
Urine output is adequate or improving. Renal function and urine production provide useful information about the patient’s response to fluid therapy.
Ongoing losses can be managed orally. The patient should be able to replace continuing losses through an appropriate oral fluid or oral rehydration solution when clinically appropriate.
Electrolyte abnormalities are being addressed. Significant abnormalities may require continued monitoring, specific replacement, or further treatment rather than simply stopping the IV infusion.
The underlying cause is being treated. Treating vomiting, diarrhea, fever, infection, excessive sweating, or another cause of fluid loss helps prevent recurrent dehydration.
For dehydration caused by diarrhea or vomiting, an oral rehydration solution (ORS) can be particularly useful because it replaces both water and important electrolytes. ORS is not simply water; its combination of glucose and electrolytes facilitates intestinal absorption of sodium and water. WHO and CDC guidance emphasizes oral rehydration for patients who can drink and do not have severe dehydration requiring immediate IV replacement.
The transition can be gradual. A patient who has recently stopped vomiting may begin with small, frequent amounts of oral fluid rather than immediately consuming a large volume. If the patient tolerates these amounts, intake can be increased according to clinical needs.
Example of a gradual transition
A patient with gastroenteritis initially has moderate dehydration and persistent vomiting. The patient receives appropriate IV treatment and is monitored. Several hours later, vomiting has stopped, vital signs are stable, urine output has improved, and the patient can tolerate small amounts of ORS.
Instead of automatically continuing the IV drip until a fixed volume has been completed, the care team can reassess whether oral replacement is now adequate. If the patient continues to tolerate oral fluids and there are no other indications for IV therapy, the IV infusion may be reduced or discontinued according to the treatment plan.
This illustrates an important principle: getting IV fluids does not mean that a patient must remain on an IV infusion until every symptom has disappeared. The purpose of IV hydration is to provide the route of fluid replacement that is needed at that stage of illness. Once oral hydration becomes safe and effective, oral fluids can assume a larger role.
The transition also requires education. Patients should understand how much and how frequently to drink, what types of fluids may be appropriate, and when to seek additional medical attention. If diarrhea or vomiting continues, they may need to replace ongoing losses rather than simply return to their usual fluid intake.
In patients with conditions such as heart failure or significant kidney impairment, oral fluid intake may also need to follow individualized fluid restrictions or clinical instructions. Therefore, the advice to “drink more” is not appropriate for every patient without considering the patient’s overall medical condition.
Preventing Future Dehydration
Preventing dehydration means addressing both inadequate fluid intake and the conditions that cause excessive fluid loss. Prevention is particularly important for people who are at increased risk of dehydration, including infants and young children, older adults, people with conditions that impair their ability to drink, and individuals experiencing prolonged vomiting, diarrhea, fever, or heavy sweating.
For most healthy people, maintaining adequate routine fluid intake and responding to thirst are important components of hydration. However, fluid requirements vary according to age, body size, physical activity, environmental temperature, illness, diet, and medical conditions.
Several practical strategies can help prevent dehydration:
Drink fluids regularly: Avoid waiting until severe thirst develops, particularly during illness, hot weather, or prolonged physical activity.
Increase replacement during fluid loss: Vomiting, diarrhea, fever, heavy sweating, and strenuous exercise can increase fluid requirements.
Use appropriate oral rehydration solutions when indicated: ORS can be especially valuable when diarrhea or vomiting causes significant water and electrolyte losses.
Monitor urine and other symptoms: A noticeable reduction in urine production, increasing thirst, dry mouth, dizziness, weakness, or other dehydration symptoms should prompt attention to fluid intake and the underlying cause.
Address vomiting and diarrhea early: Continuing gastrointestinal losses can rapidly worsen dehydration, particularly in young children and older adults.
Take extra precautions in hot environments: People who work or exercise in high temperatures may lose substantial amounts of fluid through sweating and should plan appropriate fluid replacement.
Ensure vulnerable individuals have access to fluids: Older adults or people who have mobility, cognitive, swallowing, or functional difficulties may need assistance or scheduled opportunities to drink.
Follow individualized medical instructions: Patients with heart, kidney, liver, or other conditions may have specific fluid recommendations or restrictions.
Prevention is especially important when a known cause of dehydration is likely to recur. For example, a person who frequently develops diarrhea should know how to begin appropriate oral replacement early rather than waiting until severe dehydration develops. Similarly, an athlete exercising in hot conditions should plan fluid replacement before, during, and after prolonged activity rather than attempting to correct a major deficit after symptoms appear.
Older adults require particular attention because the sensation of thirst can become less reliable with aging. Mobility limitations, cognitive impairment, medications, and dependence on caregivers may also interfere with regular fluid intake. A practical prevention strategy may include making fluids readily available and establishing regular opportunities to drink rather than relying entirely on thirst.
Children can also become dehydrated quickly when they have vomiting or diarrhea because their fluid requirements relative to body size are substantial. Parents and caregivers should pay attention to reduced urination, unusual sleepiness or irritability, dry mouth, inability to drink, and other signs of dehydration. Children with severe dehydration require prompt medical assessment and may need IV replacement.
Preventing recurrence also means recognizing that dehydration is sometimes a symptom of another condition. Repeated dehydration may occur because of persistent gastrointestinal disease, uncontrolled blood glucose, excessive urinary losses, medication effects, infection, or another underlying disorder. In such cases, simply increasing fluid intake may not solve the problem. The cause of the fluid loss needs to be identified and appropriately managed.
For patients who have previously required IV fluids for dehydration, education should also emphasize when professional assessment is necessary. Persistent vomiting, inability to keep fluids down, very low urine output, fainting, confusion, severe weakness, signs of shock, or worsening symptoms can indicate that oral hydration is no longer sufficient and that urgent medical evaluation is needed.
The goal of prevention is therefore not merely to “drink more water.” Effective prevention involves maintaining appropriate fluid and electrolyte balance, recognizing early dehydration symptoms, replacing ongoing losses appropriately, managing the underlying cause of fluid loss, and seeking medical care when dehydration becomes significant.
A patient who understands these principles is less likely to wait until moderate to severe dehydration develops before seeking treatment. Early recognition and appropriate oral replacement can often prevent progression to a situation in which IV hydration therapy becomes necessary.
Clinical Examples of IV Fluids for Dehydration
Clinical examples help demonstrate why there is no single best IV fluid for every patient with dehydration. The appropriate approach depends on how much fluid has been lost, whether the patient can drink, the presence of circulatory compromise, the type of fluid loss, electrolyte abnormalities, kidney function, cardiac status, age, and ongoing losses.
In practice, the healthcare professional first determines the severity of dehydration and whether the patient needs oral replacement or IV fluids for dehydration. If intravenous therapy is necessary, the clinician selects an appropriate IV solution, determines the amount and rate required, and repeatedly reassesses the patient’s response. NICE guidance emphasizes assessment of fluid needs, ongoing losses, and conditions such as renal, cardiac, and electrolyte abnormalities when managing IV fluid therapy.
The following examples are simplified clinical scenarios designed to illustrate decision-making rather than provide fixed treatment prescriptions.
Mild Dehydration
Mild dehydration is generally managed with oral hydration when the patient is alert, able to drink, and able to absorb fluids. Therefore, a patient with mild dehydration does not automatically require an IV for dehydration.
For example, consider a healthy adult who develops mild dehydration after spending several hours outdoors in hot weather. The patient reports thirst and a dry mouth but is alert, has a stable blood pressure and heart rate, is producing urine, and has no persistent vomiting or diarrhea.
In this situation, IV hydration may not be necessary. The patient can generally begin replacing lost fluids through appropriate oral fluid intake. Depending on the circumstances, water and fluids containing electrolytes may be useful, particularly when sweating has been substantial.
The important clinical point is that the presence of dehydration alone does not establish an indication for an IV drip. The route of replacement should match the patient’s condition. Oral hydration is less invasive, avoids IV-site complications, and can adequately treat many cases of mild dehydration.
Example: Mild dehydration after exercise
A 25-year-old person completes a long outdoor run on a hot day. Afterward, the person is thirsty, has mild oral dryness, and feels tired but remains alert and hemodynamically stable. There is no persistent vomiting, diarrhea, confusion, or inability to drink.
The initial approach would generally involve stopping strenuous activity, moving to an appropriate environment, and replacing fluids orally. If the person can drink safely and has no concerning symptoms, there may be no reason to use IV fluids.
This example demonstrates why mild dehydration intravenous fluid therapy is not routinely required. An IV catheter introduces additional risks, including infiltration, phlebitis, and infection, when the gastrointestinal route is already functioning adequately.
However, a patient initially appearing to have mild dehydration may require reassessment if symptoms worsen or oral intake becomes impossible. For example, continued vomiting could change the treatment decision and make IV treatment appropriate.
Example: Mild dehydration associated with diarrhea
A patient with a short episode of diarrhea has increased thirst and slightly reduced urine output but remains alert, has stable vital signs, and can drink. In this situation, an oral rehydration solution may be particularly appropriate because diarrhea causes both water and electrolyte losses.
WHO and CDC guidance support oral rehydration for patients with diarrheal illness who do not have severe dehydration and can drink.
The patient’s progress should still be monitored. If diarrhea becomes severe, oral intake becomes inadequate, or signs of worsening dehydration develop, the patient may need medical reassessment and possibly IV fluids for dehydration.
Moderate Dehydration
Moderate dehydration requires more careful assessment because fluid loss is greater and the patient’s ability to maintain adequate hydration through oral intake may be compromised.
A patient with moderate dehydration may have several findings such as:
Increased thirst
Dry mucous membranes
Reduced urine output
Tachycardia
Weakness or fatigue
Dizziness, particularly when standing
Reduced skin turgor in some patients
Mild hypotension or orthostatic changes
Continuing vomiting or diarrhea
Difficulty maintaining adequate fluid intake
The treatment decision depends on whether the patient can drink and absorb fluids and whether there is evidence of circulatory compromise.
Example: Moderate dehydration from vomiting and diarrhea
Consider an adult who has had two days of gastroenteritis with repeated vomiting and diarrhea. The patient is weak and dizzy when standing, has dry mucous membranes, a rapid pulse, and reduced urine output.
The healthcare professional assesses the patient’s vital signs, perfusion, mental status, urine output, ongoing gastrointestinal losses, and relevant laboratory values. If the patient can tolerate oral fluids and has no significant circulatory instability, oral rehydration may still be appropriate.
If vomiting prevents adequate oral replacement, however, IV fluids for dehydration may be indicated.
In this setting, an isotonic crystalloid such as normal saline or Lactated Ringer’s solution may be considered depending on the patient’s clinical condition and the treatment protocol. Isotonic crystalloids are commonly used when intravascular volume needs to be restored.
The nurse’s role includes monitoring the response rather than simply allowing the prescribed infusion to run without reassessment. Heart rate, blood pressure, respiratory status, peripheral perfusion, urine output, symptoms, fluid balance, and the IV site may all provide information about the effectiveness and safety of the infusion of fluids.
Example: Moderate dehydration in an older adult
An older adult develops vomiting and diarrhea and has reduced oral intake for several days. The patient is weak, has a dry mouth, and has reduced urine output.
The situation requires additional caution because older adults may have reduced thirst perception, impaired renal concentrating ability, medication-related risks, and coexisting cardiac or renal disease. The clinician therefore needs to determine both how much fluid has been lost and how well the patient can tolerate additional fluid.
If oral hydration is inadequate, getting IV fluids may be appropriate. However, the volume and rate must be individualized. A patient with previously unrecognized heart failure, for example, could develop pulmonary edema if fluid is administered too aggressively.
This illustrates an important principle: moderate dehydration does not determine a universal IV fluid dose. The same apparent degree of dehydration can require different management depending on the patient’s age, comorbidities, laboratory results, ongoing losses, and response to treatment.
Example: Moderate dehydration in a child
A child with gastroenteritis may develop significant fluid losses relatively quickly because children have substantial fluid requirements relative to their body size.
When the child has mild or moderate dehydration and can drink, oral rehydration is generally preferred. If dehydration becomes severe or the child cannot adequately tolerate oral replacement, IV therapy may become necessary. CDC guidance describes oral rehydration as the preferred approach for mild-to-moderate dehydration from acute gastroenteritis and recommends prompt IV therapy for severe dehydration.
When IV fluids are used in children, accurate body weight and close reassessment are particularly important. Pediatric fluid therapy is generally calculated using weight and clinical status rather than simply applying an adult volume.
Severe Dehydration
Severe dehydration is a medical emergency because substantial fluid loss can compromise circulating blood volume, tissue perfusion, and organ function.
A patient with severe dehydration may exhibit:
Marked tachycardia
Significant hypotension
Very low or absent urine output
Poor peripheral perfusion
Weak peripheral pulses
Severe weakness
Altered mental status
Fainting or near-fainting
Cold or clammy extremities in advanced circulatory compromise
Rapid breathing
Inability to drink or retain oral fluids
Signs of shock
The exact presentation varies according to the cause, age, underlying disease, and speed of fluid loss.
When severe dehydration produces circulatory compromise, IV fluid therapy may be required because oral fluids cannot restore intravascular volume rapidly enough. WHO guidance for severe dehydration associated with diarrheal disease recommends rapid IV replacement using appropriate isotonic solutions, with close monitoring and reassessment.
Example: Severe dehydration from gastroenteritis
An adult presents after several days of profuse diarrhea and vomiting. The patient is confused, profoundly weak, hypotensive, tachycardic, and producing very little urine. The patient is unable to drink because of ongoing vomiting.
This presentation is consistent with a potentially life-threatening degree of volume depletion. The priority is urgent assessment and stabilization, including appropriate IV fluids for dehydration when indicated.
An isotonic crystalloid such as Lactated Ringer’s solution or normal saline may be used according to the clinical situation and applicable protocol. WHO guidance identifies Ringer’s lactate as a preferred solution for severe dehydration in diarrheal disease, with normal saline as an alternative in relevant protocols.
The patient requires frequent reassessment rather than receiving a large amount of fluid without monitoring. Vital signs, mental status, peripheral perfusion, respiratory status, urine output, and other indicators of fluid response help determine whether replacement is adequate.
At the same time, the underlying cause of the fluid loss must be addressed. Replacing fluid without addressing continuing diarrhea, infection, bleeding, or another cause can result in recurrent volume depletion.
Severe dehydration and fluid overload
Severe dehydration creates a difficult clinical balance. The patient needs enough fluid replacement to restore perfusion, but excessive administration can produce complications.
This is especially important when severe dehydration occurs in a patient with heart failure or impaired kidney function. The healthcare professional may need to administer fluid carefully while monitoring for pulmonary edema, peripheral edema, worsening respiratory status, and other signs of excessive fluid administration.
NICE emphasizes the importance of reassessment and monitoring during IV therapy because both inadequate and excessive fluid administration can cause harm.
Example: Severe dehydration with inability to drink
A patient with severe vomiting cannot retain even small amounts of oral fluid. The patient becomes increasingly weak and develops reduced urine output and signs of circulatory compromise.
In this circumstance, simply advising the patient to “drink more water” is inappropriate because the oral route is not currently providing effective fluid replacement. IV access may be necessary to restore circulating volume while the cause of vomiting is evaluated and treated.
Once the patient stabilizes and can tolerate oral fluids, the treatment strategy can shift toward oral hydration. This prevents unnecessary continuation of IV hydration therapy after the intravenous route is no longer required.
Dehydration With Electrolyte Imbalance
Dehydration frequently involves more than a loss of water. Depending on the cause, the patient may also lose sodium, potassium, chloride, bicarbonate, and other electrolytes. Consequently, a patient can have both dehydration and an electrolyte imbalance.
This distinction is clinically important because simply administering water or an inappropriate IV solution may not correct the underlying problem.
Electrolyte abnormalities may occur with:
Prolonged vomiting
Prolonged diarrhea
Heavy sweating
Excessive urinary losses
Certain medications
Kidney disorders
Endocrine disorders
Poor nutritional intake
Large-volume fluid replacement
Conditions associated with abnormal sodium or potassium regulation
Laboratory testing can help identify clinically important abnormalities and guide treatment.
Example: Dehydration with sodium loss
A patient has prolonged diarrhea and develops dehydration accompanied by a low serum sodium concentration. The patient has weakness and dizziness and has difficulty maintaining oral intake.
The treatment plan must account for both fluid volume and sodium status. The healthcare professional should not assume that every dehydrated patient should receive the same type of IV fluid.
The appropriate solution and rate depend on the severity and cause of the sodium abnormality, the patient’s symptoms, volume status, and other laboratory findings. Rapid correction of certain sodium disorders can itself be dangerous, so correction must be appropriately controlled and monitored.
This example demonstrates why fluid and electrolyte balance should be considered together when selecting IV therapy.
Example: Dehydration with potassium loss
Consider a patient who has experienced several days of vomiting and diarrhea. The patient is dehydrated and laboratory testing shows hypokalemia.
The initial IV fluid may help restore circulating volume, but fluid replacement alone does not necessarily correct the potassium deficit. The patient may require separate potassium replacement according to the severity of the abnormality and clinical protocol.
Potassium replacement requires particular care because excessive or overly rapid administration can cause dangerous cardiac effects. Potassium should therefore not be added to an IV solution or administered intravenously without an appropriate order, concentration, administration method, and monitoring.
The nurse should monitor relevant laboratory results, cardiac status when indicated, renal function, IV access, and the patient’s clinical response.
Example: Dehydration with hypernatremia
Another patient has experienced substantial water loss without adequate replacement. Laboratory testing reveals hypernatremia.
This situation differs from simple volume depletion because the patient’s fluid and electrolyte status is abnormal in a specific way. Treatment must correct the underlying water deficit while avoiding excessively rapid changes in serum sodium.
The choice of IV fluids used depends on the patient’s hemodynamic condition and the cause and severity of hypernatremia. If the patient is also hemodynamically unstable, restoration of circulating volume may take priority with an appropriate isotonic crystalloid before more gradual correction of the water deficit. Subsequent fluid therapy must be carefully guided by serial laboratory testing and clinical reassessment.
This is an example of why the best IV fluid cannot be selected based solely on the word “dehydration.” The clinician must determine what the patient has lost and what needs to be restored.
Example: Dehydration with metabolic abnormalities after diarrhea
A patient with prolonged diarrhea may lose substantial bicarbonate along with water and electrolytes. The patient may therefore develop an acid-base disturbance in addition to volume depletion.
In this situation, the treatment plan may involve appropriate IV crystalloid replacement, laboratory monitoring, treatment of the underlying diarrhea, and correction of clinically significant electrolyte or acid-base abnormalities.
The nurse should recognize that improvement in blood pressure does not necessarily mean that all physiological abnormalities have been corrected. The patient may still require laboratory reassessment before treatment is considered complete.
Clinical approach to dehydration with electrolyte imbalance
When dehydration and electrolyte abnormalities occur together, the clinical approach generally involves several interconnected steps:
Assess the severity of dehydration. Determine whether the patient has mild, moderate, or severe volume depletion and whether there are signs of circulatory compromise.
Identify the cause of fluid loss. Determine whether vomiting, diarrhea, sweating, urinary losses, inadequate intake, bleeding, or another condition is responsible.
Evaluate electrolyte status. Review sodium, potassium, chloride, bicarbonate and other relevant laboratory findings.
Assess kidney function. Renal impairment can substantially alter the body’s ability to excrete water and electrolytes.
Select an appropriate IV solution when IV therapy is indicated. The solution should correspond to the patient’s volume status and electrolyte requirements.
Replace specific electrolytes when necessary. Fluid replacement and electrolyte replacement are related but are not always interchangeable.
Monitor the response. Reassess vital signs, urine output, mental status, fluid balance, laboratory values, and signs of fluid overload.
Treat the underlying cause. Correcting the source of ongoing losses is essential to prevent recurrent dehydration.
NICE specifically emphasizes that IV fluid management should account for ongoing losses and electrolyte abnormalities and should include regular reassessment.
Across all of these clinical examples, the central lesson is that IV fluids for dehydration are selected according to the patient’s physiological needs rather than according to a single universal formula. Mild dehydration may require no IV therapy at all, moderate dehydration may require oral or IV replacement depending on the patient’s ability to drink and clinical status, and severe dehydration with circulatory compromise may require urgent IV fluid resuscitation.
Likewise, dehydration accompanied by sodium, potassium, or acid-base abnormalities requires a more individualized approach. The healthcare professional must consider fluid volume, fluid and electrolyte balance, ongoing losses, renal and cardiac function, and the patient’s response to treatment.
For nursing practice, recognizing these differences is essential. The goal is not simply to administer an IV drip but to understand why the fluid is being given, what physiological problem it is intended to correct, how the patient should respond, and what findings could indicate that the treatment needs to be reassessed.
Conclusion
IV Fluids for Dehydration are an important component of fluid therapy when the body has lost more fluid than can be replaced through adequate oral intake. However, IV therapy is not automatically required whenever dehydration occurs. The appropriate approach depends on the severity of dehydration, the cause of fluid loss, the patient’s ability to drink and absorb fluids, electrolyte status, ongoing losses, and underlying conditions such as heart or kidney disease.
Understanding the different types of IV fluids, including normal saline and Lactated Ringer’s solution, helps healthcare professionals select an appropriate IV solution for the patient’s physiological needs. Equally important is recognizing that fluid replacement involves more than restoring water. Sodium, potassium, chloride, bicarbonate, and overall fluid and electrolyte balance may need to be assessed and managed, particularly when dehydration results from prolonged vomiting, diarrhea, excessive sweating, or other significant fluid losses.
Safe administration of IV fluids for dehydration requires continuous assessment. Nurses monitor vital signs, urine output, mental status, peripheral perfusion, fluid intake and output, laboratory findings, the IV site, and signs of fluid overload. These assessments help determine whether the patient is responding appropriately or whether the treatment requires modification.
Recovery does not end when the IV infusion is stopped. Once the patient is stable and can safely drink, transitioning from intravenous therapy to oral fluids helps restore normal hydration while avoiding unnecessary IV treatment. Preventing future dehydration also requires addressing the underlying cause, recognizing early signs of dehydration, replacing ongoing fluid and electrolyte losses appropriately, and paying particular attention to individuals at increased risk.
For nursing practice, the most important lesson is that there is no single best IV fluid or universal approach for every patient. Effective dehydration treatment requires clinical judgment, careful assessment, appropriate fluid replacement, and repeated reassessment. By understanding when to use IV therapy, how different IV fluids function, and how to evaluate the patient’s response, nurses can contribute to safe, individualized, and effective care for patients suffering from dehydration.
Frequently Asked Questions
What are the 5 main types of IV fluids?
The five commonly discussed types are normal saline (0.9% sodium chloride), Lactated Ringer’s solution, half-normal saline (0.45% sodium chloride), dextrose solutions such as D5W, and hypertonic saline solutions. They are generally classified as isotonic, hypotonic, or hypertonic based on their tonicity.
What IV fluids should be given for dehydration?
For significant dehydration requiring IV fluids for dehydration, isotonic crystalloids such as normal saline or Lactated Ringer’s solution are commonly used, particularly when intravascular volume needs to be restored. The specific fluid depends on the cause of dehydration, electrolyte levels, ongoing losses, and the patient’s kidney or heart function.
What is the 4-2-1 rule for dehydration?
The 4-2-1 rule is a weight-based formula for estimating a patient’s hourly maintenance IV fluid requirement, not a formula specifically for treating dehydration. It gives:
4 mL/kg/hr for the first 10 kg
2 mL/kg/hr for the next 10 kg
1 mL/kg/hr for each kilogram above 20 kg
For example, a 30-kg patient would have an estimated maintenance rate of 70 mL/hr (40 + 20 + 10). Actual fluid therapy may need adjustment based on clinical condition and ongoing losses.
What are the risks of IV fluids?
Risks include fluid overload, pulmonary edema, electrolyte imbalances, hyperchloremia, and acid-base disturbances. IV access can also cause infiltration, phlebitis, hematoma, extravasation, and infection. Patients with heart or kidney impairment may be particularly vulnerable to complications from excessive fluid administration.
NCLEX-PN Study Plan 2026: Complete NCLEX Study Schedule and Test Plan to Pass the Exam
The NCLEX-PN is a major component of the transition from nursing education to practical nursing licensure. Passing the examination requires more than memorizing definitions, medications, procedures, or isolated nursing facts. The examination is designed to determine whether a candidate can apply entry-level nursing knowledge to client situations, recognize important findings, establish priorities, make safe decisions, and respond appropriately to changing clinical conditions. Effective preparation therefore requires a structured approach that connects content knowledge with application, clinical reasoning, and consistent practice.
The 2026 NCLEX-PN is based on the current examination framework established by the National Council of State Boards of Nursing (NCSBN). Its test plan provides the foundation for the content and processes evaluated during the examination, helping define the knowledge, abilities, and nursing behaviors expected of candidates entering practical nursing practice. The examination also incorporates clinical judgment into the assessment process, meaning that preparation must extend beyond simple recall. Candidates need to become comfortable interpreting information, identifying relevant cues, determining priorities, selecting appropriate nursing actions, and evaluating whether those actions address the client’s needs.
A well-designed NCLEX-PN Study Plan provides structure for this preparation. Rather than treating every nursing topic as equally important or attempting to review an entire nursing program indiscriminately, a structured plan helps organize preparation around the major areas measured by the examination. It can also establish a realistic progression from foundational content review to application through practice questions and more complex clinical scenarios.
An effective plan should account for several important elements:
Content knowledge: Reviewing essential nursing concepts, including client needs, safety, physiological concepts, pharmacology, health promotion, and other areas relevant to practical nursing practice.
Clinical application: Learning to apply nursing knowledge to realistic client situations instead of relying exclusively on memorization.
Clinical judgment: Developing the ability to recognize relevant information, interpret findings, prioritize problems, and select appropriate nursing actions.
Practice: Completing questions regularly and using the rationales to understand why an answer is appropriate or inappropriate.
Remediation: Identifying recurring weaknesses and deliberately reviewing those areas rather than repeatedly practicing material that is already well understood.
Consistency: Establishing manageable study sessions and maintaining them over an appropriate preparation period.
The amount of preparation required can vary considerably. Someone with strong recent nursing knowledge may need a shorter period of focused review, while someone returning to the examination after a significant gap or identifying substantial content weaknesses may benefit from a longer preparation period. Available study time also matters. A person who can devote several hours each day may organize preparation differently from someone balancing employment, family responsibilities, or other commitments. For this reason, an effective NCLEX-PN Study Plan should be structured enough to provide direction but flexible enough to accommodate individual circumstances.
Preparation should also reflect the way the examination evaluates nursing knowledge. Simply reading a study guide from beginning to end may provide exposure to information but does not necessarily develop the ability to use that information in an examination situation. Similarly, completing large numbers of practice questions without reviewing the underlying reasoning may produce a misleading sense of progress. Meaningful preparation involves moving between learning, application, evaluation, and remediation.
The relationship between these components can be viewed as a continuous cycle:
Review: Establish or strengthen understanding of important nursing concepts.
Practice: Apply those concepts to NCLEX-style questions and clinical situations.
Analyze: Examine the reasoning behind both correct and incorrect responses.
Remediate: Return to the underlying content when weaknesses are identified.
Reassess: Use additional practice to determine whether understanding has improved.
This approach is particularly important as the examination incorporates Next Generation NCLEX (NGN) methodology and clinical judgment. A candidate may know the signs and symptoms associated with a condition but still need to determine which finding is most significant, what information requires immediate attention, what intervention is appropriate, or whether a client is improving. Consequently, effective preparation must develop the ability to connect individual pieces of information and use them to make safe nursing decisions.
The 2026 NCLEX-PN Study Plan covered in this guide is therefore organized around the major stages of effective preparation. It begins with understanding the examination and its test plan, followed by the development of a realistic study schedule based on individual readiness and available study time. The guide then addresses content review, pharmacology, practice questions, clinical judgment, NGN preparation, study resources, and a structured four-week approach to intensive preparation.
The later sections address how to approach NCLEX questions, manage difficult items, prepare for test day, and avoid common study mistakes. These areas are important because examination readiness involves both knowledge and the ability to apply that knowledge under testing conditions. A candidate may understand nursing content yet struggle if preparation has not included sufficient practice with prioritization, clinical scenarios, question analysis, and time management.
Ultimately, an NCLEX-PN Study Plan is most effective when it transforms preparation from an unstructured accumulation of study hours into a deliberate learning process. The objective is not simply to complete a certain number of pages or questions, but to progressively develop the knowledge, reasoning, and decision-making abilities required to demonstrate safe entry-level practical nursing competence on the NCLEX-PN.
Understanding the 2026 NCLEX-PN Exam
The 2026 NCLEX-PN is a licensure examination designed to determine whether a candidate has the knowledge, skills, abilities, and clinical judgment necessary to provide safe and effective entry-level practical or vocational nursing care. It is not simply a comprehensive examination of everything covered in nursing school. Instead, the examination is built around the competencies considered important for safe entry-level practice. The National Council of State Boards of Nursing (NCSBN) develops the examination, while nursing regulatory bodies use examination results as part of the licensure process.
Understanding this distinction is important when developing an NCLEX-PN Study Plan. Preparation should not consist of randomly reviewing textbooks or attempting to memorize every fact encountered during a nursing program. The examination requires candidates to recognize important clinical information, understand what that information means, prioritize client needs, make appropriate nursing decisions, and evaluate outcomes.
The 2026 examination is guided by the 2026 NCLEX-PN Test Plan, which became effective April 1, 2026, and provides the framework for the examination through March 31, 2029. The test plan is based in part on the 2024 PN Practice Analysis, which examined entry-level LPN/VN practice and the importance of various nursing activities to safe client care. NCSBN updates its practice analyses and test plans on a recurring cycle so that the examination continues to reflect contemporary entry-level nursing practice.
For anyone preparing for the 2026 NCLEX-PN, the test plan should therefore serve as a central study guide. It helps identify the broad content areas that require attention while also demonstrating that nursing knowledge cannot be separated from clinical decision-making, communication, caring, teaching and learning, and other integrated processes.
NCLEX-PN test plan, exam format, and client needs
The NCLEX-PN test plan is one of the most important documents to understand before beginning an intensive NCLEX study plan. NCSBN describes the test plan as providing information about the content and scope of the examination and as a guide for both examination development and candidate preparation.
The 2026 plan organizes examination content around Client Needs. This approach is important because questions are not simply presented as isolated subjects such as anatomy, pharmacology, maternity, or pediatrics. Nursing knowledge is tested in relation to the needs of clients and the responsibilities of an entry-level practical/vocational nurse.
The major Client Needs categories provide a framework for organizing content review and include:
Safe and Effective Care Environment
Health Promotion and Maintenance
Psychosocial Integrity
Physiological Integrity
These categories are further divided into subcategories that describe specific areas of nursing responsibility. The test plan also incorporates integrated processes that apply across the examination rather than functioning as completely separate subjects. These include areas such as caring, clinical judgment, clinical problem solving, communication and documentation, culture and spirituality, and teaching and learning.
This structure has an important implication for an NCLEX-PN Study Plan: studying should be organized around both what the nurse needs to know and how that knowledge is applied to client care.
For example, consider a question involving a client who has recently undergone surgery. A candidate may need knowledge of:
expected postoperative findings;
pain assessment;
infection prevention;
fluid balance;
wound care;
medication administration;
mobility and positioning;
respiratory complications;
nutrition;
patient education; and
when a finding should be reported.
Although these concepts come from different areas of nursing knowledge, the question may present them together within a single client situation. The candidate therefore needs more than isolated memorization. The candidate must determine which information is clinically meaningful and what action should be taken.
How the Client Needs framework should influence studying
A useful study plan should use the Client Needs framework as an organizational tool rather than treating it as a list that must simply be memorized.
For example, instead of creating a study session titled “Read Chapter 14,” a more useful session might focus on:
Physiological Integrity → Pharmacological and Parenteral Therapies → medication safety
The session could then include:
reviewing high-priority medication concepts;
identifying common adverse effects;
distinguishing expected from dangerous findings;
practicing medication-related NCLEX questions;
reviewing the rationale for each response; and
documenting recurring weaknesses for later remediation.
This method connects content review, application, and evaluation.
The Client Needs framework also prevents a common preparation problem: spending excessive study time on subjects that feel familiar while neglecting less comfortable areas. A candidate might be confident with cardiovascular content but consistently miss questions involving psychosocial integrity, safety, delegation, communication, or health promotion. A structured NCLEX test plan makes it easier to identify these gaps.
The importance of entry-level nursing scope
The NCLEX-PN is designed around entry-level LPN/VN practice. This means candidates should pay particular attention to what a newly licensed practical/vocational nurse is expected to recognize, perform, communicate, report, and prioritize safely.
Questions can reflect multiple practice environments, including acute care, long-term care, rehabilitation, skilled care, outpatient settings, and community or home care.
Consequently, preparation should not assume that every NCLEX test question will resemble an acute-care hospital scenario.
For example, a question could involve:
an older adult receiving care in a long-term-care facility;
a client receiving treatment at home;
a postoperative client in an acute-care setting;
a client attending an outpatient clinic;
a client requiring rehabilitation; or
a family receiving education about ongoing care.
The setting may change, but the underlying expectation remains safe entry-level nursing practice.
Understanding the exam rather than predicting questions
A frequent mistake during NCLEX prep is trying to predict exactly which diseases, medications, or procedures will appear on the examination. Because the NCLEX is designed around competencies and client needs, preparation is more effective when it develops transferable nursing reasoning.
For example, memorizing the name of one medication is less valuable than understanding a medication-safety framework:
Why is the medication prescribed?
What assessment should occur before administration?
What findings indicate that the medication may be unsafe?
What adverse effects require immediate attention?
What teaching should be provided?
What should the nurse monitor after administration?
This approach allows knowledge to transfer to unfamiliar test questions.
The 2026 NCLEX-PN Test Plan also emphasizes that activity statements require application of fundamental principles of clinical decision-making and critical thinking. This is why an effective NCLEX preparation strategy should repeatedly move from knowledge acquisition to application.
What the NCLEX-PN format means for preparation
The NCLEX-PN uses a computerized examination format rather than a traditional paper-based examination. Candidates respond to questions presented through a computer, and the examination uses computer adaptive testing (CAT) to determine the difficulty of subsequent items.
The examination is not designed around a conventional percentage such as “answer 75% correctly and pass.” Instead, the CAT system evaluates a candidate’s ability in relation to the passing standard. This means the difficulty and sequence of questions can vary between candidates.
The practical consequence is important: two people can receive very different questions and still be evaluated against the same underlying competency standard.
Therefore, candidates should avoid comparing their preparation with another person’s exact question count, perceived question difficulty, or testing experience.
A candidate who receives challenging questions should not automatically assume that the examination is going badly. Likewise, receiving easier-looking questions does not automatically mean that the candidate is performing poorly. The adaptive nature of the examination makes the apparent difficulty of individual questions an unreliable indicator of the final result.
Question types and application
The NCLEX-PN includes different question types, including traditional multiple-choice items as well as newer formats associated with Next Generation NCLEX methodology. Candidates may encounter items requiring them to analyze information, identify relevant findings, make decisions, or evaluate clinical situations.
This makes question type practice test work particularly valuable. Preparation should expose candidates to different ways that nursing knowledge can be assessed rather than relying exclusively on conventional multiple-choice questions.
For example, a candidate might be asked to:
identify the most concerning finding;
determine which action should occur first;
select appropriate interventions;
recognize findings that require follow-up;
evaluate whether an intervention was effective;
interpret information from a clinical scenario; or
connect multiple findings before selecting a response.
The objective is not to memorize the appearance of each item but to become comfortable reasoning through different presentations of nursing problems.
NGN, clinical judgment, and computer adaptive testing
The 2026 NCLEX-PN places substantial emphasis on clinical judgment, making it an essential component of an effective NCLEX-PN Study Plan. NCSBN’s research into clinical judgment has informed the way nursing decision-making is represented within the examination. The 2026 test plan specifically incorporates clinical judgment into the assessment of entry-level practical/vocational nursing competence.
Clinical judgment can be understood as the process of using nursing knowledge, assessment information, context, and reasoning to determine what matters, what action is appropriate, and whether the client’s response indicates improvement or deterioration.
This is different from simple recall.
For example, a candidate may know that a respiratory rate of 24 breaths/minute is above the typical adult reference range. However, clinical judgment requires additional questions:
Is the finding expected for this client?
Is the client experiencing respiratory distress?
What other assessment findings are present?
Is oxygen saturation changing?
Is the client becoming confused or restless?
What finding is most concerning?
What action should occur first?
How should the response to that action be evaluated?
The ability to connect these findings is more representative of clinical judgment than recalling an isolated normal value.
Clinical judgment and the nursing process
Clinical judgment on the NCLEX-PN is closely connected with the practical application of the nursing process. Candidates should be comfortable moving through a sequence that involves recognizing relevant information, interpreting what it means, identifying appropriate priorities, selecting interventions, taking action, and evaluating outcomes.
A simplified clinical example illustrates this process.
Scenario: A client with pneumonia becomes increasingly restless. The client has a rising respiratory rate, declining oxygen saturation, and new difficulty speaking in complete sentences.
A candidate should not focus on one number in isolation. Instead, the candidate should recognize the cluster of cues suggesting worsening respiratory status.
The reasoning process may involve:
Recognize cues: Identify the abnormal respiratory findings.
Analyze cues: Determine that the findings may indicate deteriorating oxygenation.
Prioritize: Recognize that airway and breathing concerns require immediate attention.
Generate solutions: Consider appropriate nursing interventions within scope.
Take action: Implement the highest-priority appropriate intervention.
Evaluate outcomes: Determine whether the client’s respiratory status improves.
These steps help demonstrate why clinical judgment cannot be adequately developed by memorizing isolated facts.
NGN and case studies
Next Generation NCLEX (NGN) refers to the examination methodology developed to more effectively assess clinical judgment. It does not mean that candidates take a completely separate examination from the NCLEX-PN. Rather, NGN methodology incorporates item formats and clinical scenarios designed to assess how candidates use information to make nursing decisions.
Case studies are particularly useful because they can present information that unfolds over time. Instead of receiving a single isolated question, the candidate may encounter a client situation containing assessment findings, laboratory information, vital signs, medication information, or other relevant data.
The candidate must determine which information matters and how the client’s condition should influence nursing action.
For example:
Initial situation: A client reports weakness and dizziness.
Additional information: The client has poor oral intake, orthostatic changes, and reduced urine output.
Further development: The client becomes increasingly confused and has a rapid pulse.
The candidate must recognize that the significance of the information changes as additional cues appear. The ability to identify relationships among findings is central to clinical judgment.
How to prepare for NGN items
Preparation for NGN should not consist of memorizing specific NGN question formats. Instead, preparation should develop the reasoning abilities that those formats are intended to assess.
An effective NCLEX review should include practice with:
identifying relevant versus irrelevant cues;
distinguishing expected from unexpected findings;
recognizing changes in client condition;
prioritizing nursing problems;
selecting appropriate interventions;
evaluating client responses;
interpreting information presented in tables or clinical records;
connecting multiple pieces of information; and
explaining why an intervention is appropriate.
Candidates should also become comfortable reading a scenario carefully before immediately selecting an answer.
For instance, when presented with five assessment findings, it may be tempting to focus on the most dramatic one. Clinical judgment requires determining whether that finding is actually the highest priority.
A client reporting pain of 8/10 may require intervention, but if the same client has new-onset difficulty breathing and falling oxygen saturation, the respiratory findings may represent the more urgent concern. The question is therefore testing prioritization, not simply pain management knowledge.
The role of computer adaptive testing
Computer adaptive testing is another fundamental feature that should be understood before test day. In CAT, the examination adapts to the candidate’s demonstrated ability as responses are provided. NCSBN explains CAT as part of the NCLEX examination system and describes how the examination uses psychometric methods to support a defensible assessment of candidate ability.
A simplified example helps illustrate the concept.
Suppose a candidate answers an item correctly. The next item may be selected at a difficulty level appropriate for the updated estimate of that candidate’s ability. If the candidate answers another item correctly, the examination may continue presenting questions that provide additional information about the candidate’s ability.
The process does not mean:
“One wrong answer means you fail.”
Nor does it mean:
“Difficult questions mean you are guaranteed to pass.”
Instead, the system considers the overall response pattern and the relationship between the candidate’s estimated ability and the established passing standard.
This is why candidates should avoid trying to determine their performance from the difficulty of individual items.
Why CAT changes test-taking behavior
Understanding CAT can improve test-taking behavior because it discourages several counterproductive habits.
A candidate should not:
deliberately answer incorrectly to try to manipulate difficulty;
assume that an easy question means poor performance;
panic after missing a difficult question;
spend excessive time trying to determine whether the examination is “getting harder”;
change a reasonable answer solely because the previous question was difficult; or
compare the sequence of questions with another candidate’s experience.
Each question should be treated as an individual opportunity to demonstrate nursing competence.
A strong approach is to read the question carefully, identify what is being asked, consider the client’s immediate needs, eliminate clearly inappropriate responses, select the best-supported answer, and then move forward.
The relationship between NGN and CAT
NGN and CAT describe different aspects of the examination and should not be treated as interchangeable terms.
NGN primarily concerns how the examination assesses clinical judgment through appropriate item formats and scenarios.
CAT concerns how the computerized examination selects and administers items based on the candidate’s demonstrated ability.
A candidate can therefore encounter an NGN-style item within a CAT examination.
This distinction matters because an NCLEX study plan should prepare for both dimensions:
Clinical judgment preparation — learning how to interpret cues, prioritize problems, generate appropriate solutions, take action, and evaluate outcomes.
Adaptive testing preparation — becoming comfortable answering questions independently without attempting to predict what the next question means about performance.
A practical example combining Client Needs, NGN, and CAT
Consider a client with heart failure who reports increasing shortness of breath.
The candidate may need to recognize several cues:
increasing respiratory rate;
decreased oxygen saturation;
new crackles;
increasing peripheral edema;
recent weight gain; and
difficulty lying flat.
The Client Needs framework provides the nursing context. Physiological integrity and safety are relevant because the client may be experiencing deterioration.
Clinical judgment requires recognizing that the collection of findings is more important than any single finding.
An NGN-style case may provide these findings progressively and ask the candidate to identify important cues, determine priorities, select appropriate interventions, and evaluate the client’s response.
CAT then determines which subsequent item is presented based on the candidate’s demonstrated ability.
This example demonstrates why a comprehensive NCLEX preparation approach must go beyond memorizing disease definitions. The candidate needs foundational knowledge, assessment skills, prioritization, clinical reasoning, and familiarity with different question presentations.
What this means for an NCLEX-PN Study Plan
Understanding the examination should directly influence the structure of an NCLEX-PN Study Plan.
A balanced preparation process should include:
Test-plan review: Understand the Client Needs categories and major subcategories.
Content review: Strengthen essential nursing knowledge in areas where understanding is weak.
Clinical judgment practice: Regularly analyze client situations rather than studying only isolated facts.
NGN exposure: Practice case studies and different item formats.
NCLEX practice questions: Complete questions consistently rather than waiting until the final week.
Rationale review: Study why each option is correct or incorrect.
Remediation: Return to the underlying content when repeated errors reveal a knowledge gap.
Adaptive-test preparation: Become comfortable with uncertainty and avoid interpreting question difficulty as a direct indicator of performance.
The most useful preparation does not treat the NCLEX-PN test plan, NGN, clinical judgment, and CAT as unrelated subjects. They describe different parts of the same examination experience. The test plan establishes what competencies are important; clinical judgment describes a major way nursing decision-making is assessed; NGN provides formats and scenarios that can measure that judgment; and CAT determines how the computerized examination adapts to the candidate’s demonstrated ability.
For this reason, a candidate preparing for the 2026 NCLEX-PN should approach the examination as an assessment of safe entry-level nursing practice rather than as a test of pure memorization. Strong preparation combines knowledge with application, prioritization, clinical reasoning, and repeated practice under conditions that resemble the cognitive demands of the actual examination.
Building Your NCLEX-PN Study Plan
Building an effective NCLEX-PN Study Plan requires more than choosing a review book and assigning a few hours to study each day. A useful plan should answer several practical questions: What does the candidate already know? Which areas require remediation? How much study time is realistically available? What should be studied first? How many practice questions should be completed? How will progress be measured? When should the plan be adjusted?
The most effective approach is to treat preparation as a structured learning process rather than a fixed list of tasks. The candidate begins by establishing a baseline, identifies strengths and weaknesses, organizes available time, sets measurable goals, practices applying knowledge, and regularly evaluates progress. This creates a personalized study system in which study activities are based on actual needs rather than assumptions.
The 2026 NCLEX-PN test plan provides the framework for the examination, but it does not prescribe one universal study schedule for every candidate. NCSBN describes the test plan as a guide to the content and scope of the examination and emphasizes the knowledge, skills, abilities, and clinical judgment required for safe entry-level LPN/VN practice. Therefore, an effective NCLEX study plan should use the official test plan as its foundation while adapting the amount, sequence, and intensity of preparation to the individual’s circumstances.
Assessing your readiness and identifying weak areas
Before beginning an intensive NCLEX prep program, it is useful to determine the starting point. Readiness assessment provides a baseline against which improvement can be measured and prevents the candidate from spending most of the available study time reviewing material that is already well understood.
Readiness is not determined by one practice test score. A candidate may perform well in one content area while having substantial weaknesses in another. Similarly, someone may recognize a correct answer but be unable to explain the underlying nursing principle. The purpose of an initial assessment is therefore to identify patterns, not simply produce a percentage.
A useful readiness assessment can examine five areas:
Content knowledge
Clinical judgment
Question-solving ability
Test-taking behavior
Consistency and study readiness
1. Evaluate current nursing knowledge
Begin by reviewing major content areas represented in the current NCLEX-PN framework. The 2026 test plan organizes the examination around Client Needs and incorporates concepts such as clinical judgment, communication and documentation, caring, teaching and learning, culture and spirituality, and clinical problem solving throughout the framework.
The purpose at this stage is not to reread an entire nursing program. Instead, determine where knowledge is strong, moderate, or weak.
For example, a candidate might discover:
Area
Current confidence
Initial finding
Basic care and comfort
High
Strong foundation
Pharmacology
Low
Major review needed
Psychosocial integrity
Moderate
Targeted review
Physiological integrity
Moderate
Several weak systems
Health promotion
High
Maintenance review
Clinical judgment
Low
Needs regular practice
This information immediately makes the study plan more efficient.
Someone who already understands basic infection prevention does not necessarily need several days of intensive review on that subject. Those hours may be better spent on medication safety, fluid and electrolyte concepts, or other areas where errors occur repeatedly.
2. Use a diagnostic practice test
A diagnostic NCLEX practice examination can provide additional information about readiness. It should be long enough to reveal patterns but should not be interpreted as a prediction of the actual examination result.
When completing diagnostic practice questions, record more than whether the answer was right or wrong. For each question, consider:
Did I know the content?
Did I misunderstand the question?
Did I miss an important cue?
Did I choose an unsafe intervention?
Did I struggle with prioritization?
Did I change a correct answer unnecessarily?
Did I guess?
Did I understand the rationale after reviewing it?
This distinction is critical.
Suppose a candidate answers 70 out of 100 questions correctly. That number alone does not explain the candidate’s performance. If 20 of the incorrect answers resulted from unfamiliar pharmacology concepts, the remediation strategy should emphasize pharmacology. If 20 resulted from misreading questions or failing to prioritize, the solution should include more test-taking and clinical reasoning practice.
3. Separate knowledge gaps from reasoning gaps
One of the most important parts of an NCLEX-PN Study Plan is distinguishing between a content gap and an application gap.
A content gap occurs when the candidate does not know the underlying information.
For example:
A candidate does not know which assessment finding is associated with hypoglycemia.
The appropriate response is content review.
An application gap occurs when the candidate knows the relevant information but cannot determine how to use it in a client situation.
For example:
The candidate knows the manifestations of hypoglycemia but cannot determine which finding requires the most immediate nursing intervention when several client findings are presented.
The solution is not necessarily another chapter of reading. The candidate may need more NCLEX practice questions, prioritization exercises, and clinical scenarios.
This distinction prevents inefficient preparation. Reading more information cannot fully correct a reasoning problem, just as answering hundreds of questions cannot completely correct a fundamental knowledge deficit.
4. Identify high-risk weaknesses
After the initial assessment, categorize weaknesses according to urgency.
Priority weaknesses are areas that are both poorly understood and clinically important. These deserve early attention.
Moderate weaknesses are areas in which the candidate understands the general concept but frequently makes errors.
Maintenance areas are topics that are well understood and only require periodic review.
For example:
Priority
medication administration principles;
fluid and electrolyte imbalances;
deterioration and prioritization;
safety and infection prevention.
Moderate
maternal-newborn complications;
psychosocial concepts;
selected pediatric conditions.
Maintenance
basic vital-sign concepts;
standard precautions;
commonly understood fundamentals.
This creates a more personalized NCLEX approach than dividing study time equally among every nursing subject.
5. Consider time since nursing school
Readiness is also influenced by how recently core nursing content was studied. Someone who has recently completed a nursing program may remember foundational concepts more readily than someone who has been away from formal study for an extended period.
A recent graduate may therefore spend more time on application and practice, whereas another candidate may initially require more comprehensive review.
Neither approach is automatically better. The appropriate level of review depends on the starting point.
6. Assess study readiness realistically
Preparation should also account for practical circumstances.
Consider:
employment;
family responsibilities;
commuting;
other academic obligations;
preferred study hours;
concentration span;
access to study materials;
planned test date;
sleep schedule; and
previous examination experience.
A candidate who can consistently study three focused hours per day may progress more effectively than someone who schedules eight hours but rarely completes them.
The objective is therefore not to create the most demanding schedule. It is to create a schedule that can be followed consistently.
Creating your study schedule and study calendar
Once readiness and weaknesses have been identified, the next step is converting those findings into a practical study schedule and study calendar.
A schedule establishes when and how long preparation will occur. A calendar provides a broader view of what should be completed over several days or weeks.
The two should work together.
For example:
Study calendar: Week 1 → foundational review and major Client Needs areas
This distinction makes preparation easier to manage because the calendar provides direction while the daily schedule provides specific actions.
Start with the examination date
If an examination date has already been scheduled, work backward from the test date.
For example, if six weeks are available, the calendar can be divided into:
Week 1: baseline assessment and foundational weaknesses;
Week 2: major physiological concepts;
Week 3: pharmacology and medication safety;
Week 4: clinical judgment and case-based practice;
Week 5: mixed NCLEX practice and targeted remediation;
Week 6: final review and examination readiness.
This does not mean every candidate should use a six-week plan. The appropriate duration depends on readiness, available study time, and the extent of content gaps.
A candidate who has substantial weaknesses may need a longer preparation period. Another candidate with strong recent nursing knowledge may require a shorter period of focused review.
Build the calendar around priorities
A common mistake is assigning equal amounts of time to every topic.
Instead, distribute study time according to need.
For example:
Study need
Suggested emphasis
Major weakness
Frequent focused review
Moderate weakness
Regular targeted practice
Strong area
Periodic maintenance
Clinical judgment
Consistent practice throughout preparation
Mixed questions
Increasing frequency as exam approaches
This prevents the calendar from becoming a simple reading checklist.
The NCLEX-PN test plan should remain the reference point for identifying the scope of content, while diagnostic performance determines where additional emphasis is needed. NCSBN specifically describes the test plan as a resource for candidate preparation as well as examination development.
Avoid creating an unrealistic study schedule
An ambitious calendar can look impressive but become counterproductive if it cannot be maintained.
For example, scheduling:
6:00 a.m.–8:00 a.m. pharmacology;
9:00 a.m.–12:00 p.m. medical-surgical review;
1:00 p.m.–3:00 p.m. pediatrics;
4:00 p.m.–6:00 p.m. practice questions; and
7:00 p.m.–9:00 p.m. remediation
may appear intensive, but maintaining nine or ten hours of highly focused study every day is unrealistic for many people.
A more sustainable schedule might involve two or three focused study sessions separated by meaningful breaks.
For example:
Morning: 90 minutes of content review
Afternoon: 60 minutes of practice questions
Evening: 45 minutes reviewing rationales and weak concepts
This creates focused learning without requiring every waking hour to be devoted to preparation.
Use active study blocks
Each study session should have a defined purpose.
Instead of:
“Study pharmacology.”
Use:
“Review antihypertensive medication classes, complete 30 related questions, analyze rationales, and record recurring errors.”
The second objective is measurable.
A useful study block can contain four stages:
Learn — review the concept.
Apply — answer questions or work through a scenario.
Analyze — examine rationales and mistakes.
Record — document what requires further review.
This structure transforms passive reading into an active learning process.
Include flexibility in the study calendar
A good study calendar should contain some flexibility. Unexpected work, family responsibilities, fatigue, or other events can interfere with preparation.
Instead of abandoning the entire calendar after missing one study session, move the unfinished activity to a designated recovery period.
For example:
Monday: Pharmacology Tuesday: Physiological integrity Wednesday: Health promotion Thursday: Pharmacology remediation Friday: Mixed practice Saturday: Catch-up and review Sunday: Rest or light review
The catch-up period provides flexibility without forcing the candidate to compress several missed activities into one exhausting day.
Plan progression rather than repetition
The calendar should change as preparation progresses.
Early preparation may emphasize:
content review;
foundational concepts;
identification of weaknesses; and
shorter question sets.
Middle preparation may emphasize:
mixed NCLEX practice;
application;
pharmacology;
case studies;
clinical judgment; and
targeted remediation.
Later preparation may emphasize:
full-length practice;
mixed content;
question endurance;
review of recurring errors;
examination logistics; and
maintaining confidence without introducing large amounts of unfamiliar material.
This progression prevents the candidate from using the same study method throughout the entire NCLEX preparation period.
Setting daily study goals and practice questions
Daily goals convert the larger NCLEX-PN Study Plan into manageable actions. Without specific goals, “studying for the NCLEX” can become an indefinite activity in which a candidate spends hours reading without knowing whether meaningful progress occurred.
Effective daily goals should be specific, measurable, realistic, relevant, and time-bound.
For example:
Review diabetes mellitus and insulin safety for 75 minutes, complete 35 related NCLEX practice questions, review every rationale, and record three concepts requiring additional study.
This is substantially more useful than:
Study diabetes today.
Establish realistic questions-per-day targets
There is no universal number of practice questions that guarantees NCLEX success. The appropriate number depends on available time, knowledge level, and how thoroughly the rationales are reviewed.
A candidate might begin with:
20–30 questions per day during intensive content review;
40–60 questions per day during the application phase; and
larger mixed sets as the examination approaches.
These figures should be treated as examples rather than requirements.
Quality matters as much as quantity.
Completing 100 questions without reviewing the reasoning behind the answers may provide less educational value than completing 40 questions and carefully analyzing the rationales.
Use questions as learning tools
NCLEX practice questions should not be treated solely as a score-producing activity.
After each question, ask:
What was the question actually asking?
What information was most important?
Which findings were relevant?
What nursing principle applied?
Why was the selected response appropriate?
Why were the other options less appropriate?
Did I answer correctly because I understood the concept or because I guessed?
What should I review if I missed the question?
This turns every practice item into a short learning exercise.
For example, suppose a question asks which client should be assessed first. A candidate chooses incorrectly.
Simply recording “wrong” provides little value.
A better analysis might reveal:
“I recognized all four conditions but failed to prioritize a client with a potential airway problem over clients with less immediate concerns.”
That identifies a clinical reasoning weakness that can be addressed in future test questions.
Track errors systematically
An error log can become one of the most valuable components of an NCLEX study plan.
A simple format might include:
Question topic
Error type
What went wrong?
Remediation
Insulin
Content
Confused onset and duration
Review insulin classifications
Postoperative care
Priority
Chose pain before airway concern
Practice prioritization
Delegation
Scope
Assigned an inappropriate task
Review delegation principles
Heart failure
Interpretation
Missed worsening cues
Review assessment findings
This approach allows the candidate to see recurring patterns.
If five separate questions are missed because of delegation, the problem is not five unrelated questions. There may be one underlying knowledge gap.
Likewise, if errors repeatedly involve selecting the first nursing action, the candidate may need additional practice with prioritization rather than more general content reading.
Combine focused and mixed practice
During early preparation, focused questions can help reinforce a specific topic.
Mixed practice requires the candidate to determine which nursing concept applies without being told the topic in advance.
That distinction is important because the actual NCLEX exam does not necessarily announce the subject before every question.
Increase question complexity gradually
A strong progression can move from:
Level 1: Recall
Identify a medication class.
Recognize a normal finding.
Identify a basic nursing principle.
Level 2: Application
Apply the concept to a client situation.
Determine an appropriate intervention.
Interpret assessment findings.
Level 3: Clinical judgment
Analyze multiple cues.
Determine the priority concern.
Select an appropriate response.
Evaluate whether the intervention worked.
This progression helps develop the reasoning expected in contemporary NCLEX preparation. The 2026 NCLEX-PN Test Plan states that its activity statements require application of fundamental principles of clinical decision-making and critical thinking, reinforcing the importance of moving beyond simple factual recall.
Set goals for understanding, not just completion
A candidate should avoid defining success as:
“I completed 200 questions.”
A stronger goal is:
“I completed 60 questions, understood the rationales, identified two recurring weaknesses, and demonstrated improvement on previously missed concepts.”
The number of completed questions is useful, but it is only one measure of progress.
Other useful measures include:
percentage correct over time;
performance by content area;
number of repeated errors;
ability to explain rationales;
performance on mixed questions;
ability to recognize important cues;
confidence in prioritization;
speed without sacrificing accuracy; and
performance under longer testing conditions.
Adjust daily goals according to performance
A personalized study approach means that daily goals can change.
Suppose a candidate planned to spend two hours reviewing cardiovascular disorders but discovers after 20 questions that the major weakness is actually medication safety.
The plan should be adjusted.
Similarly, if a candidate consistently performs strongly in a topic, continuing to spend several hours there may have diminishing educational value.
This creates a feedback loop:
Study → Practice → Analyze → Identify weakness → Remediate → Practice again
The process keeps the NCLEX study schedule responsive to actual performance.
Protect the quality of study time
Daily preparation should also recognize the importance of concentration and recovery.
Long periods of distracted study can create the appearance of productivity without producing meaningful learning. A focused 60-minute session may be more productive than several hours of intermittent reading, social media use, or multitasking.
Practical strategies include:
keeping the phone away during focused sessions;
using predetermined study blocks;
taking short breaks;
studying in a consistent environment;
setting one primary objective per session;
avoiding unnecessary switching between resources; and
ending the session by identifying what should be done next.
Rest is also part of an effective study plan. Consistent sleep and reasonable breaks help prevent preparation from becoming a cycle of exhaustion and reduced concentration.
Complete 35 medication-related NCLEX practice questions.
Mark questions answered with uncertainty.
Study session 3 — Rationales
Review all 35 rationales.
Revisit every incorrect response.
Identify whether each error was caused by knowledge, interpretation, prioritization, or test-taking.
Study session 4 — Remediation
Review the two weakest concepts.
Complete 10–15 additional questions targeting those weaknesses.
End-of-day check
What improved?
What remains weak?
What should be reviewed tomorrow?
Did the planned study time actually occur?
This approach makes each day part of a larger learning cycle rather than an isolated study session.
A well-constructed NCLEX-PN Study Plan should therefore be flexible enough to change when performance reveals new information. The purpose of the schedule is not to force the candidate through a predetermined sequence regardless of results. It is to provide structure while allowing preparation to respond to demonstrated strengths and weaknesses.
The strongest NCLEX preparation combines a realistic calendar, measurable daily goals, purposeful practice questions, careful rationale analysis, and continuous remediation. Rather than measuring progress solely by the number of hours studied or questions completed, the candidate should look for evidence of deeper improvement: stronger content knowledge, fewer recurring errors, better interpretation of client information, more consistent prioritization, and greater ability to apply nursing principles to unfamiliar situations.
NCLEX-PN Content Review
Effective NCLEX-PN content review requires more than attempting to memorize every disease, medication, procedure, and nursing intervention encountered during nursing school. The purpose of review is to develop a sufficiently strong nursing knowledge base to recognize clinically significant findings, understand expected and unexpected responses, identify risks, select appropriate interventions, and provide safe client care.
The 2026 NCLEX-PN test plan organizes examination content through Client Needs categories and integrates processes such as clinical judgment, communication, teaching and learning, caring, and clinical problem solving throughout the examination. This means that content should not be studied as disconnected lists. A candidate should learn each topic in a way that makes it possible to apply the information to an actual client situation. The official test plan is therefore an important reference when determining the scope of an NCLEX review.
A useful content-review process asks several questions about every major topic:
What is the condition, concept, or medication?
Why does it occur or why is it used?
What findings should the nurse expect?
Which findings are abnormal or concerning?
What assessments are important?
What nursing interventions are appropriate?
What complications should be anticipated?
What teaching should the client receive?
Which findings require immediate action or notification?
How could this information appear in an NCLEX question or clinical scenario?
For example, studying heart failure should involve more than memorizing its definition. The candidate should understand common manifestations, fluid retention, respiratory changes, relevant assessment findings, medication considerations, client teaching, monitoring requirements, and signs of deterioration. That knowledge can then be applied to questions asking which client should be assessed first, which finding requires follow-up, or whether an intervention was effective.
This approach turns content review into preparation for nursing decision-making rather than simple information recall.
Management of Care and Physiological Integrity
Management of Care and Physiological Integrity encompass many of the practical responsibilities and clinical concepts that candidates must understand when preparing for the NCLEX-PN. These areas require candidates to connect nursing knowledge with safe client care, assessment, intervention, monitoring, and evaluation.
Management of Care focuses heavily on the organization and coordination of nursing care. Physiological Integrity addresses the client’s physical health and the nursing care required to maintain or restore physiological function.
Management of Care
When reviewing Management of Care, candidates should concentrate on concepts that influence whether care is provided safely, appropriately, and within the practical/vocational nurse’s role.
Important areas for review include:
prioritization;
delegation and assignment;
supervision;
continuity of care;
client rights;
informed consent;
confidentiality;
advance directives;
incident reporting;
documentation;
interdisciplinary communication;
safety;
infection prevention;
discharge planning; and
coordination of client care.
These subjects frequently require application rather than memorization.
For example, consider a nurse caring for four clients:
one client reports sudden difficulty breathing;
one client requires assistance with bathing;
one client requests scheduled pain medication;
one stable client needs discharge instructions.
The candidate must determine which need requires immediate attention. The question is not simply asking which task is important. It is asking the candidate to establish a priority based on the client’s condition and potential risk.
A useful prioritization framework includes consideration of:
This does not mean every question can be solved by applying a single rigid hierarchy. The candidate must consider the complete clinical situation. However, recognizing threats to life, rapid changes in condition, and safety risks is essential.
Delegation and scope of practice
Delegation is another important component of NCLEX preparation. Candidates should understand that assigning a task is not simply a matter of deciding who has enough time to perform it.
When reviewing delegation, consider:
the client’s stability;
predictability of the outcome;
complexity of the task;
required assessment or judgment;
the education and competence of the person receiving the assignment;
applicable regulations and institutional policies; and
the responsibility of the nurse who delegates.
For example, a stable client may require assistance with routine hygiene, while another client may require assessment because of a new change in condition. The candidate must distinguish between routine, predictable activities and responsibilities requiring nursing judgment.
Because actual scope of practice can vary according to jurisdiction, the board of nursing and applicable state regulations remain important references for real-world practice. For NCLEX purposes, however, candidates should focus on the entry-level practical/vocational nursing responsibilities represented by the examination’s framework.
Documentation and communication
Documentation should also be studied as a clinical-safety issue rather than merely a clerical responsibility.
A strong review should include:
accurate documentation;
objective descriptions;
timely charting;
appropriate reporting of changes in condition;
communication with members of the healthcare team;
protection of confidential information; and
documentation of nursing interventions and client responses.
For example, documentation stating:
“Client seems bad.”
is vague and does not communicate useful clinical information.
A more useful entry would describe observable findings, such as changes in respiratory effort, vital signs, level of responsiveness, pain, or other relevant assessment findings.
Candidates should understand that documentation communicates what was assessed, what was observed, what was done, and how the client responded.
Physiological Integrity
Physiological Integrity covers a broad range of physical care concepts. A strong NCLEX-PN Study Plan should therefore organize this material into manageable clinical categories rather than attempting to memorize isolated facts.
Useful areas include:
basic physiological adaptation;
pharmacological and parenteral therapies;
reduction of risk potential;
physiological adaptation to illness;
fluid and electrolyte balance;
nutrition;
elimination;
mobility;
respiratory care;
cardiovascular conditions;
neurological conditions;
endocrine disorders;
gastrointestinal disorders;
renal and urinary conditions;
musculoskeletal conditions;
reproductive health;
wound care;
pain management; and
postoperative care.
The candidate should study these topics through the perspective of nursing care.
For example, when reviewing pneumonia, consider:
Assessment
respiratory rate;
oxygen saturation;
breath sounds;
temperature;
work of breathing;
mental status; and
relevant secretions or cough.
Potential concerns
impaired oxygenation;
respiratory deterioration;
dehydration;
infection-related complications.
Nursing care
appropriate positioning;
monitoring respiratory status;
administering prescribed therapies;
encouraging appropriate hydration when indicated;
promoting pulmonary hygiene as appropriate; and
reporting deterioration.
Evaluation
Is oxygenation improving?
Is respiratory effort decreasing?
Is the client becoming more alert?
Are other signs of deterioration developing?
This method transforms a disease topic into a practical nursing framework.
Review body systems systematically
A body system approach can make Physiological Integrity easier to organize.
For each system, review:
normal function;
common disorders;
expected manifestations;
dangerous or unexpected findings;
common treatments;
nursing assessments;
nursing interventions;
medication considerations;
client education; and
complications.
For example, cardiovascular review might include hypertension, heart failure, myocardial infarction, dysrhythmias, peripheral vascular conditions, and shock. Respiratory review might include asthma, COPD, pneumonia, pulmonary embolism, respiratory failure, and oxygen therapy.
The objective is not to memorize every possible disease. It is to recognize patterns and understand how the nurse should respond when those patterns appear in an NCLEX question.
Prioritize deterioration
A particularly important part of Physiological Integrity review is learning to recognize deterioration.
A client who changes from:
alert to confused;
stable to hypotensive;
comfortably breathing to experiencing respiratory distress; or
adequately perfused to showing signs of poor circulation
may require immediate reassessment and intervention.
For example, a postoperative client with increasing pain should be assessed appropriately, but a postoperative client with sudden dyspnea, tachycardia, and declining oxygen saturation presents a potentially more urgent situation.
This type of reasoning connects physiological knowledge with clinical judgment.
Pharmacology and medication safety
Pharmacology is one of the most extensive areas of nursing content, and it can become overwhelming when candidates attempt to memorize individual medications without understanding medication classes and nursing responsibilities.
A more effective NCLEX review organizes pharmacology around medication classes, mechanisms, therapeutic effects, adverse effects, precautions, interactions, monitoring, and client teaching.
For each medication or medication class, ask:
What is the medication used for?
How does it work at a basic level?
What therapeutic effect should occur?
What common adverse effects may occur?
Which adverse effects are potentially serious?
What assessment should occur before administration?
What laboratory values may require monitoring?
What interactions or precautions are important?
What client teaching is necessary?
What finding should cause the nurse to withhold, question, or report the medication according to the clinical situation and applicable orders/protocols?
Study medication classes rather than isolated names
Instead of memorizing hundreds of individual drug names independently, group medications into classes.
For example:
Antihypertensives
ACE inhibitors;
angiotensin receptor blockers;
beta blockers;
calcium channel blockers;
diuretics.
Anticoagulants and antiplatelet agents
medications affecting coagulation;
medications affecting platelet aggregation.
Antidiabetic medications
insulin preparations;
non-insulin glucose-lowering medications.
Antibiotics
major antimicrobial classes;
common adverse effects;
allergy considerations;
appropriate monitoring.
The purpose of classification is to help the candidate recognize patterns.
If a question presents an unfamiliar medication from a familiar class, understanding the class may provide useful clues about its purpose, precautions, and nursing considerations.
Know the nursing implications
Medication questions often test nursing responsibilities rather than simply asking what a drug treats.
For example, suppose a question concerns an antihypertensive medication. The candidate may need to recognize that assessment of blood pressure is relevant, identify symptoms associated with excessive blood-pressure reduction, or determine which client statement indicates a need for further teaching.
Therefore, pharmacology review should consistently connect:
This sequence is more useful than memorizing a medication name and one indication.
High-yield medication concepts
An effective NCLEX prep program should pay particular attention to medication safety concepts such as:
medication rights;
allergy verification;
medication reconciliation;
adverse reactions;
therapeutic effects;
contraindications and precautions;
drug interactions;
laboratory monitoring;
high-alert medications;
insulin safety;
anticoagulant safety;
opioid safety;
electrolyte replacement;
intravenous medication considerations;
medication administration routes;
client education; and
appropriate reporting of unexpected responses.
Candidates should also understand that a medication can produce both expected therapeutic effects and potentially dangerous adverse effects.
For example, a medication intended to lower blood pressure may produce excessive hypotension. The nurse therefore needs to know not only that the medication lowers blood pressure but also what assessment findings may indicate that the response has become unsafe.
Pharmacology through clinical scenarios
Consider a client receiving insulin who becomes sweaty, shaky, confused, and weak.
The candidate should recognize the pattern rather than focusing on one symptom.
The reasoning process might be:
Identify the acute change.
Connect the findings with glucose regulation.
Recognize the possibility of hypoglycemia.
Determine the immediate nursing priority based on the client’s condition.
Implement the appropriate intervention according to the clinical situation.
Reassess the client.
This is more representative of NCLEX practice than simply answering:
“Which medication is insulin?”
Medication calculations
Medication calculations should be practiced separately from pharmacology memorization. Candidates should be comfortable working with the types of calculations included in their approved study materials, while also paying attention to units, decimal placement, dosage forms, and safe administration principles.
The emphasis should always be on accurate calculation and safe medication administration rather than speed alone.
A candidate who repeatedly makes calculation errors should identify the source of the error. For example, the problem may involve:
unit conversion;
formula setup;
decimal placement;
reading the medication label;
interpreting the prescribed dose; or
arithmetic.
The specific weakness should determine the remediation strategy.
Medication teaching
Client teaching is another important pharmacology component.
Candidates should be able to recognize questions involving:
when and how a medication should be taken;
precautions;
expected effects;
important adverse effects;
adherence;
interactions;
dietary considerations when applicable;
safety precautions; and
when to contact a healthcare professional.
For example, if a client begins a medication and reports a potentially serious adverse reaction, the appropriate nursing response may be very different from the response to a mild, expected effect.
This is why memorizing lists of side effects is insufficient. Candidates need to distinguish common and expected effects from findings that may require immediate attention.
Avoid pharmacology overload
Pharmacology can consume an excessive amount of study time if candidates attempt to memorize every drug individually.
A more efficient method is to prioritize:
medication classes;
prototype medications;
major indications;
major adverse effects;
critical precautions;
nursing assessments;
important monitoring;
client teaching; and
medications or classes that repeatedly appear as weaknesses during practice.
This provides a framework for expanding knowledge without allowing pharmacology to overwhelm the entire NCLEX-PN Study Plan.
Health promotion, psychosocial integrity, and basic care
Preparation should also include areas that are sometimes underestimated because they may appear less technically complex than pharmacology or medical-surgical nursing. Health promotion, psychosocial integrity, and basic care involve essential nursing responsibilities and require candidates to understand normal development, emotional needs, safety, communication, nutrition, mobility, hygiene, comfort, and client education.
Health promotion and maintenance
Health promotion focuses on maintaining health, preventing illness, recognizing developmental needs, and supporting appropriate health behaviors.
Content review may include:
developmental stages;
growth and development;
nutrition;
immunization concepts;
screening;
preventive care;
reproductive health;
prenatal care;
newborn care;
pediatric development;
adult health maintenance;
older-adult considerations;
health education; and
risk reduction.
Candidates should learn to distinguish normal developmental findings from findings that may indicate a problem.
For example, an infant, adolescent, adult, and older adult will not have identical developmental expectations. A question may therefore require the candidate to determine whether a behavior is appropriate for a particular developmental stage.
The important skill is not simply memorizing an age-related fact. The candidate should understand the broader developmental pattern so that unfamiliar scenarios can be interpreted appropriately.
Client education
Teaching should be incorporated into health-promotion review rather than treated as a separate memorization exercise.
A strong review should consider:
readiness to learn;
health literacy;
language needs;
cultural considerations;
appropriate teaching methods;
client understanding;
teach-back;
barriers to learning;
family involvement when appropriate; and
evaluation of learning.
For example, if a client is being taught how to perform a procedure at home, simply providing written instructions does not establish that the client understands the procedure.
The nurse may need to ask the client to demonstrate or explain the process. This provides evidence of learning and allows misunderstandings to be corrected.
Psychosocial Integrity
Psychosocial content requires candidates to understand how emotional, behavioral, social, and psychological factors influence client health.
Important areas include:
anxiety;
depression;
grief and loss;
coping;
stress;
therapeutic communication;
substance-use concerns;
mental-health disorders;
crisis situations;
abuse and neglect;
behavioral changes;
self-esteem;
social support;
end-of-life concerns; and
client dignity.
A major focus should be therapeutic communication.
Candidates should recognize responses that encourage communication and those that can shut it down.
For example, consider a client who says:
“I am scared about what is going to happen.”
A therapeutic response would encourage the client to express concerns rather than immediately dismissing the fear or changing the subject.
Responses that minimize the client’s feelings, provide false reassurance, or shift attention away from the client’s concern may be less appropriate.
Questions may also test whether the nurse recognizes when safety concerns require immediate action, particularly when a client expresses thoughts of self-harm, experiences severe behavioral changes, or demonstrates an inability to maintain personal safety.
Basic care and comfort
Basic care is foundational nursing knowledge and should not be neglected simply because it may seem familiar.
Important areas include:
hygiene;
nutrition;
hydration;
elimination;
mobility;
positioning;
sleep and rest;
pain and comfort;
skin integrity;
pressure injury prevention;
assistive devices;
activities of daily living;
specimen collection; and
safety measures.
Candidates should understand not only what intervention is performed but why it is performed.
For example, repositioning an immobile client is not simply a routine task. It may help reduce pressure, support comfort, promote mobility, and reduce complications associated with prolonged immobility.
Likewise, assisting a client with ambulation requires consideration of safety, strength, balance, prescribed activity restrictions, assistive devices, and fall risk.
Nutrition and hydration
Nutrition and hydration should be studied from both normal and disease-related perspectives.
Review should include:
basic nutrient requirements;
hydration;
nutritional assessment;
therapeutic diets;
enteral nutrition;
aspiration precautions;
feeding assistance;
signs of dehydration;
electrolyte-related concerns; and
nutritional teaching.
For example, a client with difficulty swallowing may require specific precautions to reduce aspiration risk. The candidate should recognize that the appropriate intervention depends on the client’s condition and prescribed plan of care.
Questions may present nutritional information indirectly through findings such as weight changes, laboratory results, intake and output, swallowing difficulties, or changes in functional ability.
Skin integrity and mobility
Skin integrity should be connected with risk assessment and prevention.
Review concepts such as:
pressure injury risk;
repositioning;
skin assessment;
moisture management;
nutrition;
mobility;
pressure reduction;
wound observation; and
prevention strategies.
Similarly, mobility review should include:
safe transfers;
ambulation;
positioning;
range-of-motion exercises;
use of assistive devices;
fall prevention; and
complications of immobility.
The candidate should understand how these concepts interact.
For example, prolonged immobility can contribute to multiple complications, including impaired skin integrity, reduced mobility, constipation, venous stasis, and respiratory problems. A question may therefore test the candidate’s ability to identify the most important preventive intervention in a particular situation.
Pain and comfort
Pain management should include assessment, intervention, and reassessment.
A useful framework is:
Assess → intervene → reassess → document
Candidates should recognize that pain is influenced by the client’s report and clinical context. They should also understand the importance of evaluating whether an intervention produced the desired effect.
For example, if a client reports severe pain and receives a prescribed intervention, the nurse should not assume that the intervention was effective simply because it was administered. The client’s response must be evaluated.
Integrating the three areas
Health promotion, psychosocial integrity, and basic care should not be studied as unrelated subjects. They frequently overlap in real nursing situations.
Consider an older adult recovering from illness who:
has reduced appetite;
has difficulty walking;
expresses fear about returning home;
requires assistance with personal care; and
has an increased risk of falling.
A comprehensive nursing approach may involve:
nutritional assessment;
mobility and safety assessment;
assistance with activities of daily living;
therapeutic communication;
health teaching;
discharge preparation; and
coordination with other members of the healthcare team.
A candidate who studies each subject separately may know the individual facts. A candidate who understands how the concepts interact is better prepared to apply those facts to an NCLEX question.
How to organize content review efficiently
A comprehensive NCLEX-PN Study Plan should avoid attempting to master every topic simultaneously. Instead, content can be organized into three levels:
High-priority review
topics repeatedly missed;
safety-critical concepts;
major medication principles;
physiological deterioration;
prioritization;
frequently recurring foundational weaknesses.
Targeted review
topics with moderate weaknesses;
conditions that require additional application;
developmental and psychosocial concepts that remain uncertain.
Maintenance review
areas consistently answered correctly;
foundational concepts that require occasional reinforcement.
For every topic, combine three forms of learning:
Knowledge: Understand the nursing concept.
Application: Use the concept in a client situation.
Evaluation: Determine whether the intervention or response was appropriate.
This approach keeps content review closely connected to the practical reasoning required on the examination.
A candidate should also periodically return to previously reviewed material. Forgetting is a normal part of learning, and spaced review can help reinforce information over time. Rather than rereading an entire chapter repeatedly, a candidate can use brief retrieval exercises, flashcards where appropriate, practice questions, concept maps, and targeted remediation.
The most effective content review is therefore selective, active, and connected to nursing practice. Management of Care and Physiological Integrity require strong understanding of safe care, assessment, prioritization, physiological conditions, and nursing interventions. Pharmacology requires knowledge of medications alongside assessment, monitoring, adverse effects, and client teaching. Health promotion, psychosocial integrity, and basic care require attention to prevention, development, communication, emotional needs, comfort, safety, nutrition, mobility, and activities of daily living.
When these areas are studied as interconnected components of nursing practice rather than as isolated lists of facts, preparation becomes more meaningful. The candidate develops a knowledge base that can be retrieved and applied when faced with unfamiliar clients, changing clinical situations, and complex NCLEX practice questions.
NCLEX Practice and Test Prep
Effective NCLEX preparation requires more than reading a study guide from beginning to end. Candidates need repeated opportunities to apply nursing knowledge, interpret clinical information, recognize priorities, and make safe decisions under exam conditions. This is why a strong NCLEX-PN Study Plan should include deliberate practice as well as content review.
For the 2026 NCLEX-PN, preparation should be aligned with the current NCSBN test plan rather than an outdated examination blueprint. The 2026 NCLEX-PN Test Plan is effective from April 1, 2026, through March 31, 2029, and provides information about content categories, examination administration, clinical judgment, and sample items.
Practice should also reflect the way the current NCLEX assesses nursing competence. The official NCLEX preparation materials provide sample questions, PN case studies, an exam preview, and a candidate tutorial to help test takers become familiar with the examination experience.
The purpose of NCLEX practice is therefore not simply to increase the number of questions completed. It is to develop a repeatable process for reading a question, identifying what matters, applying nursing principles, evaluating alternatives, and learning from mistakes.
Using NCLEX practice questions and rationales
NCLEX practice questions are one of the most important components of effective NCLEX prep, but their value depends heavily on how they are used. Completing hundreds or thousands of questions without carefully reviewing the reasoning behind each answer can create the illusion of progress without correcting underlying weaknesses.
A better approach is to treat every NCLEX question as a learning opportunity.
The 2026 NCLEX-PN test plan contains sample items and emphasizes the application of nursing knowledge and clinical decision-making. The official NCLEX website also provides sample item sets and PN case studies designed to familiarize candidates with the types of items used on the examination.
Start with question quality rather than question quantity
A common mistake during NCLEX preparation is to focus exclusively on questions per day. For example, a test taker may decide to complete 150 questions every day but spend little time reviewing the answers.
A more productive study plan might involve:
Completing a manageable set of questions.
Reviewing every rationale.
Identifying why each answer was selected.
Determining why the other options were less appropriate.
Recording important knowledge gaps.
Revisiting missed concepts.
Completing additional questions that test the same concept in a different situation.
For example, a candidate who misses several questions about hypoglycemia should not simply memorize the correct answer from each question. The candidate should review the underlying concept, including expected findings, immediate nursing priorities, treatment principles, reassessment, and client teaching. The goal is to recognize the concept when the question is presented in a completely different form.
Read the question before looking at the options
One useful test-taking habit is to identify what the question is actually asking before becoming distracted by the answer choices.
Ask:
What is the question asking me to identify?
Is it asking for the priority intervention?
Is it asking what the nurse should do first?
Is it asking for an expected finding?
Is it asking which client requires immediate attention?
Is it asking about teaching?
Is it asking which finding requires follow-up?
Is it asking for an appropriate delegation decision?
Is it asking for the best response to a client?
This distinction is important because several options may be clinically reasonable while only one directly answers the question.
For instance, consider a question involving a client with respiratory distress. The question may contain information about oxygen therapy, positioning, vital signs, medication administration, and client education. If it asks what the nurse should do first, the candidate must prioritize the immediate threat rather than select an intervention that may be appropriate later.
Use rationales as a teaching tool
A rationale should explain more than why the selected option is correct. It should help the learner understand the clinical principle being tested.
After answering an NCLEX practice question, review the rationale by asking:
Why is the correct option appropriate?
What client condition makes it appropriate?
Why are the other options less appropriate?
What information in the question influenced the decision?
Was the question testing knowledge, prioritization, safety, delegation, communication, or clinical judgment?
Would the answer change if one important client finding changed?
What broader nursing principle can I take from this question?
This process transforms NCLEX practice questions from simple assessment tools into study materials.
Research in nursing education also supports structured reflection around assessment performance. An exam-wrapper approach, for example, encourages nursing students to examine their study habits, reasons for incorrect answers, and future learning strategies rather than merely looking at their scores.
Analyze both correct and incorrect answers
Do not review only questions that were answered incorrectly.
A correct answer can occur for different reasons:
The concept was fully understood.
The candidate recognized the clinical pattern.
The candidate used sound prioritization.
The candidate eliminated inappropriate options.
The answer was selected through guessing.
These situations are not equivalent.
If a candidate answers a question correctly but cannot explain why, that topic should remain on the review list.
Likewise, an incorrect response can result from different problems:
Reason for the error
What it may indicate
Did not know the fact
Content gap
Misread the question
Reading/test-taking problem
Did not recognize the priority
Clinical judgment gap
Chose a familiar intervention
Reasoning error
Changed a correct answer unnecessarily
Test-taking issue
Could not distinguish similar options
Concept discrimination problem
Knew the content but applied it incorrectly
Application gap
This distinction makes an NCLEX study plan much more personalized.
Maintain an NCLEX error log
An error log can be one of the most useful study materials in an NCLEX review.
A simple format can include:
Question
Topic
Why I missed it
Correct reasoning
Follow-up
1
Respiratory
Missed priority cue
Recognize deterioration first
Review respiratory emergencies
2
Pharmacology
Did not know adverse effect
Connect medication class to risk
Review drug class
3
Delegation
Confused stable and unstable clients
Assignment depends on client needs and scope
Review delegation
4
Infection control
Chose precaution based on diagnosis alone
Match precautions to transmission route
Review isolation principles
Over time, this log reveals patterns that a percentage score cannot show.
For example, a candidate may achieve 72% on a practice test but discover that most errors involve pharmacology and prioritization. Another candidate may also score 72% but have errors distributed across many content areas. These candidates need different NCLEX prep approaches.
Progress from focused to mixed practice
Early in an NCLEX study schedule, focused practice can be useful. A candidate studying pharmacology may complete questions specifically related to medication administration and pharmacological therapies.
Later, questions should become increasingly mixed.
Mixed NCLEX practice forces the learner to determine what knowledge is relevant without being told the subject in advance. This more closely resembles the mental process required during an actual NCLEX test.
A progression might look like:
Focused questions → mixed questions → case studies → timed practice → full-length practice
This progression should occur gradually rather than immediately.
Practice clinical judgment with case studies
Clinical judgment deserves deliberate practice because it is explicitly incorporated into the current NCLEX framework. The 2026 NCLEX-PN test plan includes 18 case-study items and approximately 10% stand-alone items that measure clinical judgment, with the exact examination composition varying according to examination length.
Candidates should therefore practice moving through clinical information rather than treating every question as an isolated fact.
When working through a case study, practice asking:
What cues are present?
Which cues are clinically significant?
How do the cues relate to one another?
Which problems are most concerning?
What hypotheses could explain the findings?
What action is appropriate?
What outcome would indicate that the intervention worked?
The official NCLEX preparation resources include PN case studies specifically intended to help candidates become familiar with these item formats.
Complete Daily NCLEX-PN Study Goal
Practice without immediately checking the answer
It can be tempting to answer a question and immediately look at the rationale. This may provide reassurance but does not necessarily strengthen independent reasoning.
For some practice sessions, complete a defined group of questions before reviewing the answers. This allows the candidate to experience uncertainty and make decisions without immediate feedback.
The exact balance can vary. Immediate feedback can be useful during early learning, while delayed feedback can help candidates determine whether they can independently apply concepts.
The important point is to avoid turning practice into passive answer recognition.
Applying effective NCLEX study strategies
An effective NCLEX study plan should combine active learning, deliberate practice, spaced review, clinical reasoning, and performance analysis. No single study strategy guarantees NCLEX success, and NCSBN does not endorse specific commercial review courses or study materials.
The most useful strategy is therefore one that helps a candidate identify weaknesses, correct them, and demonstrate improvement.
Use active recall instead of passive rereading
Passive reading can create familiarity without demonstrating whether information can actually be retrieved.
Instead of repeatedly reading a section about heart failure, for example, close the book and ask yourself:
What are the major manifestations?
What findings indicate worsening status?
What assessments are important?
What interventions are expected?
What client teaching is necessary?
What complications should concern the nurse?
Which findings require immediate action?
This is active recall because the learner must retrieve information rather than simply recognize it on a page.
The same technique can be used for pharmacology, laboratory values, disease processes, infection prevention, developmental milestones, and emergency interventions.
Study concepts, not isolated facts
NCLEX questions frequently place nursing knowledge inside client situations. Therefore, candidates should understand relationships between concepts.
Instead of memorizing:
“Medication X causes adverse effect Y.”
Ask:
Why does the medication cause Y, what should the nurse assess, which clients are at greater risk, and what action should be taken if Y develops?
This produces knowledge that can transfer across different test questions.
This approach is particularly valuable when preparing for physiological integrity, pharmacology, and clinical judgment.
Use spaced review
A candidate should not study a topic once and assume it is permanently mastered.
A better study schedule revisits important concepts at increasing intervals.
For example:
Day 1: Learn the concept.
Day 2: Brief recall review.
Day 4: Practice related questions.
Day 7: Reassess understanding.
Day 14: Complete mixed questions involving the concept.
The exact intervals can be adjusted to the candidate’s available study time.
Spaced review is particularly useful for material that is easy to forget, such as medication classifications, laboratory concepts, developmental milestones, precautions, and emergency interventions.
Use interleaving during later preparation
Interleaving means mixing different topics rather than completing an entire study session on only one subject.
For example, a later NCLEX study session might contain:
5 pharmacology questions
5 cardiovascular questions
5 mental health questions
5 pediatric questions
5 prioritization questions
5 management-of-care questions
This forces the learner to identify which nursing concept applies to each situation.
It also reduces dependence on topic clues. During the actual NCLEX exam, the candidate will not be told, “This is your pharmacology question” before every item.
Practice prioritization deliberately
Prioritization should not be treated as a small subsection of an NCLEX review. It should be incorporated into everyday question practice.
When answering questions, repeatedly consider:
Which client is unstable?
Which finding represents an acute change?
Which problem threatens airway, breathing, or circulation?
Which finding suggests deterioration?
Which intervention addresses the immediate risk?
Which task can safely wait?
What information requires immediate follow-up?
For example, if four clients are described and one has a sudden change in level of consciousness, another requests pain medication, another needs discharge teaching, and another needs routine vital signs, the candidate should identify the situation that represents the greatest immediate threat rather than simply choosing the client with the most detailed description.
The purpose is to develop a reliable prioritization framework rather than memorize individual questions.
Practice delegation and scope decisions
Candidates should also incorporate delegation into their NCLEX preparation.
For each delegation question, consider:
What task is being considered?
What is the condition of the client?
Does the task require nursing assessment or clinical judgment?
Is the task predictable and routine?
Is the person receiving the assignment qualified and authorized to perform it?
What level of supervision is necessary?
Avoid memorizing rigid rules without understanding the underlying reasoning. The correct decision can depend on the client’s stability, the nature of the task, applicable scope of practice, and the setting.
Use teach-back to test your own understanding
One effective study strategy is to explain a concept aloud as if teaching another nursing student.
For example:
“A client receiving an anticoagulant requires assessment for bleeding because the medication affects clot formation. I would look for…”
If you cannot explain the concept clearly without consulting your notes, the concept probably requires additional review.
This approach is especially useful for complicated topics because it exposes gaps that passive reading may hide.
Separate knowledge errors from reasoning errors
A candidate should avoid responding to every missed question by rereading an entire textbook chapter.
Instead, determine what type of error occurred.
Knowledge error: “I did not know this adverse effect.”
Application error: “I knew the adverse effect but did not recognize that the client’s finding represented it.”
Priority error: “I recognized all the findings but failed to identify which one required immediate action.”
Question interpretation error: “I understood the topic but answered what I thought the question should ask instead of what it actually asked.”
Test-taking error: “I narrowed the choices correctly but changed my answer without a valid reason.”
Each problem requires a different remediation strategy.
Build study sessions around learning cycles
A productive NCLEX study session can follow a four-stage cycle:
Learn → Apply → Analyze → Remediate
Learn: Review a limited amount of content.
Apply: Complete related NCLEX practice questions.
Analyze: Study the rationale and identify reasoning patterns.
Remediate: Review the specific concept that remains weak.
For example, if the study topic is respiratory disorders, a candidate might first review respiratory assessment, oxygenation, common disorders, and nursing interventions. The candidate then completes related questions, examines errors, and returns only to the areas that require reinforcement.
This prevents study time from becoming endless rereading.
Gradually introduce timed and full-length practice
Timed practice can help candidates become comfortable making decisions without spending excessive time on one question.
However, timing should not become the primary measure of readiness.
During early preparation, accuracy and reasoning should take priority. As the test date approaches, candidates can introduce longer practice sessions and eventually full-length simulations to evaluate concentration, endurance, pacing, and consistency.
A full-length practice test is most valuable when followed by detailed analysis. A score alone does not explain what needs to change.
Using Kaplan Test Prep, study guides, and free NCLEX resources
The quality and organization of study resources can strongly influence an NCLEX study plan, but candidates do not need to use every available resource. An effective approach is to select a small number of complementary materials and use each for a defined purpose.
The most important starting point should be the official NCLEX and NCSBN information because the test plan establishes the current examination framework.
Start with official NCLEX and NCSBN resources
The official NCLEX preparation website provides several resources that candidates can use without purchasing a commercial review course. These include:
The current NCLEX test plan
NCLEX sample questions
PN case studies
Exam Preview
Candidate Tutorial
2026 Candidate Bulletin
Candidate rules and exam-day information
The official preparation page specifically provides a sample pack containing PN case studies and additional examples, while the Candidate Bulletin provides information covering the examination process from registration through results.
The NCSBN test plan should be treated as a foundational study guide because it identifies the current Client Needs categories, provides content examples, and explains the role of clinical judgment.
Candidates should also remember that NCSBN does not recommend or endorse commercial review courses or study materials. Commercial resources should therefore be evaluated based on how well they fit the learner’s needs rather than because they are presented as officially endorsed.
Use Kaplan Test Prep strategically
Kaplan Test Prep is one commercial option available to candidates preparing for the NCLEX-PN. Kaplan currently offers NCLEX-PN preparation materials, including review books, practice questions, online quizzes, and broader preparation programs. Its current NCLEX-PN review book includes NGN-style question formats, critical-thinking strategies, practice sets, a full-length practice test, and rationales for answer choices.
Kaplan also offers free NCLEX practice resources, including a question-of-the-day format and additional practice materials.
Candidates using Kaplan or another commercial provider should avoid treating the resource as a substitute for the official NCSBN test plan.
A sensible approach is:
Official test plan → identify content needs → use Kaplan or another resource for instruction and practice → compare preparation with official NCLEX item formats → remediate weaknesses.
This keeps commercial NCLEX prep courses in their proper role: preparation tools rather than the authority on licensure requirements.
Evaluate a study guide before committing to it
A good NCLEX study guide should do more than provide large amounts of information.
Look for resources that include:
Current NCLEX-PN content
Clinical judgment practice
NGN-style items
Clear explanations
Practice questions
Detailed rationales
Content organized around Client Needs
Medication and safety concepts
Case-based practice
Opportunities for remediation
Current information rather than outdated examination terminology
A resource may be visually attractive but still be inefficient if it contains excessive detail that is unlikely to help the learner answer entry-level nursing questions.
Use free NCLEX resources wisely
Free resources can be valuable, particularly for candidates who cannot afford several commercial products.
Useful free NCLEX resources include the official NCLEX preparation materials, sample questions, case studies, exam preview, candidate tutorial, test plans, and candidate bulletin.
Free practice questions from reputable educational providers can also supplement preparation, but candidates should evaluate them carefully.
Before incorporating a free resource into an NCLEX study schedule, ask:
Is the material current?
Does it reflect the current NCLEX-PN framework?
Does it provide rationales?
Does it include clinical judgment?
Does it contain realistic question formats?
Is the nursing information accurate?
Does it help identify weaknesses?
Is the material consistent with authoritative nursing references?
If the answer to several of these questions is no, the resource may consume valuable study time without providing proportional benefit.
Avoid collecting too many resources
Resource overload is a frequent problem in NCLEX preparation.
A candidate might purchase:
Two review books
Several question banks
Multiple apps
Video courses
Flashcards
Social-media study pages
Multiple free question websites
Several pharmacology guides
A commercial review course
The result can be fragmentation rather than improved learning.
A more efficient NCLEX study plan can use a limited resource set:
1. Official resource: Current NCSBN/NCLEX test plan and official preparation materials.
2. Primary content resource: One comprehensive NCLEX-PN study guide or review course.
3. Practice resource: One reliable question bank.
4. Remediation resource: Personal notes, an error log, nursing school materials, or targeted references.
5. Optional supplementary resource: Kaplan Test Prep or another focused resource if a specific weakness remains.
The purpose is not to accumulate study materials. It is to create a system in which each resource has a clear function.
Combine commercial resources with official information
Commercial resources can provide useful explanations, structured lessons, question banks, and test prep strategies. However, candidates should verify important examination policies, test-plan details, registration information, and current requirements through official NCLEX/NCSBN sources.
The official NCLEX website specifically encourages candidates and educators to become familiar with the current test plan, delivery methodology, anticipated item types, terminology, and testing-site rules.
This distinction is especially important for candidates preparing for the 2026 NCLEX, because older books and websites may contain information that does not reflect the current examination.
Create a resource hierarchy
A practical hierarchy can help prevent conflicting information:
Level 1 — Official authority
NCSBN and NCLEX resources should be used for:
Current test-plan information
Examination policies
Candidate rules
Registration and scheduling information
Official sample items
Exam administration information
Level 2 — Primary educational resource
A comprehensive review book or course can be used for:
Content review
Structured lessons
Practice
Rationales
Study organization
Level 3 — Targeted resources
Use additional materials only when necessary for:
Pharmacology
Pediatrics
Mental health
Prioritization
Clinical judgment
Medication calculations
Other identified weaknesses
Level 4 — Personal remediation
Use the error log and missed-question analysis to determine exactly what requires further study.
This hierarchy keeps the NCLEX study plan focused and reduces unnecessary switching between resources.
Match resources to the stage of preparation
Different resources may be useful at different stages.
During the beginning of NCLEX prep, a comprehensive study guide can help organize major content areas.
During the middle of preparation, practice questions and rationales should become increasingly important.
During later preparation, mixed questions, case studies, NGN-style practice, and timed sessions can help integrate knowledge and clinical judgment.
Near the exam day, official candidate information becomes particularly important for confirming procedures, rules, identification requirements, and other testing details. The official NCLEX preparation site provides the 2026 Candidate Bulletin and exam-day resources for this purpose.
The key is to change the purpose of the resource as preparation progresses rather than continuing to read the same material indefinitely.
Example of a balanced NCLEX-PN resource strategy
Consider a nursing graduate preparing for the NCLEX-PN who has six weeks available.
The candidate could structure resources as follows:
Primary resource: One comprehensive NCLEX-PN review book.
Official resource: 2026 NCSBN test plan and NCLEX sample materials.
Practice resource: One question bank containing NCLEX-style and NGN-style questions.
Targeted resource: A concise pharmacology reference because medication questions are a major weakness.
Tracking tool: An error log.
The candidate might use the review book to clarify concepts, the official resources to understand the examination framework, the question bank for application, the pharmacology reference for targeted remediation, and the error log to determine what should be studied next.
This is more manageable than repeatedly switching between unrelated NCLEX prep courses, books, websites, and apps.
Remember that practice quality matters more than a raw score
A candidate should be cautious about using a single practice-test percentage as proof of readiness.
Practice scores can be affected by:
Question difficulty
Content distribution
Question-writing quality
Familiarity with the resource
Guessing
Repeated exposure to the same questions
Whether rationales were studied
Whether the questions accurately represent the current examination
Therefore, NCLEX success should be evaluated using multiple indicators:
Can you explain why answers are correct?
Can you identify important clinical cues?
Can you prioritize competing problems?
Can you apply concepts to unfamiliar scenarios?
Are repeated errors decreasing?
Can you reason through case studies?
Can you maintain concentration during longer practice sessions?
Are weak content areas improving?
This creates a much stronger picture of readiness than chasing an arbitrary practice-test score.
Build one integrated test-prep system
The strongest NCLEX preparation approach combines resources rather than allowing resources to dictate the entire study process.
A practical system is:
Test plan → Content review → NCLEX practice questions → Rationales → Error analysis → Targeted remediation → Mixed practice → Case studies → Reassessment
For example, a candidate studying pharmacology might first review medication classes, then complete practice questions, analyze the rationales, record recurring errors, revisit weak medication classes, and later encounter those medications in mixed physiological-integrity or clinical-judgment questions.
This creates transfer: the candidate learns to recognize and apply knowledge in new situations rather than simply remembering a previously seen question.
For nursing students and nursing graduates, that distinction is crucial. The purpose of an NCLEX study plan is not to memorize an enormous collection of answers. It is to build the knowledge, reasoning, safety awareness, and clinical judgment needed to approach unfamiliar test questions systematically.
A well-designed NCLEX-PN Study Plan therefore uses practice questions as both assessment and instruction, study strategies as tools for deeper learning, and carefully selected resources as support. When these components work together, preparation becomes more focused, measurable, and responsive to the candidate’s actual learning needs.
4-Week NCLEX-PN Study Plan
A 4-week NCLEX-PN Study Plan can provide a structured framework for candidates who have a limited amount of preparation time before the NCLEX-PN. Four weeks is not automatically sufficient for every test taker; the appropriate amount of preparation depends on nursing school performance, previous exposure to the material, practice-question performance, and the amount of study time available each day.
The purpose of a 4-week plan is not to force every candidate through the same number of chapters or practice questions. Instead, it creates a progression in which the learner first establishes a foundation, strengthens high-priority nursing knowledge, applies that knowledge to questions and case studies, and then transitions into final exam prep.
The 2026 NCLEX-PN test plan should serve as the framework for this process. NCSBN describes its test plans as resources that provide detailed information about exam content, administration, item writing, and clinical judgment. The current 2026 PN test plan is effective from April 1, 2026, through March 31, 2029.
A useful four-week progression is:
Week 1: Build the foundation → Week 2: Strengthen physiological and pharmacological knowledge → Week 3: Apply knowledge through questions and clinical judgment → Week 4: Consolidate, simulate, and prepare for the exam
The plan should remain flexible. If a candidate discovers during Week 1 that pharmacology is substantially weaker than expected, additional study time can be shifted toward that area rather than following the original calendar rigidly.
Week 1: Core nursing content and client needs
The first week of the NCLEX study plan establishes the foundation for the remaining preparation. The objective is not to reread all of nursing school. Instead, the candidate should reconnect major nursing concepts with the four broad Client Needs areas used in the NCLEX-PN framework.
The 2026 NCLEX-PN test plan organizes examination content under four major Client Needs categories: Safe and Effective Care Environment, Health Promotion and Maintenance, Psychosocial Integrity, and Physiological Integrity. The test plan also integrates concepts such as caring, clinical judgment, clinical problem solving, communication and documentation, culture and spirituality, and teaching and learning throughout these categories.
Days 1–2: Establish the baseline
Begin Week 1 with a diagnostic assessment rather than immediately beginning intensive content review.
Complete a set of mixed NCLEX practice questions under conditions that encourage independent reasoning. The purpose is to discover:
Which content areas are already strong?
Which topics are weak?
Are errors primarily knowledge-based?
Are questions being misread?
Is prioritization difficult?
Are delegation questions problematic?
Are pharmacology questions producing repeated errors?
Does the candidate struggle with case-based questions?
Are rationales being understood?
Do not become discouraged by the diagnostic score.
The baseline is a measurement tool, not a prediction of the final NCLEX exam outcome. Its primary purpose is to help personalize the study schedule.
For example, suppose a candidate performs well on basic care questions but repeatedly misses questions involving prioritization, infection prevention, and management of care. Those weaknesses should receive greater attention than topics the candidate consistently answers correctly.
Create three categories:
Priority weaknesses: Concepts repeatedly missed or poorly understood.
Maintenance areas: Concepts consistently answered correctly and requiring only periodic review.
This classification prevents the candidate from spending equal amounts of study time on every topic.
Days 2–3: Review Safe and Effective Care Environment
Next, concentrate on the knowledge needed to provide safe and organized nursing care.
Review concepts such as:
Client safety
Infection prevention and control
Standard precautions
Transmission-based precautions
Documentation
Communication
Client rights
Confidentiality
Informed consent
Incident reporting
Delegation and assignment
Supervision
Continuity of care
Discharge planning
Prioritization
Risk reduction
Management of care deserves particular attention because questions may require candidates to distinguish between several reasonable nursing actions.
For example, a question may describe four clients:
One client with a new change in mental status
One client requesting routine pain medication
One stable client awaiting discharge instructions
One client requiring routine vital signs
The candidate should not simply select the client with the most complicated medical history. Instead, the question should be analyzed for acuity, deterioration, safety risk, and urgency.
The goal during Week 1 is to strengthen the reasoning behind these decisions.
Days 3–4: Review Health Promotion and Maintenance
Health promotion questions require knowledge that extends beyond acute illness.
Review:
Growth and development
Developmental milestones
Nutrition
Immunization principles
Screening
Preventive care
Reproductive health
Prenatal care
Newborn care
Pediatric health
Adult health promotion
Older-adult considerations
Lifestyle modification
Client education
Self-care
Do not approach these topics as disconnected facts.
For developmental questions, for example, organize information around the relationship between age, expected abilities, safety needs, communication, nutrition, and psychosocial development.
For health teaching questions, ask what the client needs to know, whether the information is appropriate for the client’s developmental level, and whether the proposed teaching promotes safe self-care.
The 2026 PN test plan includes health-promotion activities such as disease prevention, screening, immunizations, lifestyle choices, family planning, and self-care.
Days 4–5: Review Psychosocial Integrity
Psychosocial concepts should also be integrated into Week 1.
Study:
Therapeutic communication
Anxiety
Stress
Coping
Grief and loss
Depression
Psychosis
Substance use
Crisis situations
Abuse and neglect
Behavioral changes
Family dynamics
Mental health
End-of-life care
Cultural considerations
Client dignity and autonomy
Pay particular attention to communication questions.
When practicing, distinguish between responses that:
Encourage communication
Validate feelings
Promote client autonomy
Provide appropriate information
Change the subject
Give false reassurance
Impose personal values
Ask inappropriate questions
Minimize the client’s concerns
For example, when a client expresses fear about a diagnosis, a response that acknowledges the client’s concern and encourages further discussion is generally more therapeutic than immediately dismissing the fear or changing the subject.
Days 6–7: Integrate the week’s content
The final part of Week 1 should not consist entirely of more reading.
Shift toward question type practice.
Complete mixed questions involving:
Safety
Infection control
Management of care
Health promotion
Psychosocial integrity
Basic care
Communication
Prioritization
Review every rationale carefully.
Create an NCLEX study summary containing only concepts that remain difficult. This becomes the foundation for targeted review during Weeks 2–4.
A useful Week 1 daily structure could look like:
Study activity
Approximate focus
Content review
Core nursing concepts
Practice questions
Focused Client Needs questions
Rationale review
Every missed or uncertain item
Remediation
Weak concepts
Recall practice
No-notes explanation
Review
Previous weak topics
The exact number of questions per day should be adjusted to the candidate’s available time and ability to thoroughly analyze rationales.
By the end of Week 1, the candidate should have a clearer understanding of the major content areas, the current strengths and weaknesses, and the concepts requiring additional attention.
Week 2: Pharmacology and physiological integrity
Week 2 shifts toward Physiological Integrity, with particular attention to pharmacology, medication safety, physiological adaptation, and major body-system concepts.
This week is intentionally more clinically intensive because many nursing decisions require candidates to connect assessment findings with physiological changes and appropriate interventions.
The 2026 NCLEX-PN framework includes Physiological Integrity among its major Client Needs categories and integrates clinical decision-making and critical thinking throughout the activity statements.
Days 8–9: Build a pharmacology framework
Rather than attempting to memorize hundreds of individual medications, organize pharmacology into medication classes.
For each class, study:
Primary purpose
Basic mechanism or therapeutic effect
Common indications
Important adverse effects
Major precautions
Relevant assessments
Important laboratory considerations
Significant interactions
Administration considerations
Client teaching
Findings requiring follow-up
For example, when studying anticoagulants, do not memorize only the medication name.
Connect:
Medication class → effect on coagulation → bleeding risk → assessment → precautions → client teaching → findings requiring follow-up
This conceptual organization makes it easier to approach unfamiliar test questions.
Days 9–10: Medication safety
Dedicate additional time to medication administration and safety.
Review:
Medication rights
Allergies
Medication reconciliation
Adverse reactions
Side effects
Drug interactions
High-alert medications
Insulin
Anticoagulants
Opioids
IV medications
Medication administration routes
Client education
Monitoring and reassessment
Medication calculations
Practice identifying the difference between an expected effect, a common side effect, a potentially serious adverse reaction, and an emergency finding.
For example, a medication question may provide several findings after administration. The candidate must determine whether the finding is expected, requires routine monitoring, requires provider notification, or demands immediate intervention.
This type of reasoning is more valuable than simply memorizing lists.
Days 10–11: Cardiovascular and respiratory systems
Concentrate on high-yield physiological concepts involving:
This framework helps transform body-system review into practical NCLEX preparation.
Days 11–12: Neurological, endocrine, renal, and gastrointestinal concepts
Continue with:
Stroke
Seizures
Altered level of consciousness
Diabetes
Thyroid disorders
Adrenal disorders
Acute kidney problems
Chronic kidney disease
Urinary disorders
Gastrointestinal disorders
Fluid and electrolyte disturbances
Nutrition
Elimination
Pay particular attention to changes that signal deterioration.
For example, when reviewing diabetes, connect glucose abnormalities with assessment findings, immediate safety concerns, interventions, reassessment, and education.
When reviewing neurological disorders, focus on changes in neurological status and what those changes may indicate.
Days 12–13: Musculoskeletal, integumentary, reproductive, and postoperative care
Review:
Fractures
Mobility
Falls
Pressure injuries
Wound care
Burns
Infection
Postoperative complications
Pain
Reproductive health
Pregnancy-related complications
Postpartum care
Practice distinguishing expected postoperative findings from findings requiring rapid intervention.
The question should always become:
What is happening, what is most dangerous, and what does the nurse need to do next?
Day 14: Pharmacology and physiological-integrity integration
Finish Week 2 with mixed questions.
Avoid organizing every question by body system. Instead, mix:
Pharmacology
Respiratory
Cardiovascular
Neurological
Endocrine
Renal
Gastrointestinal
Postoperative care
Fluid and electrolytes
Pain
Safety
This forces the candidate to determine which knowledge applies to each question without being given the topic in advance.
At the end of Week 2, update the error log.
Compare the results with Week 1.
Look for evidence of improvement in:
Accuracy
Recognition of important findings
Prioritization
Pharmacology
Physiological reasoning
Confidence with unfamiliar scenarios
A personalized NCLEX approach should be adjusted at this point. If one topic remains substantially weaker than the others, additional time should be allocated to it during Week 3 rather than continuing to follow the calendar mechanically.
Week 3: Practice questions, NGN, and clinical judgment
Week 3 changes the emphasis from acquiring information to applying information.
By this point, the candidate should spend less time passively reading and more time answering realistic NCLEX practice questions, analyzing rationales, working through case studies, and developing clinical judgment.
The current NCLEX uses real-world case studies and assesses critical thinking and decision-making. The official NCLEX preparation materials include PN case studies and other sample item formats to help candidates become familiar with the examination experience.
Days 15–16: Increase mixed NCLEX practice
Begin with mixed questions covering multiple content areas.
A session could include:
Management of care
Pharmacology
Respiratory
Cardiovascular
Psychosocial integrity
Health promotion
Infection control
Basic care
Neurological disorders
Prioritization
The purpose is to replicate the mental switching required during the actual NCLEX test.
Do not measure progress solely by the number of completed questions.
For each question, determine:
Did I know it?
Did I understand it?
Did I apply it correctly?
Did I identify the priority?
Did I misread the question?
Did I choose the answer because it sounded familiar?
These distinctions make practice much more productive.
Days 16–17: Focus on NGN-style questions
The term NGN refers to the Next Generation NCLEX approach, which incorporates clinical judgment into the examination rather than representing a separate nursing licensure exam.
Candidates should become comfortable with questions that require them to interpret information across a clinical scenario.
Use case studies to practice:
Recognizing cues
Analyzing cues
Prioritizing hypotheses
Generating solutions
Taking action
Evaluating outcomes
These are the clinical judgment steps identified in the current NCLEX framework.
For example, imagine a case involving a client whose condition changes over several stages.
The candidate may first receive:
Vital signs
Symptoms
Medical history
Laboratory findings
Assessment information
Additional information may then reveal a deterioration.
The candidate must determine:
Which findings are important?
Which findings are connected?
What problem is most urgent?
What action should be taken?
What outcome should be monitored?
Did the intervention produce the expected response?
The 2026 PN test plan states that activity statements require application of fundamental principles of clinical decision-making and critical thinking.
Days 17–18: Practice clinical judgment across different settings
Do not limit practice to hospital-based situations.
The 2026 PN test plan notes that NCLEX items can represent a range of settings, including acute and critical care, long-term care, rehabilitation, skilled care, outpatient care, and community-based or home care.
Therefore, NCLEX preparation should include different client-care environments.
For example:
A long-term-care client develops an acute change in condition.
A home-care client demonstrates difficulty managing medications.
An outpatient client requires health teaching.
A rehabilitation client experiences a new safety concern.
An acute-care client develops signs of deterioration.
The candidate should focus on the nursing principles involved rather than assuming every question represents an acute-care hospital.
Days 18–19: Practice prioritization and clinical decision-making
Spend dedicated time on difficult NCLEX questions involving:
“First”
“Priority”
“Immediate”
“Requires further action”
“Needs follow-up”
“Best response”
“Most appropriate”
“Should the nurse do”
Before selecting an answer, identify the decision being tested.
For example:
“What should the nurse do first?”
requires prioritization.
“Which finding requires follow-up?”
requires recognition of an abnormal or concerning finding.
“Which statement indicates understanding?”
requires evaluation of teaching.
“Which client should the nurse assess first?”
requires comparison of urgency and risk.
Recognizing the question type prevents candidates from answering a different question than the one presented.
Days 19–20: Complete longer practice sessions
Introduce longer blocks of NCLEX practice.
The objective is to develop:
Concentration
Pacing
Decision-making consistency
Endurance
Ability to recover after difficult questions
Ability to maintain reasoning across multiple content areas
Do not become obsessed with finishing questions as quickly as possible.
The NCLEX is not simply a speed test. The candidate should focus on carefully interpreting the information provided and making the safest evidence-based nursing decision.
Day 21: Perform a comprehensive progress assessment
Complete a substantial mixed assessment.
Afterward, analyze:
Content weaknesses
Repeated mistakes
Clinical judgment errors
Pharmacology errors
Prioritization errors
Test-taking mistakes
Question interpretation problems
Then compare this assessment with the baseline from Week 1.
The most useful improvement may not be a dramatic score increase. For example, a candidate who previously guessed on 15 questions but now confidently explains the reasoning behind most answers may be making substantial progress even if the percentage change is modest.
The goal of Week 3 is to make reasoning more reliable.
Week 4: Final review and exam readiness
Week 4 should not become another week of trying to learn every possible nursing fact.
The emphasis now shifts toward final review, targeted remediation, confidence, consistency, and exam readiness.
A common mistake is to respond to approaching test day by dramatically increasing study hours and attempting to relearn all of nursing school. This can produce fatigue and anxiety rather than meaningful improvement.
The final week should be selective.
Days 22–23: Review the highest-priority weaknesses
Return to the error log and identify the most persistent problems.
Prioritize:
Frequently missed concepts
Safety-critical concepts
High-impact clinical judgment weaknesses
Medication errors
Prioritization problems
Concepts that remain difficult despite previous review
Do not spend hours reviewing material that you consistently understand.
For example, if the candidate has repeatedly demonstrated strong knowledge of basic infection-control principles but continues to miss medication-safety questions, the final review should emphasize medication safety rather than repeating familiar infection-control material.
Days 23–24: Review high-yield nursing concepts
Conduct concise content review of major concepts.
Review:
Client safety
Infection prevention
Management of care
Pharmacology
Medication safety
Fluid and electrolytes
Respiratory emergencies
Cardiovascular problems
Neurological changes
Diabetes
Renal problems
Pain
Nutrition
Elimination
Psychosocial care
Health promotion
Client teaching
Delegation
Prioritization
This should be active review rather than another complete reading of a textbook.
Use:
Flashcards
Brief notes
Recall questions
Error logs
Medication tables
Concept maps
Short practice sets
Case studies
The objective is to strengthen retrieval, not create new volumes of notes.
Days 24–25: Complete final mixed practice
Complete a final substantial set of mixed NCLEX practice questions.
Include:
Standard questions
Priority questions
Pharmacology
Case studies
NGN-style items
Client teaching
Safety
Delegation
Clinical judgment
Review rationales thoroughly.
However, avoid interpreting every difficult question as evidence that preparation has failed.
Difficult questions are part of practice. The purpose of the final assessment is to identify any remaining problems that can still be addressed.
Day 26: Perform targeted remediation
Use the results from the final practice session to conduct focused remediation.
Missed prioritization questions: Practice identifying unstable clients, acute changes, and immediate threats.
Missed psychosocial questions: Review therapeutic communication and safety principles.
This is more efficient than starting another complete NCLEX review.
Day 27: Light review and test-day preparation
The day before the exam day should generally emphasize organization and confidence rather than intensive new learning.
Review only essential material.
Confirm:
Test appointment information
Location
Required identification
Travel arrangements
Arrival plans
Necessary personal items
Any applicable testing-center instructions
The official NCLEX preparation website provides the 2026 Candidate Bulletin, candidate rules, information about exam-day expectations, and a tutorial for becoming familiar with the testing software. Candidates should use these official materials rather than relying on social-media posts or outdated websites for exam-day requirements.
Avoid staying awake late trying to memorize additional information.
Adequate rest can support concentration, attention, and decision-making.
Day 28: Preserve readiness
The final day of the 4-week plan should be calm and deliberate.
A candidate may briefly review:
Key medication safety principles
Prioritization frameworks
Important personal error-log items
Frequently forgotten concepts
Avoid attempting to learn a large new topic.
The purpose of the final preparation period is to enter the NCLEX exam with a clear mind and a reliable decision-making process.
How to adjust the 4-week NCLEX-PN Study Plan
A four-week schedule should be treated as a framework rather than a rigid prescription.
Candidates enter NCLEX preparation with different levels of readiness.
A recent nursing graduate with strong academic performance may need a different distribution of study time than a candidate who completed nursing school several years ago.
Similarly, a candidate who performs well in physiological integrity but struggles with psychosocial questions should not spend the same amount of time on every Client Needs category.
A useful adjustment system is:
Strong area: Maintain with periodic mixed questions.
Developing area: Schedule targeted review and additional practice.
Weak area: Allocate repeated review, practice, and remediation.
Persistent weakness: Change the learning method rather than simply increasing the number of questions.
For example, if repeatedly completing pharmacology questions does not improve performance, the candidate may need to stop doing additional questions temporarily and return to medication-class concepts, mechanisms, adverse effects, and nursing assessments before resuming practice.
Example daily schedule for the 4-week plan
A candidate with approximately four hours available on most days might organize a study session like this:
Time
Activity
60 minutes
Focused content review
60 minutes
NCLEX practice questions
45 minutes
Rationale and error analysis
30 minutes
Targeted remediation
30 minutes
Active recall
15 minutes
Review of previous errors
This is only an example. A candidate with two hours available could shorten each block, while a candidate with six hours available could add additional practice and remediation.
More study time is not automatically better if the learner becomes exhausted and stops processing information effectively.
What success should look like by the end of four weeks
By the end of the 4-week NCLEX-PN Study Plan, the candidate should be able to approach unfamiliar questions systematically.
The candidate should be increasingly comfortable with:
Identifying what a question is asking
Recognizing important client cues
Distinguishing expected from concerning findings
Prioritizing client needs
Applying nursing knowledge
Interpreting pharmacology questions
Working through case studies
Applying clinical judgment
Eliminating inappropriate alternatives
Learning from rationales
Recognizing recurring weaknesses
Remaining composed when a question is difficult
The goal is not to reach a point where every NCLEX question looks familiar. In fact, unfamiliar questions are expected.
The stronger outcome is being able to think through an unfamiliar scenario using fundamental nursing principles.
The official NCSBN test plan emphasizes that the NCLEX is designed around current, entry-level nursing competency and that its activity statements require clinical decision-making and critical thinking.
Therefore, the most effective NCLEX study plan is not simply a four-week reading calendar. It is a progressive learning system:
Week 1 — Establish the foundation
Week 2 — Strengthen physiological and pharmacological knowledge
Week 3 — Apply knowledge through practice, NGN, and clinical judgment
Week 4 — Consolidate knowledge and prepare for the exam
Used consistently, this structure gives nursing graduates a practical way to organize their NCLEX-PN test prep while leaving room for individualized remediation. It also prevents the common mistake of spending the entire preparation period reading content and postponing actual NCLEX practice until the final days.
NCLEX Test Day and Passing Strategies
Preparing for the NCLEX-PN does not end when the study schedule is complete. Test day introduces a different challenge: the candidate must apply nursing knowledge independently, manage uncertainty, interpret questions carefully, and maintain concentration throughout the examination.
A strong NCLEX-PN Study Plan should therefore include preparation for the psychological and practical aspects of the NCLEX exam, not just content review. Candidates need to know how to approach difficult questions, eliminate distractors, manage their time, use breaks appropriately, and respond when an unfamiliar question appears.
The 2026 NCLEX-PN is administered using computer adaptive testing (CAT). The computer selects subsequent items based on the candidate’s estimated ability while maintaining the requirements of the NCLEX-PN test plan. Because the examination is adaptive, candidates may receive different numbers and combinations of questions. The length of the examination is not, by itself, an indication of whether a candidate has passed or failed.
The candidate should therefore avoid trying to interpret the difficulty, number, or subject matter of questions as an indication of performance. The objective is much simpler: answer each question as accurately as possible using sound nursing judgment.
Answering NCLEX questions and eliminating distractors
One of the most important NCLEX test-taking skills is learning how to approach a question systematically.
The objective is not to identify an answer that merely sounds medically or technically correct. Instead, determine which option best satisfies the exact question being asked and the information provided about the client.
Read the question carefully
Before examining the options in detail, identify the central task.
Look for words and phrases such as:
First
Priority
Best
Most appropriate
Immediate
Requires follow-up
Requires further teaching
Needs additional assessment
Should the nurse do
Which finding is most concerning?
Which client should be assessed first?
Which statement indicates understanding?
These words establish the decision the question requires.
For example, consider a question asking:
Which client should the nurse assess first?
The candidate should not simply select the client with the most complicated diagnosis. The task is to compare the clients and identify the situation involving the greatest immediate risk.
If the question instead asks:
Which statement indicates that the client understands the discharge instructions?
the task changes completely. The candidate must identify the statement demonstrating correct understanding rather than the most urgent clinical problem.
Identify the client and the clinical problem
Before choosing an intervention, establish the basic clinical picture.
Ask:
Who is the client?
What condition or situation is being described?
What has changed?
What findings are abnormal?
What information is most clinically significant?
What exactly is the question asking?
This prevents irrelevant details from dominating the decision.
For example, a client may have several chronic conditions, but a sudden change in respiratory status may be much more important to the question than a stable chronic diagnosis.
Separate relevant cues from background information
NCLEX questions may contain information that is necessary, supportive, or simply contextual.
A useful technique is to identify:
Relevant cue: A finding that changes the nursing decision.
Background information: Information that provides context but does not determine the immediate action.
For example, if a client has a chronic condition but suddenly develops an acute change in vital signs and mental status, the acute findings may carry greater significance for a priority question.
This is particularly important when working through NGN case studies, where information may be presented across multiple stages.
Identify what type of question you are answering
Different question types require different reasoning.
Priority question: Determine which client, finding, or intervention requires attention first.
Assessment question: Determine what information the nurse should collect or evaluate.
Implementation question: Determine which nursing action is appropriate.
Evaluation question: Determine whether the intervention worked.
Teaching question: Identify the information the client should understand or demonstrate.
Delegation question: Determine which activity can appropriately be assigned within the applicable scope and client circumstances.
Communication question: Identify the response that promotes therapeutic interaction.
Medication question: Connect the medication with its indication, effect, adverse effects, monitoring, and teaching.
Recognizing the question type can prevent the candidate from applying the wrong decision-making framework.
Use the ABC approach appropriately
Airway, breathing, and circulation can provide an important prioritization framework when a question involves immediate physiological threats.
For example, if one client has a minor complaint while another has severe difficulty breathing, the respiratory problem generally demands greater urgency.
However, candidates should avoid turning ABCs into a rigid rule that overrides every other consideration. NCLEX questions can involve other immediate threats, including acute neurological deterioration, severe bleeding, safety risks, and rapidly changing conditions.
The broader principle is:
Identify the problem that presents the greatest immediate threat to the client’s safety and physiological stability.
Consider acute versus chronic findings
An acute change often deserves greater attention than a stable chronic finding.
For example:
A client with chronic hypertension whose blood pressure is within the expected range for that client may be less urgent than a client with a sudden change in level of consciousness.
A client with chronic pain reporting the usual pain level may be less urgent than a client with newly developed respiratory distress.
A stable postoperative finding may be less concerning than a sudden change suggesting a complication.
When answering an NCLEX question, ask whether the finding is expected, chronic and stable, or new and potentially dangerous.
Distinguish expected from unexpected findings
Many NCLEX practice questions test whether candidates can recognize when a finding falls outside the expected pattern.
Ask:
Is this expected for the condition?
Is it expected after the procedure?
Is it a common medication effect?
Is it a sign of deterioration?
Does it require additional assessment?
Does it require immediate action?
For example, if a question describes a client after a procedure, do not automatically assume every abnormal finding represents an emergency. Determine whether the finding is expected for the specific clinical situation.
Eliminate distractors systematically
Distractors are incorrect answer options designed to appear plausible.
Rather than looking for the option that “sounds best,” eliminate choices based on clinical reasoning.
A distractor may be inappropriate because it:
Addresses a less urgent problem
Is outside the nurse’s role or scope
Delays treatment of an immediate problem
Is unsafe
Requires information that has not been established
Is appropriate later but not first
Does not answer the actual question
Uses an inappropriate communication approach
Contradicts the client’s condition
Focuses on a secondary problem
For example, suppose a client has signs of acute respiratory deterioration and the options include:
A. Provide routine discharge teaching B. Assess the client’s respiratory status C. Schedule a follow-up appointment D. Discuss dietary modifications
The distractors may describe reasonable nursing activities in another context, but they do not address the immediate clinical concern.
Be cautious with absolute language
Words such as:
Always
Never
All
None
Only
should prompt careful consideration.
An absolute statement is not automatically wrong, but it deserves scrutiny. Ask whether the statement is universally applicable or whether clinical circumstances can change the decision.
The same principle applies to overly broad or overly narrow options.
Do not choose an option simply because it contains familiar terminology
An answer may contain a medication name, disease term, or nursing intervention that you recognize. Recognition does not make the option correct.
For example, if a question asks for the priority intervention, an option containing a familiar treatment may still be incorrect if another option addresses a more immediate threat.
Do not add information that the question does not provide
A common test-taking error is creating an imaginary clinical scenario.
If the question does not state that a client is unstable, do not automatically assume instability.
If the question does not indicate an allergy, do not invent one.
If the question does not state that an intervention has already occurred, do not assume that it did.
Use the information provided and apply appropriate entry-level nursing knowledge.
Do not keep searching for a hidden trick
NCLEX questions are designed to assess nursing competence, not the ability to decode secret wording.
After identifying the relevant information and evaluating the choices, make the best-supported decision.
Overanalyzing can cause candidates to reject a sound answer because they begin imagining possibilities that are not supported by the question.
Remember that the NCLEX is adaptive
Because the NCLEX uses CAT, the next item is selected based partly on the candidate’s estimated ability and examination requirements. The candidate should not interpret a difficult question as evidence of failure. Likewise, an apparently simple question is not evidence of failure.
This is particularly important psychologically.
A candidate may think:
“That question was extremely difficult, so I must be doing badly.”
That conclusion is not justified.
The appropriate response is:
“This question is difficult. I will analyze the information, apply my nursing knowledge, choose the best-supported answer, and continue.”
Managing test anxiety, time, and difficult questions
An effective NCLEX study plan should prepare candidates for uncertainty. Even well-prepared nursing graduates may encounter questions they do not immediately recognize.
The ability to remain functional when uncertain is an important part of NCLEX success.
Understand that some anxiety is normal
Test anxiety can produce:
Rapid heartbeat
Muscle tension
Difficulty concentrating
Racing thoughts
Fear of failure
Repeatedly changing answers
Excessive checking
Difficulty interpreting familiar information
A moderate level of alertness can help concentration, but excessive anxiety can interfere with reasoning.
The goal is not necessarily to eliminate anxiety completely. The goal is to prevent anxiety from controlling the decision-making process.
Use a simple reset strategy
If anxiety suddenly increases, pause briefly.
A simple reset can involve:
Put both feet comfortably on the floor.
Relax the shoulders.
Take a slow breath.
Read the question again.
Identify what the question is asking.
Identify the most important clinical information.
Evaluate the options.
Choose the best-supported response.
Move forward.
This can interrupt a cycle of panic and overthinking.
Do not interpret the number of questions as a result
Because the NCLEX is administered through CAT, candidates may receive different numbers of questions. The 2026 NCLEX-PN test plan specifically states that examination length is not an indication of pass or fail.
Therefore, do not think:
“My exam is still going, so I must have failed.”
or:
“My exam stopped early, so I must have passed.”
Neither conclusion is reliable.
The candidate should remain focused on the current item.
Establish a reasonable pace
The 2026 Candidate Bulletin states that candidates have up to five hours to complete the NCLEX-PN, including the introductory portion and breaks. The examination includes two preprogrammed optional breaks, offered after approximately two hours and three and one-half hours of testing time. Breaks count against the total testing time.
The official NCLEX site also advises candidates to set their pace, carefully analyze each question, and remember that once an answer is submitted, the candidate cannot return to that question.
This means candidates should avoid two extremes:
Rushing: Selecting answers without reading carefully.
Overthinking: Spending excessive time trying to prove an answer beyond what the question requires.
A reasonable approach is to read carefully, reason deliberately, select the best answer, and continue.
Do not try to predict the passing standard while testing
The passing standard is determined through NCSBN’s standard-setting process and represents the minimum ability level required for safe and effective entry-level nursing practice. The candidate does not need to calculate or estimate this standard during the exam.
The task is not:
“Am I above the passing standard?”
The task is:
“What is the safest and most appropriate answer to this question based on the information provided?”
This distinction can reduce unnecessary mental pressure.
Handle difficult questions one at a time
A difficult question should remain one difficult question.
Do not allow one unfamiliar item to affect the next five questions.
If a question seems difficult:
Read it carefully.
Identify the question type.
Identify the important cues.
Eliminate clearly inappropriate options.
Compare the remaining choices.
Select the option best supported by nursing principles.
Continue.
Once the response is submitted, mentally release the question.
The candidate cannot return to the previous item, so repeatedly replaying it wastes attention that should be directed toward the next question.
Do not change an answer without a reason
Changing answers repeatedly can increase anxiety.
Changing an answer is appropriate when the candidate recognizes a genuine reading error, recalls a relevant fact, or identifies a clear reasoning mistake.
Changing an answer simply because:
“The first answer feels too obvious.”
is not a reliable strategy.
The objective is not to select the most complicated option. It is to select the option that best answers the question.
Use breaks strategically
The 2026 NCLEX includes two scheduled optional breaks, approximately after two hours and three and one-half hours of testing. Candidates may also request an unscheduled break, but all breaks count against testing time.
A candidate who feels mentally fatigued may benefit from using a scheduled break rather than continuing while concentration deteriorates.
During a break:
Step away from the computer as instructed.
Use the restroom if necessary.
Take a few calm breaths.
Drink water if permitted.
Have an appropriate snack if needed.
Avoid discussing exam questions.
Return with attention focused on the next item.
Candidates must follow the testing-center security procedures when taking breaks, including required re-entry procedures.
Avoid discussing exam content during breaks
The NCLEX is a secure examination. Candidates must follow the Candidate Rules and must not disclose, reconstruct, copy, or discuss examination items.
Therefore, breaks should not become opportunities to contact someone for help or attempt to reconstruct questions.
The official Candidate Bulletin specifically addresses examination confidentiality and candidate conduct.
Preparing for test day and staying focused
The final component of NCLEX preparation is logistical readiness.
A candidate can know the nursing content and still create unnecessary stress by arriving late, failing to bring acceptable identification, misunderstanding testing procedures, or neglecting basic physical preparation.
Confirm the appointment before exam day
Before the test date, confirm:
Appointment date
Appointment time
Test-center location
Travel route
Expected travel time
Parking or transportation arrangements
Required identification
Any relevant test-center instructions
The official NCLEX website provides current exam-day rules and reminders, including identification, arrival, biometric procedures, security screening, and testing-room requirements.
Arrive early
The current NCLEX guidance advises candidates to arrive at the test center at least 30 minutes before the scheduled testing time. Candidates arriving more than 30 minutes late may be required to forfeit the appointment and re-register.
Therefore, do not plan to arrive exactly at the appointment time.
Build additional time into the journey for:
Traffic
Parking
Public transportation delays
Finding the test center
Check-in
Security procedures
Arriving early can also reduce unnecessary anxiety.
Bring acceptable identification
Identification requirements are important. Candidates who do not meet the applicable acceptable-ID requirements may not be admitted to the examination and may have to re-register.
Candidates should therefore verify the current requirements in the official 2026 Candidate Bulletin rather than relying on advice from classmates, social-media groups, or older NCLEX guides.
The official NCLEX preparation page identifies the 2026 Candidate Bulletin as the comprehensive resource covering the examination process, registration, candidate rules, and results processing.
Understand the security process
Candidates should expect security procedures at the test center.
Current NCLEX exam-day guidance states that biometric information, including a signature, photograph, and palm vein scan, is part of the admission process. Security scanning procedures also apply.
Candidates should therefore avoid bringing unnecessary items into the testing environment.
The official rules should always take precedence over information found in older NCLEX study materials.
Dress comfortably and appropriately
The official exam-day guidance advises candidates to dress comfortably and notes restrictions concerning items such as hats, scarves, gloves, and outerwear in the testing room, while also providing for religious and cultural dress.
Choose clothing that allows comfortable sitting for an extended period and does not create unnecessary distraction.
Become familiar with the testing software
Candidates can use the official NCLEX Candidate Tutorial before the examination to become familiar with the Pearson testing software. The NCLEX preparation page provides access to the tutorial along with sample questions and an exam preview.
This is useful because the candidate should spend exam time thinking about nursing questions rather than learning how the interface works.
The official NCLEX preparation materials also provide sample item types and case studies that can help candidates become familiar with the examination experience.
Understand the calculator and note-board process
The official exam-day guidance states that an on-screen calculator and an erasable note board/marker are provided.
Candidates should become comfortable with the idea of using only the materials and procedures permitted by the testing center.
Do not bring personal materials into the testing room unless the official rules specifically permit them.
Plan your nutrition and sleep
The night before the NCLEX exam, avoid turning the final hours into an emergency study session.
A better approach is to:
Finish intensive studying early.
Prepare clothing and necessary items.
Confirm travel arrangements.
Set an alarm.
Eat appropriately.
Hydrate normally.
Get adequate rest.
The purpose is to arrive with sufficient physical and mental energy.
Trying to memorize dozens of additional facts at 2:00 a.m. is unlikely to be more valuable than arriving rested and able to reason clearly.
Use a final mental checklist
Before entering the test center, remind yourself:
I do not need to know every possible nursing fact.
I need to reason through the question in front of me.
A difficult question does not tell me whether I am passing or failing.
I will use the information provided rather than inventing information.
I will prioritize safety and appropriate nursing care.
I will answer one question at a time.
This mindset is particularly important with CAT because the candidate may encounter questions that feel progressively difficult or unfamiliar. Difficulty should not be interpreted as a personal performance report.
Stay focused on the current question
One of the most effective passing strategies is maintaining attention on the item currently displayed.
Do not think:
“What if I fail?”
Do not think:
“How many questions will I receive?”
Do not think:
“Why am I getting such difficult questions?”
Instead ask:
“What is this question asking, what information matters, and which answer is most appropriate?”
This simple shift brings attention back to the task.
Respond appropriately to technical problems
If a candidate experiences a problem with the computer or testing environment, the official NCLEX guidance instructs candidates to raise their hand and notify the test administrator.
Do not attempt to fix a technical problem independently or become distracted by it.
The 2026 Candidate Bulletin also explains procedures for significant technical delays, including circumstances in which rescheduling may be offered without an additional fee.
Remember what passing actually represents
The NCLEX is designed to determine whether a candidate demonstrates the level of ability required for safe and effective entry-level nursing practice. The passing standard is established through NCSBN’s standard-setting process rather than by requiring a fixed percentage of candidates to pass.
This is important because candidates sometimes approach the examination as though they need to achieve a predetermined percentage on every item.
That is not how the adaptive examination should be mentally approached.
Instead, the candidate should consistently demonstrate sound nursing reasoning.
A strong NCLEX test strategy can therefore be summarized as:
Read carefully → Identify the question → Recognize important cues → Prioritize safety → Eliminate inappropriate options → Select the best-supported answer → Move forward.
This process should remain consistent whether the item is a traditional multiple-choice question, a case study, or another current NCLEX item format.
The most effective NCLEX-PN Study Plan culminates in this ability to apply knowledge calmly and consistently. Content knowledge matters, but test-day performance also depends on concentration, decision-making, pacing, and the ability to remain composed when the answer is not immediately obvious.
Candidates preparing for the 2026 NCLEX-PN should rely on the current NCSBN and NCLEX resources for official examination procedures, because policies and examination information can change. The official NCLEX preparation page provides the current test plan, Candidate Bulletin, sample materials, exam preview, and Candidate Tutorial.
On exam day, the goal is not to prove that every fact from nursing school has been memorized. The goal is to demonstrate safe, entry-level nursing judgment one question at a time.
Maintaining an NCLEX Error Log
Common NCLEX-PN Study Mistakes
Preparing for the NCLEX-PN requires more than spending a large number of hours with a study guide or completing hundreds of NCLEX practice questions. The quality, organization, and purpose of study time have a major influence on how effectively a nursing graduate develops the knowledge and clinical reasoning needed for the exam. A common problem is that test takers may work hard but use inefficient methods, such as cramming, memorizing isolated facts, or completing practice questions without carefully examining the rationales.
The NCLEX-PN is designed to assess whether a candidate can apply nursing knowledge to client situations and make safe decisions at the level expected of an entry-level practical or vocational nurse. Consequently, an effective NCLEX-PN Study Plan must support understanding, application, clinical judgment, and retention rather than simply increasing the amount of material reviewed.
The most common mistakes are especially important because they can create a false sense of preparedness. A candidate may recognize terminology, remember medication names, or achieve reasonable scores on familiar questions while still struggling when an NCLEX question presents unfamiliar information, competing priorities, or a changing client condition.
Recognizing these problems early allows nursing students and nursing graduates to modify their NCLEX prep before exam day.
Cramming and studying without a plan
Cramming is one of the most common problems in NCLEX preparation. It occurs when a test taker postpones serious preparation and then attempts to review a large amount of nursing content during a short period immediately before the test date. Although intensive study can sometimes create the impression that substantial progress is being made, studying large quantities of material at once does not necessarily produce durable learning.
An effective NCLEX-PN Study Plan should distribute learning over manageable study sessions. Instead of attempting to review every body system, medication class, nursing intervention, and client needs category in a few days, the candidate should organize the available study time according to current knowledge, weaknesses, and the amount of preparation required.
Why cramming is ineffective
Cramming often emphasizes short-term recognition rather than long-term understanding. A nursing graduate might spend six hours reading pharmacology notes and feel familiar with dozens of medications. However, familiarity with a list of medications does not necessarily mean the candidate can answer a test question involving an adverse reaction, contraindication, medication interaction, laboratory value, or client teaching requirement.
For example, consider a candidate who studies insulin medications immediately before an exam. The candidate may memorize that insulin lispro is rapid-acting and insulin glargine is long-acting. However, an NCLEX question may present a client who has a particular blood glucose level, meal schedule, medication order, or change in condition and ask which action is appropriate. The question requires application rather than simple recall.
Cramming can also cause several practical problems:
Information becomes difficult to organize because too many topics are studied simultaneously.
Previously learned material may not be revisited enough to strengthen retention.
Fatigue reduces concentration and makes complex questions more difficult to analyze.
Weak areas can remain hidden because the candidate moves quickly from one topic to another.
There is less time to identify recurring errors.
Anxiety may increase because the candidate feels that there is never enough study time.
The final days may become overloaded with new material instead of focused review.
A strong NCLEX study schedule therefore needs to balance content review, application, practice, remediation, and recovery.
Studying without a plan creates inefficient study time
Another mistake is studying whenever time happens to become available without establishing priorities. A candidate may study pharmacology on Monday, randomly review maternity content on Tuesday, complete a few NCLEX practice questions on Wednesday, watch several review videos on Thursday, and then spend Friday reading notes without determining whether the activities address actual weaknesses.
This approach can produce considerable study time without producing proportional improvement.
A useful study plan should answer practical questions such as:
What topics need the most attention?
What should be studied today?
How much study time is realistically available?
How many practice questions should be completed?
Which errors need remediation?
When should difficult topics be reviewed again?
When should mixed NCLEX practice begin?
How will progress be evaluated?
For example, a nursing graduate preparing with a 4-week NCLEX study plan might identify pharmacology and physiological integrity as major weaknesses. Rather than randomly studying for four weeks, the candidate could assign specific days to medication safety, cardiovascular disorders, respiratory disorders, neurological conditions, endocrine disorders, and other areas while maintaining regular mixed practice.
The purpose is not to create an inflexible timetable. A study calendar should provide structure while allowing adjustments when performance shows that additional review is necessary.
Avoiding the “more hours means better preparation” misconception
More study time does not automatically produce better NCLEX preparation. Six highly focused hours can be more productive than ten hours of distracted reading.
For example, consider two test takers:
Test taker A studies for eight hours but primarily rereads lecture notes and highlights information.
Test taker B studies for four hours by reviewing a weak topic, answering related questions, analyzing every rationale, recording mistakes, and revisiting difficult concepts.
Although Test taker A spends more time studying, Test taker B may be engaging in deeper learning.
Effective study time should therefore be measured by what the candidate can explain, apply, and recognize—not simply by the number of hours spent sitting with study materials.
How to replace cramming with deliberate preparation
A better approach is to divide preparation into repeated learning cycles. For each study session, a candidate can move from learning a concept to applying it and then evaluating performance.
For example:
Review: Study heart failure, including expected findings, assessment priorities, medications, complications, and client teaching.
Apply: Complete NCLEX practice questions involving clients with heart failure.
Analyze: Determine why each answer was correct or incorrect.
Remediate: Review concepts that caused errors.
Reassess: Complete additional questions later to determine whether the weakness has improved.
This approach turns study time into an active process rather than passive exposure to information.
A candidate with several months available may use a 3-month NCLEX study plan that gradually progresses from foundational content to application and mixed practice. Someone with only four weeks may need a more concentrated 4-week plan, but should still avoid attempting to memorize an entire nursing program in the final few days.
The most effective NCLEX-PN Study Plan is therefore realistic, prioritized, and adaptable. It should reflect the candidate’s starting point rather than an idealized schedule that cannot be maintained.
Memorizing instead of understanding nursing concepts
Memorization has a legitimate place in nursing education. Nurses need to remember medication classifications, normal laboratory ranges, assessment findings, precautions, terminology, and other foundational information. The problem occurs when memorization becomes the primary method of NCLEX preparation.
The NCLEX-PN requires candidates to use information within client situations. A test taker who memorizes isolated facts may perform well when the question asks for direct recall but struggle when the same knowledge is embedded in a clinical scenario.
Understanding a concept means knowing more than its definition. The candidate should understand why a finding occurs, what it means for the client, what the nurse should assess, which intervention is appropriate, and what complications may develop.
Example: understanding rather than memorizing
Suppose a candidate memorizes:
“Hypokalemia means low potassium.”
That is correct, but it is not enough for many NCLEX questions.
A deeper understanding includes recognizing that potassium plays an important role in neuromuscular and cardiac function. The candidate should therefore connect hypokalemia with findings such as muscle weakness, fatigue, changes in cardiac rhythm, and other relevant clinical manifestations.
The candidate should also understand why certain clients are at risk, what medications or conditions may contribute to potassium loss, which assessments are important, and why potassium replacement must be administered safely.
An NCLEX question may not ask, “What is hypokalemia?” Instead, it may present a client receiving a diuretic who develops weakness and an abnormal cardiac rhythm and ask which assessment finding requires priority attention.
The test taker must connect the cues rather than simply recall a definition.
Build relationships between nursing concepts
A useful NCLEX study method is to organize information into relationships.
For every major concept, ask:
What is happening?
Why is it happening?
What findings would I expect?
What findings would concern me?
What should the nurse assess?
What intervention is appropriate?
What complication could develop?
What should the client be taught?
How could this information appear in an NCLEX question?
For example, when studying pneumonia, do not memorize only the definition. Connect the condition to respiratory assessment, oxygenation, abnormal breath sounds, fever, secretions, positioning, hydration, prescribed therapies, deterioration, and client education.
This approach helps transform content review into clinical reasoning.
Memorizing medication lists without understanding medication safety
Pharmacology is particularly vulnerable to ineffective memorization. A candidate may attempt to memorize hundreds of medication names without understanding their classes, purposes, major risks, assessments, and safety considerations.
A more useful approach is to study medication groups.
For each medication or medication class, consider:
Classification
Therapeutic purpose
Mechanism or basic action
Expected therapeutic effect
Common adverse effects
Serious adverse effects
Relevant assessments
Important laboratory considerations
Contraindications or precautions
Major interactions
Client teaching
What findings require the nurse to hold, question, or report the medication
For example, rather than memorizing that a particular anticoagulant is associated with bleeding, the candidate should connect anticoagulation with assessment for bleeding, medication safety, relevant laboratory monitoring when applicable, interactions, injury prevention, and client education.
This type of understanding makes it easier to answer unfamiliar test questions involving the same medication class.
Understanding priorities is more valuable than memorizing isolated rules
NCLEX questions frequently require the candidate to determine which client, finding, or intervention deserves priority. Memorized rules can help, but clinical reasoning is necessary when several answers appear reasonable.
For example, a candidate may memorize “use ABCs—airway, breathing, circulation.” However, simply knowing the acronym does not solve every prioritization question.
The candidate must determine whether the client’s airway is actually threatened, whether breathing is impaired, whether circulation is compromised, and whether another acute change represents an even more urgent problem.
Similarly, a memorized rule such as “assess before intervening” cannot be applied mechanically when a client is experiencing an immediately life-threatening emergency that requires rapid intervention.
Understanding the clinical situation allows the nurse to use principles appropriately rather than treating them as rigid formulas.
Avoid memorizing NCLEX “tricks”
Another form of ineffective memorization is learning supposed shortcuts such as:
Always choose the longest answer.
Never choose an answer containing an absolute word.
Always choose assessment before intervention.
Always choose the answer involving the airway.
Always choose the least invasive intervention.
Never change an answer.
These statements may occasionally appear useful, but they are not reliable substitutes for clinical reasoning.
NCLEX preparation should focus on understanding what the question is asking, identifying relevant cues, recognizing the client’s problem, and selecting the safest appropriate response.
The goal is not to memorize how the exam “tricks” candidates. The goal is to become better at applying nursing knowledge.
Use teach-back to test understanding
One practical way to determine whether a topic is understood is to explain it without looking at the study materials.
For example, after reviewing heart failure, close the study guide and explain:
Why fluid may accumulate.
Which assessment findings may occur.
Which findings indicate worsening status.
Why certain interventions are used.
What medication safety concerns exist.
What client teaching is important.
If the explanation depends heavily on reading the notes word for word, additional learning may be needed.
This technique can be used across the body system content included in an NCLEX review and is particularly useful for difficult topics.
A strong NCLEX-PN Study Plan should therefore emphasize conceptual understanding, relationships, clinical application, and retrieval—not merely the number of pages or flashcards completed.
Failing to review practice-question rationales
Completing NCLEX practice questions without reviewing the rationales is another major preparation mistake. Some test takers focus heavily on their scores, count how many questions they completed, and immediately move to the next set.
This misses one of the greatest educational benefits of practice questions.
A practice question is not simply a measurement of whether the candidate knows something. It is also an opportunity to identify weaknesses in knowledge, clinical reasoning, prioritization, interpretation of cues, and test-taking.
The rationale explains the reasoning behind the answer and can reveal information that the candidate did not understand before answering the question.
Why rationales matter
Suppose a candidate answers 60 practice questions and gets 42 correct. Looking only at the 70% score provides limited information.
The candidate needs to determine:
Which questions were missed?
Were the errors caused by knowledge gaps?
Did the candidate misread the question?
Was a relevant cue overlooked?
Was the priority incorrectly identified?
Was a medication concept misunderstood?
Did the candidate choose an unsafe intervention?
Was the correct answer changed without a sound reason?
Did the candidate misunderstand why the other options were incorrect?
The rationale helps answer these questions.
For example, imagine a question asking which client should be assessed first. The candidate selects a client with chronic pain but the correct answer involves a client with a newly developed respiratory change.
Simply seeing “wrong” does not teach enough. The candidate should determine why the respiratory finding represents a higher priority and what clinical principle supports that decision.
The next time a similar question appears with different diagnoses, the candidate should be able to recognize the priority based on the client’s condition rather than memorizing the original answer.
Review both correct and incorrect answers
A common mistake is to review only questions that were answered incorrectly. Incorrect answers certainly require attention, but correct answers can also reveal weaknesses.
A candidate may answer a question correctly through guessing, partial understanding, or elimination of distractors.
For example, suppose a test taker chooses the correct medication but cannot explain why it is appropriate. That question should still be reviewed.
A useful approach is to ask after each question:
If I answered correctly, can I explain why the correct answer is correct and why the alternatives are less appropriate?
If I answered incorrectly, what specifically caused the error?
This distinction makes practice more meaningful.
Understand why every distractor is wrong
NCLEX questions often include several answers that sound reasonable. Reviewing only the correct answer does not teach the candidate how to distinguish between them.
Suppose a client has a change in condition and four nursing interventions are presented. The rationale should help the candidate determine why one action is the best response and why the other three are less appropriate in that particular situation.
A useful rationale review might look like this:
Question: Which action should the nurse take first?
My answer: Option B.
Correct answer: Option D.
Why I missed it: I focused on the client’s chronic diagnosis instead of the newly developed acute finding.
Key concept: Acute changes can require higher priority than stable chronic problems.
Why D is appropriate: It addresses the immediate threat identified by the assessment findings.
Why B is not first: It may be appropriate later but does not address the immediate priority.
This transforms one missed question into a reusable clinical reasoning lesson.
Create an error log
An error log can make rationale review more systematic. Rather than writing down every question, record meaningful mistakes and the concepts behind them.
A simple format can include:
Area
Error
Why It Happened
Correct Principle
Follow-Up
Pharmacology
Chose an unsafe medication action
Did not recognize adverse effect
Assess for serious adverse effects before continuing therapy
Review medication class
Prioritization
Selected stable client
Missed acute change
Prioritize significant deterioration
Complete priority questions
Infection control
Selected incorrect precaution
Confused transmission routes
Match precautions to transmission mechanism
Review precautions
Maternal-newborn
Misidentified abnormal finding
Content gap
Recognize expected vs unexpected findings
Review topic
Delegation
Assigned assessment to inappropriate personnel
Scope misunderstanding
Match task with appropriate nursing responsibility
Review delegation principles
The purpose of the error log is not to document every mistake permanently. It is to identify patterns.
If several errors involve medication adverse effects, pharmacology may require additional review. If many errors involve “first” or “priority” questions, the candidate may need more practice with prioritization and clinical judgment. If errors repeatedly result from overlooking words such as best, first, priority, or requires immediate action, the candidate may need to improve question interpretation.
Do not treat practice-question scores as the only measure of readiness
Scores can be useful, but they should be interpreted alongside the quality of reasoning.
For example, a candidate might score 80% on familiar practice questions while relying heavily on memorized answers. Another candidate might score 70% but demonstrate substantial improvement in understanding, recognize why distractors are incorrect, and show stronger reasoning on unfamiliar questions.
Neither score alone provides a complete picture.
A more meaningful evaluation asks whether the candidate is becoming better at:
Recognizing important clinical cues.
Identifying the actual problem presented.
Distinguishing expected from unexpected findings.
Determining which client needs attention first.
Applying medication-safety principles.
Connecting assessment findings with appropriate interventions.
Explaining why an answer is correct.
Explaining why distractors are incorrect.
Recognizing patterns across different case studies.
Correcting recurring weaknesses.
This is particularly important for an adaptive test, where the candidate encounters questions selected according to performance and ability rather than following a fixed sequence of identical difficulty.
Turn every missed question into a learning opportunity
A productive rationale-review process can follow several steps:
1. Re-read the question. Determine exactly what the question is asking.
2. Identify the clinical cues. Separate relevant information from background details.
3. Reconsider your original reasoning. Determine why the selected answer appeared attractive.
4. Study the rationale. Understand the reasoning supporting the correct answer.
5. Analyze the distractors. Determine why the other choices are inappropriate.
6. Identify the underlying concept. Ask what broader nursing principle the question tested.
7. Remediate the weakness. Review the relevant study materials or content.
8. Reassess later. Answer related questions after enough time has passed to determine whether the concept was retained.
This process prevents the candidate from simply memorizing the answer to one question.
Example of effective rationale review
Consider a practice question involving a client receiving an opioid who becomes unusually difficult to arouse and develops slow respirations.
A weak review would be:
“I got the question wrong. The answer is naloxone.”
A stronger review would identify the clinical reasoning:
The medication can cause respiratory depression.
Difficulty arousing the client is a concerning change in level of consciousness.
Slow respirations indicate impaired ventilation.
Airway and breathing are immediate concerns.
The nurse should recognize opioid-induced respiratory depression as a potentially life-threatening complication.
The appropriate response involves immediate assessment and intervention according to the clinical situation and prescribed/emergency protocols.
The broader concept is medication safety and recognition of adverse effects.
Now, if the same concept appears in a different NCLEX question, the candidate is more likely to recognize the underlying problem even if the medication, wording, or client scenario changes.
Use rationales to strengthen clinical judgment
Rationales are especially valuable when practicing NGN-style questions and case studies because these questions may require the candidate to interpret information across multiple steps.
For example, a case may provide:
Client history
Assessment findings
Vital signs
Laboratory results
Medication information
Changes over time
The candidate must determine which cues matter, identify the client’s problem, establish priorities, and select appropriate actions.
Reviewing the rationale helps the candidate understand not only what answer was expected but also how the available information should have been interpreted.
This makes rationale review an important component of an effective NCLEX preparation strategy.
Avoid rushing through large numbers of questions
Completing hundreds or thousands of questions is not automatically better than completing fewer questions thoughtfully.
For example, completing 150 questions in a day and reviewing none of the rationales may provide less educational value than completing 75 questions and spending substantial time understanding the errors.
The appropriate number of questions per day depends on preparation stage, available study time, fatigue, baseline knowledge, and the complexity of the questions.
A candidate should therefore avoid turning practice into a competition based solely on volume.
The central objective is to improve performance and reasoning.
A strong NCLEX-PN Study Plan treats practice questions as part of a feedback system:
When this cycle is repeated consistently, practice becomes more than exam simulation. It becomes a structured method for identifying and correcting weaknesses.
Avoiding these three common mistakes can substantially improve the quality of NCLEX preparation. Cramming should be replaced with organized and sustainable preparation, memorization should be supplemented with conceptual understanding, and practice questions should be followed by careful rationale analysis. The strongest preparation is not defined by how many hours a candidate studies or how many questions are completed, but by how effectively each study activity improves the ability to apply nursing knowledge to unfamiliar client situations.
Conclusion
Preparing for the NCLEX-PN is not simply a matter of studying more; it is a process of learning how to think, prioritize, and make safe nursing decisions. A well-designed NCLEX-PN Study Plan gives nursing students and nursing graduates a practical framework for transforming their existing knowledge into the clinical reasoning required for the NCLEX. By combining content review, practice questions, clinical judgment, pharmacology, case studies, and targeted remediation, candidates can approach the examination with greater confidence and direction.
The 2026 NCLEX-PN places important emphasis on applying nursing knowledge within realistic client situations. Therefore, successful NCLEX prep should move beyond memorizing definitions, laboratory values, medication names, and isolated nursing interventions. Candidates should learn to recognize relevant cues, identify changes in client conditions, establish priorities, evaluate potential interventions, and determine which response promotes safe and effective care. This approach is particularly valuable when working through NGN-style questions and clinical judgment scenarios.
A strong study plan should also be personalized. There is no single NCLEX study schedule that works equally well for every test taker. A recent nursing graduate with strong foundational knowledge may require a different amount of study time from someone who has been away from a nursing program for several years. Similarly, a candidate struggling with pharmacology will need a different emphasis from one whose primary weaknesses involve management of care, psychosocial integrity, or physiological integrity. Using a study calendar, diagnostic assessment, practice performance, and an error log allows preparation to respond to actual learning needs.
Practice should remain an essential part of NCLEX preparation, but the value of practice depends heavily on what happens after each question. Reviewing rationales, examining incorrect choices, identifying reasoning errors, and returning to weak concepts turn practice questions into learning opportunities. Rather than measuring progress only by the number of questions completed, candidates should evaluate whether they are becoming better at applying nursing principles to unfamiliar situations.
The same principle applies to the use of commercial NCLEX prep courses, study guides, and free NCLEX resources. More resources do not necessarily produce better preparation. Candidates should establish a reliable resource hierarchy, begin with the current NCSBN test plan and official examination information, and then use carefully selected study materials to address specific learning needs. The goal is to create a coherent preparation system rather than continually switching between resources.
Whether a candidate follows a 4-week NCLEX study plan, a 3-month NCLEX study plan, or a longer personalized schedule, consistency is more valuable than last-minute cramming. Effective preparation develops gradually through a cycle of learning, application, analysis, remediation, and reassessment. Difficult topics should not be ignored, but neither should strengths be neglected completely. Balanced preparation allows candidates to strengthen weaknesses while maintaining competence across the broader range of client needs.
On test day, candidates should remember that the NCLEX is designed to evaluate their ability to demonstrate the minimum level of nursing competence necessary for safe entry-level practice. The adaptive nature of the examination means that the number or apparent difficulty of questions should not be used as a prediction of performance. Instead, each NCLEX question should be approached independently: identify what is being asked, recognize the most important clinical information, apply appropriate nursing principles, eliminate unsafe or less appropriate options, and select the response that best addresses the situation presented.
Passing the NCLEX-PN is an important milestone in a nursing career, but preparation should be viewed as more than preparation for one examination. The reasoning skills developed through deliberate study—clinical judgment, prioritization, assessment, medication safety, communication, patient education, and recognition of deterioration—are also fundamental to safe nursing practice.
The most effective NCLEX-PN Study Plan therefore does more than organize a study schedule. It creates a structured pathway from nursing knowledge to competent decision-making. When candidates prepare intentionally, learn from their mistakes, practice consistently, and focus on understanding rather than memorization, they are better positioned to enter the examination prepared to demonstrate what they know and, more importantly, how they use that knowledge to provide safe client care.
Frequently Asked Questions
What is the best way to study for PN NCLEX?
The best approach is to follow a structured NCLEX-PN Study Plan that combines content review, NCLEX practice questions, detailed rationale review, pharmacology, case studies, and clinical judgment practice. Focus on understanding why answers are correct rather than memorizing facts.
What is a good study plan for the NCLEX nursing exam?
A good study plan should begin with a readiness assessment, identify weak areas, and organize daily study sessions around the NCLEX test plan. A 4-week NCLEX study plan can include content review in the first two weeks, intensive practice and NGN questions in week three, and targeted review plus exam preparation in week four.
How many days a week should I study for NCLEX?
For most candidates, 5–6 days per week provides a good balance of consistent study and recovery. Aim for focused study sessions rather than simply maximizing study hours, and reserve at least one day for rest or light review.
What is the best study guide for the NCLEX-PN exam?
There is no single best study guide for every candidate. The NCSBN 2026 NCLEX-PN Test Plan should be the foundation, supplemented with a reputable NCLEX-PN study guide that provides practice questions, detailed rationales, NGN-style questions, and clinical judgment exercises. Kaplan is one commonly used commercial option, while NCSBN also provides free official preparation resources.
NCLEX Study Plan 2026: Step-by-Step NCLEX-RN Study Guide, Test Plan & Study Schedule
The NCLEX Study Plan is a structured approach to preparing for the National Council Licensure Examination, an examination designed to determine whether candidates have the knowledge, skills, and clinical judgment necessary for safe and effective entry-level nursing practice. Preparing for the NCLEX-RN is different from preparing for a conventional academic examination because success depends not only on remembering nursing facts but also on applying those facts to client situations, recognizing changes in condition, prioritizing care, evaluating outcomes, and selecting the safest nursing action. An effective NCLEX Study Plan therefore needs to address both the breadth of nursing content and the reasoning processes required to apply that knowledge in practice.
The examination has also evolved considerably with the introduction of the Next Generation NCLEX (NGN). The NGN places greater emphasis on clinical judgment and uses a variety of question formats and case-based scenarios to evaluate how candidates process information and make decisions about client care. The NCSBN’s examination framework incorporates clinical judgment alongside the Client Needs categories that organize the content assessed on the NCLEX-RN. Consequently, preparing for the NCLEXrequires more than working through isolated questions or attempting to memorize a large collection of facts. Preparation should progressively develop the ability to connect assessment findings, recognize relevant cues, determine priorities, identify appropriate interventions, and evaluate whether those interventions are producing the desired outcomes.
A well-designed NCLEX Study Plan provides a framework for organizing this preparation. Instead of approaching the NCLEX exam as an unstructured review of everything learned throughout nursing education, preparation can be divided into manageable areas based on the examination’s content framework and individual readiness. A comprehensive approach generally incorporates:
Content review, to strengthen foundational nursing knowledge and address important knowledge gaps.
Practice questions, to develop the ability to apply knowledge to client-care situations.
Clinical judgment practice, particularly through NGN case studies and other application-based scenarios.
Performance analysis, to identify weak areas and determine where additional preparation is needed.
Cumulative review, to reinforce previously studied material and reduce the loss of information over time.
Readiness assessment, using practice examinations and performance trends rather than relying on a single score or isolated result.
The NCLEX-RN test plan provides an important foundation for determining what should receive attention during preparation. Its Client Needs categories encompass broad areas of nursing practice, allowing examination content to be organized according to the responsibilities and needs encountered in professional nursing. These areas include topics related to safe and effective care, health promotion, psychosocial integrity, physiological health, pharmacological therapies, risk reduction, and physiological adaptation. Understanding this framework helps establish a connection between individual nursing subjects and the broader competencies expected of a newly licensed registered nurse.
The role of clinical judgment is equally important. In actual nursing practice, decisions rarely occur in isolation. A nurse may need to recognize a concerning assessment finding, distinguish relevant from irrelevant information, determine which client requires immediate attention, select an appropriate intervention, and subsequently determine whether the client’s condition has improved. The NGN is designed to evaluate aspects of this reasoning process. An effective NCLEX Study Plan should therefore allow sufficient time not only for learning information but also for practicing how that information is interpreted and applied in realistic clinical situations.
Preparation also requires an appropriate balance between study time and practice. Spending extensive hours reading without testing understanding may create a false sense of preparedness, while completing large numbers of questions without reviewing the underlying concepts can reinforce mistakes. A more effective approach connects these activities. For example, after reviewing cardiovascular nursing, a candidate might complete practice questions involving heart failure, myocardial infarction, dysrhythmias, medications, and priority interventions. Incorrect responses can then be analyzed to determine whether the problem resulted from a knowledge deficit, misunderstanding of the question, failure to recognize a priority, incorrect interpretation of clinical findings, or difficulty applying nursing judgment.
The length and structure of an NCLEX Study Plan will also vary according to individual circumstances. Factors such as the examination date, previous nursing education, familiarity with the content, performance on diagnostic assessments, available study time, employment or other responsibilities, and confidence with clinical judgment can influence how preparation should be organized. A person with substantial knowledge but limited experience with NCLEX-style questions may require a different approach from someone who has significant content gaps but is comfortable with question-based testing. For this reason, effective preparation should be personalized rather than based entirely on a fixed schedule.
The 2026 examination should be approached with particular attention to the current NCSBN test plan and official examination guidance because NCLEX policies, content specifications, and examination information can change over time. The current framework should be treated as the primary reference when determining the scope of preparation, while commercial review materials and practice resources should be used as supporting tools rather than substitutes for the official examination information. This distinction is important because no individual study guide, question bank, or preparation course can reproduce the exact examination or guarantee a particular outcome.
Ultimately, an NCLEX Study Plan is not simply a calendar showing what to study each day. It is a preparation framework that connects what must be learned, how that knowledge should be practiced, how progress should be evaluated, and how remaining weaknesses should be addressed. Effective preparation moves progressively from understanding nursing concepts to applying them in client situations and ultimately demonstrating the clinical judgment expected of an entry-level registered nurse.
This guide examines that process step by step. It begins with an understanding of the NCLEX-RN, the 2026 examination framework, the Next Generation NCLEX, and the role of the NCSBN test plan. It then addresses the development of a personalized NCLEX Study Plan, organization of study time and schedules, selection of appropriate study resources, content review, practice questions, NGN case studies, clinical judgment, and performance evaluation. The final sections address readiness assessment, the final stage of preparation, examination day considerations, and the steps to take after receiving NCLEX results. Together, these elements provide a structured framework for approaching the examination as a measure of nursing competence rather than simply another academic test.
Understanding the NCLEX-RN and the 2026 Next Gen NCLEX
The NCLEX-RN is a licensure examination used to determine whether an individual has the competence required to practice safely and effectively as an entry-level registered nurse. It is not simply a test of how much nursing information a candidate can remember. The examination is designed around the knowledge, skills, and judgment needed in actual nursing practice, which means preparation must address both foundational nclex content and the ability to apply that knowledge to client situations.
The National Council of State Boards of Nursing (NCSBN) develops the NCLEX-RN in collaboration with nursing regulatory bodies. Its purpose is closely connected to public protection: the examination establishes whether a candidate has reached the minimum level of ability required for safe and effective entry-level nursing practice. The current 2026 NCLEX-RN test plan is effective from April 1, 2026, through March 31, 2029, and was informed in part by the 2024 RN Practice Analysis.
Understanding the examination before beginning an NCLEX Study Plan is important because it changes how preparation should be approached. Rather than treating the examination as a large collection of subjects to memorize, preparation should reflect the way the NCLEX measures nursing competence:
Knowledge application: Using nursing knowledge in client-care situations rather than recalling isolated facts.
Clinical judgment: Recognizing important information, interpreting findings, determining priorities, selecting appropriate actions, and evaluating outcomes.
Safe and effective care: Applying principles that protect clients and support appropriate nursing practice.
Client-centered decision-making: Considering the client’s condition, needs, risks, preferences, and response to care.
Adaptability: Responding appropriately to different levels of difficulty and different question types presented during the examination.
The 2026 examination therefore requires a preparation strategy that combines content review, nclex practice, and clinical reasoning. Understanding how these elements fit together is the foundation for developing an effective NCLEX Study Plan.
NCLEX-RN Exam Structure and Computerized Adaptive Testing
The NCLEX-RN uses computerized adaptive testing (CAT) rather than a traditional fixed-form examination in which every candidate receives the same predetermined sequence of questions. In CAT, the computer selects each subsequent item according to an ongoing estimate of the candidate’s ability. The 2026 NCLEX-RN test plan explains that items are selected from a large pool and classified according to test-plan categories, difficulty, and clinical judgment considerations. After each response, the computer updates the candidate’s ability estimate and uses that information when selecting the next appropriate item.
This is one of the most important concepts to understand when preparing for the NCLEX because the adaptive system means that the examination experience will not be identical for every candidate.
For the 2026 NCLEX-RN:
The examination contains a minimum of 85 items.
The maximum is 150 items.
Candidates have five hours to complete the examination.
The five-hour period includes breaks.
The examination can end before the maximum number of items when the testing algorithm has sufficient information to make a pass/fail decision.
Reaching 85, 100, 120, or 150 items does not, by itself, indicate whether a candidate passed or failed.
The variable length of the nclex exam is a direct consequence of CAT. The system does not simply count correct answers until a predetermined percentage has been reached. Instead, it continuously estimates whether the candidate’s ability is above or below the established passing standard. When sufficient evidence has been obtained to make a decision within the examination rules, the test can stop.
For example, imagine two candidates who begin with similar levels of preparation. Candidate A demonstrates performance that allows the computer to make a decision after the minimum number of items. Candidate B continues receiving items because additional information is required before a decision can be made. Their different examination lengths do not mean that Candidate B performed poorly or that Candidate A performed exceptionally well. The NCSBN specifically cautions that examination length is not an indicator of passing or failing.
This is particularly important psychologically. A candidate who reaches 85 questions should not assume, “I definitely passed because my test stopped early.” Likewise, someone who continues toward 150 questions should not assume, “I definitely failed because I received so many questions.” The number of questions is an outcome of the adaptive process, not a simple score.
The examination also does not provide unlimited opportunities to revisit previous items. Items are presented one at a time, and once a response is confirmed and the candidate proceeds to the next item, the previous item cannot be revisited. Every item must receive a response. The official test plan advises candidates to maintain a reasonable pace, carefully consider each item, and select the best response before moving forward.
This has practical implications for an NCLEX Study Plan. Preparation should include practice that resembles the cognitive demands of the actual nclex test, rather than relying exclusively on passive reading. Becoming accustomed to reading a clinical scenario carefully, identifying what the question is actually asking, eliminating inappropriate options, and committing to the best available response can make the testing experience more manageable.
It is also important to understand what CAT does not mean. Adaptive testing does not mean that every question becomes harder simply because a candidate answers correctly. The next item is selected using the candidate’s estimated ability while also meeting the requirements of the NCLEX-RN test plan. Consequently, candidates should not attempt to manipulate the adaptive system by intentionally answering questions incorrectly or by trying to determine their performance from the apparent difficulty of individual items.
The 2026 examination also includes unscored pretest items. At the minimum examination length, the test plan identifies 52 items from the eight content areas, 18 items from three clinical judgment case studies, and 15 unscored pretest items. The clinical judgment case studies consist of six items each and are designed around the six steps of the NCSBN Clinical Judgment Measurement Model.
Candidates should therefore approach every item seriously. There is no reliable way to identify an unscored pretest item simply from its appearance, and the safest approach is to apply the same careful reasoning to every question.
The adaptive nature of the examination also explains why practice tests should not be interpreted as exact predictions of the actual examination. A commercial practice test may estimate performance under its own scoring system, but it does not reproduce the proprietary NCLEX algorithm. Practice is valuable for building knowledge, reasoning, endurance, and familiarity with item formats; it should not be treated as a guarantee of the outcome of the actual nclex exam.
Next Gen NCLEX and Clinical Judgment
The Next Generation NCLEX (NGN) represents an enhanced approach to measuring nursing competence, with a particular emphasis on clinical judgment. The NGN launched on April 1, 2023 after an extensive development process by the NCSBN. Its purpose was to strengthen the examination’s ability to evaluate how candidates make decisions in situations that resemble the complexity of contemporary nursing practice.
Clinical judgment is central to safe nursing care because nurses must frequently make decisions using incomplete, changing, or competing information. A nurse may have several clients requiring attention at the same time, for example, but the most appropriate action depends on factors such as acuity, changes from baseline, potential complications, safety risks, and the significance of assessment findings.
The NGN addresses this reasoning process through the NCSBN Clinical Judgment Measurement Model (NCJMM). The six steps are:
Recognize cues – Identify relevant information from the client’s history, assessment findings, vital signs, laboratory results, symptoms, medications, or clinical situation.
Analyze cues – Connect relevant findings and determine what they may indicate about the client’s condition.
Prioritize hypotheses – Determine which possible explanation or problem requires the greatest attention based on the available evidence.
Generate solutions – Identify appropriate interventions or actions that could address the client’s priority needs.
Take action – Select or implement the most appropriate response.
Evaluate outcomes – Determine whether the intervention produced the expected result and whether additional action is necessary.
These steps should not be understood as six completely separate activities that always occur in a rigid sequence. Clinical judgment is an integrated process. A change in the client’s condition may require the nurse to reassess previously identified cues, reconsider a hypothesis, modify an intervention, and evaluate new information.
Consider a client admitted with pneumonia. The initial information might include fever, productive cough, fatigue, and an elevated respiratory rate. Recognizing these findings is only the beginning. The nurse must determine which findings are clinically significant, connect them with the client’s oxygen saturation and respiratory effort, determine whether impaired oxygenation is becoming the priority concern, select an appropriate intervention, and then determine whether the client’s response indicates improvement or deterioration.
That distinction is important when developing an NCLEX Study Plan. Memorizing that pneumonia can cause hypoxemia is useful, but it does not fully prepare a candidate for a scenario requiring interpretation of oxygen saturation, respiratory effort, mental status, and response to oxygen therapy. Preparation must therefore move from “What do I know?” toward “What does this information mean, what should I do, and why?”
The NGN uses case-based and innovative item formats to support this type of measurement. Official NCLEX preparation resources provide sample RN case studies and examples of different item types so candidates can become familiar with how information may be presented.
A case study may present information about a client in stages rather than providing every relevant finding at once. This reflects an important feature of nursing practice: information becomes available over time, and the nurse must continually reassess the situation.
For example:
Initial presentation: A client reports increasing shortness of breath.
Additional information: The assessment reveals tachypnea, decreased oxygen saturation, and new confusion.
Further development: The client’s respiratory effort increases despite an initial intervention.
The candidate must not simply recognize that each finding is associated with respiratory compromise. The reasoning involves determining which findings are most important, what they suggest collectively, which action should take priority, and whether the response indicates improvement or deterioration.
This is why an effective NCLEX Study Plan should include opportunities to work through case studies rather than relying exclusively on isolated questions. Case-based practice encourages the integration of assessment, pathophysiology, pharmacology, prioritization, intervention, and evaluation.
Clinical judgment is also not limited to one particular nursing specialty. It can be required in medical-surgical, pediatric, maternal-newborn, psychiatric, community, and other nursing situations. A candidate may need to apply the same reasoning process to very different clinical circumstances.
For example, clinical judgment may involve:
Recognizing signs of postpartum hemorrhage.
Identifying deterioration in a client with heart failure.
Determining which medication finding requires immediate intervention.
Recognizing a change in neurological status.
Prioritizing a client experiencing acute respiratory distress.
Determining whether a delegated task is appropriate.
Evaluating whether a treatment has achieved its intended effect.
The goal is not to memorize a fixed list of NGN answers. It is to develop a transferable reasoning process that can be applied when the diagnosis, symptoms, setting, or wording changes.
NCLEX-RN Test Plan and Client Needs Categories
The NCLEX-RN test plan provides the organizational framework for the content assessed on the examination and is therefore one of the most useful documents to understand when developing an NCLEX Study Plan. The NCSBN describes the test plan as a resource that guides candidates in preparation, directs item development, and facilitates classification of examination items. The 2026 plan is effective from April 1, 2026, through March 31, 2029.
Rather than organizing the examination around a traditional list of nursing courses, the test plan uses Client Needs categories. These categories reflect broad areas of responsibility associated with safe entry-level nursing practice.
The eight major content categories in the 2026 NCLEX-RN framework are:
Management of Care
Safety and Infection Prevention and Control
Health Promotion and Maintenance
Psychosocial Integrity
Basic Care and Comfort
Pharmacological and Parenteral Therapies
Reduction of Risk Potential
Physiological Adaptation
The first two are grouped within Safe and Effective Care Environment, while the remaining categories address health promotion, psychosocial needs, and physiological integrity.
These categories should not be interpreted as isolated subjects. Nursing problems frequently cross several categories. For example, caring for a client receiving insulin may involve pharmacological therapy, health education, risk reduction, nutrition, assessment, and clinical judgment. Similarly, caring for a postoperative client can require knowledge of physiological adaptation, reduction of risk potential, pain management, infection prevention, and management of care.
Management of Care focuses on coordinating and directing nursing care in a manner that protects the client and supports appropriate outcomes. Examples include delegation and supervision, client advocacy, continuity of care, informed consent, confidentiality, interdisciplinary collaboration, discharge planning, and prioritization. The 2026 test plan includes activities such as organizing workload, prioritizing care according to acuity, delegating appropriately, and evaluating delegated activities.
Safety and Infection Prevention and Control addresses protection from preventable injury, infection, and environmental hazards. Preparation in this area can involve standard precautions, transmission-based precautions, aseptic practices, medication safety, safe environments, and appropriate responses to hazards.
Health Promotion and Maintenance addresses nursing activities related to maintaining health, preventing disease, supporting normal development, and promoting appropriate health behaviors. This can involve topics such as developmental stages, preventive care, screening, reproductive health, and client education.
Psychosocial Integrity focuses on emotional, psychological, social, and behavioral dimensions of client care. Relevant knowledge can include therapeutic communication, coping, grief, mental health conditions, substance-related problems, abuse and neglect, behavioral changes, and psychosocial support.
Basic Care and Comfort concerns fundamental nursing care and the client’s physical comfort and functional needs. The 2026 test plan includes activities involving activities of daily living, nutrition, elimination, mobility, positioning, skin integrity, sleep, pain, comfort measures, and intake and output.
Pharmacological and Parenteral Therapies involves safe medication and parenteral care. Preparation should extend beyond memorizing drug names. Important areas include medication indications, contraindications, adverse effects, interactions, administration, calculations, monitoring, client education, evaluation of response, and high-risk medication safety. The 2026 test plan specifically includes reviewing relevant information such as allergies, laboratory findings, contraindications, and potential interactions before medication administration.
Reduction of Risk Potential concerns preventing complications and recognizing changes that may indicate developing problems. This includes interpreting vital-sign trends, monitoring diagnostic findings, performing focused assessments, evaluating responses to procedures, and identifying complications associated with treatments or conditions.
Physiological Adaptation focuses on caring for clients experiencing acute, chronic, or life-threatening alterations in physical health. Examples include impaired oxygenation, fluid and electrolyte disturbances, hemodynamic problems, emergency conditions, postoperative complications, wound care, dialysis, ventilatory support, and other complex physiological problems.
The important point for preparation is that the Client Needs categories provide a framework rather than a checklist to memorize. The 2026 test plan contains detailed content and activity statements within these categories, and clinical judgment is integrated into the examination rather than treated as a completely separate nursing subject.
This has a direct effect on how an NCLEX Study Plan should be organized. A preparation schedule that simply divides time according to traditional nursing courses may overlook important relationships between topics. A more useful approach is to use the test plan to identify the broad areas being assessed and then connect individual subjects to those areas.
For instance, a review session on heart failure might include:
Physiological Adaptation: Recognizing manifestations of worsening heart failure.
Reduction of Risk Potential: Monitoring oxygenation, fluid status, electrolytes, and complications.
Pharmacological and Parenteral Therapies: Understanding medications and monitoring their effects.
Basic Care and Comfort: Managing positioning, activity tolerance, nutrition, and symptom relief.
Management of Care: Prioritizing care when several clients require attention.
This integrated approach more closely resembles the way nursing decisions occur in practice and the way the NCLEX-RN assesses competence. It also helps prevent a common preparation problem: studying individual facts without understanding how those facts influence assessment, prioritization, intervention, and evaluation.
The 2026 test plan should therefore be treated as the foundation for NCLEX preparation, not merely as another document to read shortly before the examination. Reviewing it at the beginning of an NCLEX Study Plan helps establish what areas require attention, how study resources should be organized, and where practice should emphasize application rather than simple recall. The official NCSBN and NCLEX resources should remain the primary references for current examination information because the test plans are periodically updated to reflect current entry-level nursing competency expectations.
In practical terms, understanding the NCLEX-RN in 2026 means recognizing three connected features: the examination measures entry-level nursing competence, CAT adapts the examination to the candidate’s estimated ability, and the NGN places substantial emphasis on clinical judgment within the broader Client Needs framework. These features provide the foundation for developing a preparation approach that emphasizes knowledge, application, reasoning, and safe nursing decisions rather than memorization alone.
Creating an Effective NCLEX Study Plan
Creating an effective NCLEX Study Plan involves more than assigning nursing topics to particular days on a calendar. A useful plan should reflect the current level of knowledge, the amount of available study time, the examination timeline, and the areas that require the greatest attention. Because the NCLEX-RN evaluates the application of nursing knowledge and clinical judgment, preparation is most effective when it combines structured content review with deliberate practice and continuous evaluation.
A well-constructed NCLEX Study Plan should answer four practical questions:
Where am I now? — What knowledge, skills, and reasoning abilities are already strong, and where are the gaps?
Where am I going? — What is the examination date, and what preparation goals need to be achieved before then?
What should I study first? — Which NCLEX content and Client Needs areas require the greatest attention?
How should I organize my preparation? — How can available study time, resources, practice, and review be arranged into a realistic and sustainable plan?
This approach transforms preparation from an unstructured attempt to review everything into a deliberate process in which each study session has a specific purpose.
Assessing Your Strengths, Weak Areas, and Readiness
The first step in developing an NCLEX Study Plan is determining the current level of readiness. It is difficult to create an effective preparation schedule without knowing which areas are well understood and which require additional work. A person who recently completed nursing school may have strong recall of certain subjects but significant gaps in others. Another person who has been away from formal education for several months may need more foundational content review, even if they previously performed well academically.
Assessment should therefore be based on evidence rather than confidence alone.
A useful initial assessment can include:
A diagnostic practice test.
Review of performance across different content areas.
Analysis of incorrect practice questions.
Identification of recurring knowledge gaps.
Evaluation of clinical judgment performance.
Review of medication and pharmacology knowledge.
Consideration of how consistently information can be recalled without notes.
Evaluation of the ability to apply knowledge to unfamiliar client situations.
A diagnostic assessment is particularly useful because overall percentages can hide important weaknesses. For example, someone might achieve 70% on a practice assessment but perform very differently across categories:
Area
Example performance
Interpretation
Management of Care
82%
Relative strength
Pharmacological and Parenteral Therapies
61%
Requires focused review
Reduction of Risk Potential
58%
Significant review needed
Psychosocial Integrity
79%
Relative strength
Clinical judgment
Inconsistent
Requires additional case-based practice
The purpose of this analysis is not to label a person as “ready” or “not ready.” Instead, it establishes a starting point from which the NCLEX Study Plan can be developed.
It is also important to distinguish between a knowledge deficit and a test-taking or reasoning problem. Missing a question about digoxin because its therapeutic considerations are unfamiliar represents a different problem from missing the same question because the candidate failed to recognize which client required immediate attention.
For example, consider a question involving four clients:
One client has chronic, stable hypertension.
One client reports mild postoperative pain.
One client has new-onset confusion and an oxygen saturation that has fallen from baseline.
One client requires routine discharge teaching.
If the candidate knows the relevant nursing concepts but repeatedly selects the stable client rather than the client with an acute change in condition, the primary problem may involve prioritization rather than a lack of factual knowledge.
This distinction should influence the study strategy. Knowledge gaps require targeted learning and review, whereas reasoning difficulties require more application-based practice.
Readiness should also be viewed as multidimensional. It may include:
Content readiness: The candidate understands the major nursing concepts represented in the examination framework.
Application readiness: The candidate can use nursing knowledge when information is presented in an unfamiliar context.
Clinical judgment readiness: The candidate can recognize relevant cues, analyze information, prioritize hypotheses, generate appropriate solutions, take action, and evaluate outcomes.
Testing readiness: The candidate can maintain concentration, interpret different question types, manage time, and make decisions without becoming overwhelmed.
Consistency: Performance remains reasonably stable across multiple practice sessions rather than depending on one unusually strong or weak result.
A common mistake is to begin an NCLEX Study Plan by studying the easiest subjects because they feel comfortable. Although maintaining strengths is important, preparation time should also address areas that have the greatest potential to affect performance.
For example, if medication safety is consistently weak, spending several additional sessions reviewing a topic that is already well understood may provide less benefit than targeted pharmacology review combined with medication-related practice questions.
The assessment stage should therefore produce a clear list of:
Strong areas that require maintenance.
Moderate areas that require structured review.
Weak areas that require intensive attention.
Reasoning problems that require practice rather than memorization.
Topics requiring ongoing monitoring throughout the preparation period.
This creates an evidence-based starting point for the remainder of the NCLEX Study Plan.
Setting Your Study Timeline and Goals
Once readiness has been assessed, the next step is establishing a realistic preparation timeline. The amount of study time required varies considerably. There is no universal number of days or hours per day that guarantees success because preparation needs depend on prior knowledge, examination familiarity, available time, and individual performance.
The exam date should serve as the anchor for the plan. Working backward from that date makes it possible to determine what should be completed each week and prevents preparation from becoming concentrated into the final few days.
A useful timeline can be divided into three broad phases:
Phase 1: Foundation and assessment
The initial period focuses on understanding the examination framework, reviewing foundational nursing concepts, identifying weak areas, and establishing a baseline through practice.
Phase 2: Integration and application
The middle period emphasizes applying knowledge through nclex practice, case studies, clinical judgment exercises, and targeted review of persistent weaknesses.
Phase 3: Consolidation and readiness
The final period focuses on reinforcing high-priority information, completing realistic practice assessments, addressing remaining gaps, and preparing for the practical and psychological demands of exam day.
For example, a 3-month NCLEX Study Plan could be organized as follows:
Period
Primary focus
Weeks 1–2
Diagnostic assessment and foundational review
Weeks 3–7
Systematic content review and daily practice
Weeks 8–10
Integrated practice, NGN case studies, and weak-area remediation
Weeks 11–12
Full-length practice, final review, and readiness preparation
The exact distribution can be modified according to performance. Someone with substantial content gaps may need a longer foundation phase, while someone with strong baseline knowledge may move more quickly toward application and practice.
Goals should also be specific enough to measure. “Study pharmacology” is a broad intention rather than a useful goal. A more effective goal might be:
“Review cardiovascular medications, focusing on indications, major adverse effects, contraindications, nursing assessments, and client teaching, then complete 30 related practice questions and review every rationale.”
This goal identifies what will be studied, how it will be studied, and how understanding will be evaluated.
Good preparation goals can address several dimensions:
Content goals: Complete a defined topic or group of related concepts.
Practice goals: Complete a manageable number of questions with careful rationale review.
Clinical judgment goals: Complete case studies and explain the reasoning behind each decision.
Remediation goals: Revisit concepts repeatedly missed during practice.
Readiness goals: Demonstrate consistent performance across practice assessments.
Goals should be challenging without being unrealistic. Setting an arbitrary target of several hundred questions every day may appear productive but can reduce the quality of review. Completing fewer questions carefully, understanding why each answer is correct or incorrect, and identifying patterns in mistakes may produce more meaningful learning.
The timeline should also contain flexibility. Illness, work obligations, family responsibilities, fatigue, or unexpected academic commitments can disrupt a rigid schedule. A resilient NCLEX study schedule allows missed sessions to be redistributed without turning one disrupted day into a reason to abandon the entire plan.
Prioritizing NCLEX Content for Review
The NCLEX-RN test plan should provide the foundation for determining what needs to be reviewed. Preparation should not be based solely on personal preferences or the topics that happen to appear most frequently in a commercial question bank.
The Client Needs categories provide a broad framework for organizing the examination content. These categories include:
Management of Care
Safety and Infection Prevention and Control
Health Promotion and Maintenance
Psychosocial Integrity
Basic Care and Comfort
Pharmacological and Parenteral Therapies
Reduction of Risk Potential
Physiological Adaptation
These areas should not be studied as completely independent subjects. Nursing situations frequently involve multiple categories simultaneously. For example, caring for a client with heart failure can require knowledge of physiological adaptation, pharmacology, risk reduction, nutrition, safety, assessment, and management of care.
Prioritization should therefore consider three factors:
1. Importance to the examination framework
Areas represented within the official test plan should form the structural basis of preparation.
2. Individual performance
Topics repeatedly missed during diagnostic assessments and practice should receive additional attention.
3. Clinical importance
High-risk concepts involving deterioration, safety, medication administration, prioritization, and recognition of complications deserve careful attention because they are closely connected to safe entry-level nursing practice.
This does not mean attempting to predict exactly which subjects will appear on the examination. The NCLEX is adaptive, and individual candidates receive different combinations of items. The goal is to establish broad competence rather than predict specific exam questions.
A practical priority system can be useful:
High priority: Consistently weak areas, safety-critical concepts, major knowledge gaps, and concepts that affect clinical decision-making.
Moderate priority: Topics that are understood but inconsistently applied.
Maintenance priority: Areas in which performance is consistently strong but that still require periodic review.
For example, suppose a candidate performs well in psychosocial integrity but repeatedly struggles with fluid and electrolyte disturbances, medication safety, and prioritization. The NCLEX Study Plan should not allocate equal time to all three areas simply because each is part of nursing education. More time should be directed toward the areas where performance indicates a genuine need.
At the same time, prioritizing weak areas does not mean abandoning strengths. Strong areas can be maintained through intermittent practice, while intensive study time is reserved for weaker domains.
Another useful principle is to prioritize concepts rather than isolated facts. Understanding fluid volume deficit, for example, is more useful than memorizing a disconnected list of symptoms because the underlying concept can be applied to different client situations.
The same principle applies to management of care and prioritization. Rather than memorizing that one particular client type should always be seen first, preparation should emphasize the principles behind prioritization—such as acute versus chronic conditions, unexpected versus expected findings, airway and breathing concerns, safety threats, changes from baseline, and the need for immediate intervention.
This conceptual approach makes the preparation more transferable because the wording and clinical context of an nclex question can change even when the underlying nursing principle remains the same.
Personalizing Your Study Plan
An effective NCLEX Study Plan should be personalized because preparation circumstances differ considerably from one person to another. A standardized schedule can provide a useful starting point, but it cannot account for differences in knowledge, learning preferences, previous examination experience, responsibilities, or available study time.
Personalization begins with the information gathered during the initial assessment. If the assessment shows strong knowledge but weak clinical judgment, the plan should contain more application and case-based practice. If the primary difficulty is foundational knowledge, more time should be allocated to structured content review before increasing the intensity of practice.
Shorter practice sets followed by targeted remediation.
Candidate C: Strong knowledge but limited study time
The plan might emphasize:
High-yield content.
Short, focused study sessions.
Daily practice.
Spaced review.
Careful prioritization of weak areas.
Flexible scheduling around work or other responsibilities.
Personalization also involves deciding how study sessions should be structured. A two-hour session, for example, could be divided into:
20 minutes: Review previously learned material.
45 minutes: Study a targeted nursing concept.
35 minutes: Complete related practice questions.
20 minutes: Review rationales and record remaining gaps.
The proportions can change according to performance. If content knowledge is already strong, more of the session can be devoted to practice and clinical judgment. If foundational knowledge remains weak, additional time may need to be allocated to learning and reviewing concepts.
A personalized plan should also specify how progress will be monitored. A simple study planner can track:
Area
Initial status
Current status
Next action
Pharmacology
Weak
Improving
Continue targeted review
Management of Care
Moderate
Strong
Maintenance practice
Clinical judgment
Weak
Moderate
More NGN case studies
Safety
Strong
Strong
Periodic review
This makes the NCLEX Study Plan dynamic rather than static. The original schedule should not be treated as a contract that must be followed regardless of results. If repeated practice demonstrates improvement in one area, study time can be redirected toward another. If a topic remains weak despite repeated review, the learning method may need to change.
Personalization also means recognizing the difference between time spent studying and effective learning. Six unfocused hours of reading may be less productive than three concentrated hours that include active recall, application, practice, and feedback. The objective is therefore not to maximize the number of hours on the calendar but to use available time deliberately.
Finally, the plan should leave room for cumulative review. Previously studied material should return periodically rather than being considered complete after one session. This helps reinforce information while allowing new concepts to be integrated with older knowledge.
A strong NCLEX Study Plan is therefore best viewed as a living preparation framework. It begins with an honest assessment of strengths and weaknesses, establishes measurable goals around the examination timeline, uses the NCLEX-RN test plan to organize priorities, and adapts according to performance. This approach allows preparation to remain focused while still providing enough flexibility to respond to changing needs throughout the period of NCLEX preparation.
Building Your NCLEX Study Schedule
A well-designed NCLEX Study Plan needs a realistic study schedule that translates broad preparation goals into specific periods of learning, practice, review, and recovery. Knowing what to study is only one part of NCLEX preparation; candidates also need to determine when they will study, how long each study session will last, and how different activities will be distributed throughout the weeks leading to the NCLEX exam.
An effective NCLEX study schedule should not be based simply on the largest possible number of study hours. More hours do not automatically produce better learning. A candidate who spends six unfocused hours rereading notes may gain less than someone who spends two focused hours actively recalling information, answering practice questions, reviewing rationales, and correcting weak areas. Research in health professions education supports distributed practice and retrieval practice as useful learning approaches, with systematic-review evidence showing benefits over comparison approaches in many studies.
The goal, therefore, is to create a schedule that provides sufficient study time while maintaining active engagement and allowing previously learned material to be revisited. This is particularly important for the NCLEX-RN, where candidates must apply nursing knowledge and clinical judgment rather than simply recognize isolated facts.
The 2026 NCLEX-RN Test Plan should serve as the academic framework behind the schedule. NCSBN identifies the test plan as a guide for both examination development and candidate preparation, so an NCLEX Study Plan should be organized around the examination’s Client Needs categories, integrated processes, and clinical judgment expectations rather than around an arbitrary list of textbook chapters.
Daily and Weekly Study Schedule
A daily and weekly schedule gives an NCLEX Study Plan structure. Instead of approaching preparation with the vague goal of “studying NCLEX every day,” the candidate can identify exactly what will be accomplished during each study session.
A useful daily schedule generally combines several activities rather than assigning the entire session to passive content review. For example, a two-hour study session could include:
20–30 minutes of content review: Review one focused topic such as heart failure, diabetes, infection prevention, or medication safety.
30–45 minutes of NCLEX practice: Complete a targeted set of NCLEX-style questions.
30–40 minutes of rationale review: Examine both correct and incorrect answers and determine why each option was or was not appropriate.
15–20 minutes of active recall: Close the study materials and explain key concepts from memory.
10–15 minutes of remediation: Record important mistakes, confusing concepts, or topics requiring another review.
This structure prevents the study session from becoming an extended reading exercise. Retrieval practice is particularly relevant because research in nursing education has examined recalling information from memory as a learning strategy, while broader health-professions research has found benefits from test-enhanced learning.
For example, a nursing graduate studying pharmacology might spend the first part of the session reviewing insulin administration and hypoglycemia. The candidate could then answer 20 pharmacology questions, review the rationale for every question, and finish by writing down the signs requiring immediate intervention. The following day, the candidate should briefly retrieve the information again rather than waiting until the end of the month to revisit it.
The exact number of questions per day should be individualized. A candidate preparing several months in advance may begin with 20–40 questions, while a candidate closer to the exam date may gradually increase the amount of timed practice. The purpose is not to reach an impressive daily number but to make each question educational.
A useful rule is:
Practice questions should generate learning, not merely produce a score.
If a candidate completes 100 questions but reviews almost none of the rationales, the numerical achievement may have limited educational value. Conversely, completing 30 carefully selected questions and understanding the reasoning behind every answer can provide substantial NCLEX study value.
A weekly schedule should also contain different types of study days. For example:
Day
Primary Focus
Secondary Activity
Monday
Management of Care
Practice questions
Tuesday
Pharmacological and Parenteral Therapies
Medication review
Wednesday
Physiological Adaptation
NGN practice
Thursday
Safety and Infection Prevention and Control
Prioritization questions
Friday
Health Promotion and Maintenance
Mixed practice
Saturday
Comprehensive practice
Weak-area remediation
Sunday
Light cumulative review
Rest and planning
This is only an example rather than a mandatory NCLEX study schedule. The actual distribution should reflect the candidate’s diagnostic results. A candidate who performs well in Health Promotion and Maintenance but struggles with Physiological Adaptation should not devote identical amounts of time to both simply because they appear on a calendar.
A weekly review period is also valuable. At the end of each week, the candidate can examine:
Which content areas were studied?
How many questions were completed?
Which question types caused the most difficulty?
Which concepts were repeatedly missed?
Were errors caused by missing knowledge, misreading, prioritization, or clinical judgment?
Which topics should move into the following week’s study schedule?
Is the current NCLEX Study Plan realistic?
This creates a feedback loop. The schedule should change as performance changes rather than remaining fixed for the entire NCLEX preparation period.
A candidate should also distinguish between study sessions designed for learning and longer practice sessions designed to develop endurance. Not every day needs to contain a full-length practice exam. Early in preparation, shorter sessions may be more productive because they allow the candidate to identify and correct weaknesses. Longer mixed-question sessions can be incorporated progressively as the NCLEX test approaches.
Another useful approach is cumulative review. If Monday focuses on cardiovascular disorders, the candidate should not permanently abandon cardiovascular content when Tuesday begins with endocrine disorders. A short retrieval activity later in the week can bring earlier material back into the schedule.
For example:
Monday: Heart failure content + cardiovascular questions Tuesday: Diabetes content + five cardiovascular recall questions Wednesday: Medication safety + five diabetes recall questions Thursday: Respiratory disorders + five cardiovascular questions Friday: Mixed questions from all four topics
This type of spacing helps prevent the common problem of learning a topic temporarily and then forgetting it before exam day.
The weekly schedule should also include at least one lighter period. Rest is not wasted study time. Fatigue can reduce concentration, increase careless errors, and make long study sessions less productive. A sustainable NCLEX Study Plan therefore treats recovery as part of preparation rather than as an obstacle to it.
Three-Month NCLEX Study Schedule
A 3-month NCLEX study plan can provide enough structure for candidates who want a defined preparation period while still allowing flexibility based on their baseline knowledge. The three months should not be treated as three identical blocks. Each phase should have a different purpose.
A practical three-month NCLEX Study Plan can be divided into:
Month 1: Foundation and Identification of Weak Areas
The first month should establish the candidate’s baseline and organize the major areas requiring attention. The emphasis should be on understanding core nursing concepts rather than attempting to memorize every possible fact that could appear on the NCLEX-RN.
During this phase, the candidate can:
Review the 2026 NCLEX-RN Test Plan.
Complete a diagnostic set of NCLEX practice questions.
Identify strong, moderate, and weak content areas.
Review fundamental nursing concepts.
Begin regular pharmacology review.
Introduce NGN-style questions and case studies.
Establish a consistent study routine.
Begin recording recurring errors.
Practice prioritization and clinical judgment.
For example, a candidate might discover that pharmacology knowledge is relatively strong but that questions involving delegation, prioritization, and multiple client needs are consistently missed. In that situation, the NCLEX Study Plan should not simply allocate more hours to pharmacology because it feels familiar. More preparation should be directed toward the reasoning skills that are limiting performance.
Month 2: Integration and Application
The second month should shift from predominantly learning information to applying it.
The candidate can increase the proportion of mixed NCLEX questions, integrate different content areas, and spend more time on Next Generation NCLEX case studies. The objective is to become comfortable moving between knowledge, interpretation, prioritization, and clinical decision-making.
A typical week during this phase might include:
Two or three focused content-review sessions.
Several mixed-question sessions.
Dedicated NGN case-study practice.
Pharmacology reinforcement.
Prioritization and delegation practice.
Remediation of recurring weak areas.
One longer timed practice session.
The candidate should avoid dividing preparation into completely isolated subjects. A single clinical scenario can involve assessment, pharmacology, safety, psychosocial care, patient education, prioritization, and clinical judgment simultaneously. The NCLEX-RN Test Plan similarly organizes examination content around Client Needs while incorporating processes such as clinical judgment across those categories.
For example, a case involving a client with pneumonia may require the candidate to recognize abnormal respiratory findings, identify the most urgent concern, interpret vital signs, consider medication effects, prioritize nursing interventions, and evaluate whether the client is improving. The candidate is therefore practicing several dimensions of nursing practice rather than memorizing “pneumonia” as a single isolated topic.
Month 3: Consolidation, Practice, and Readiness
The final month should emphasize integration, retention, and application. At this point, the candidate should spend less time attempting to learn every remaining topic from scratch and more time strengthening knowledge that is clinically important and repeatedly weak.
The NCLEX Study Plan during this phase can include:
Mixed NCLEX practice questions.
Timed question sets.
Full-length or extended practice sessions.
NGN case studies.
Cumulative pharmacology review.
Prioritization and delegation practice.
Review of recurring errors.
Targeted content remediation.
Increasing familiarity with exam-day procedures.
Gradual reduction of heavy studying immediately before the examination.
The final month should not become an endless cycle of taking practice exams. Practice performance is most useful when it produces information that can be acted upon. If a candidate repeatedly misses questions about fluid and electrolyte imbalance, the appropriate response is not simply to take another 100-question test. The candidate should identify the underlying knowledge or reasoning problem, review the relevant concept, practice targeted questions, and then reassess.
A three-month framework can therefore look like this:
The schedule should become progressively more application-oriented. Early NCLEX study may require substantial content review because the candidate needs to rebuild foundational knowledge. Later preparation should increasingly ask the candidate to use that knowledge in unfamiliar situations.
For example, early preparation might involve reviewing the differences between hypoglycemia and hyperglycemia. Later preparation should require the candidate to interpret a client’s symptoms, laboratory findings, medication history, and clinical status and determine what action is most appropriate.
This progression is especially important for the Next Gen NCLEX, because clinical judgment is explicitly measured through case-study items and stand-alone items.
The three-month schedule should also contain flexibility. If a candidate finishes Month 1 and discovers significant weaknesses in several areas, moving directly into the Month 2 plan may be inappropriate. The schedule can be adjusted to provide additional remediation.
Likewise, if a candidate demonstrates strong performance earlier than expected, excessive repetition of mastered material may not be the best use of study time. The NCLEX study schedule should respond to evidence rather than forcing the candidate to follow a calendar mechanically.
Creating an Effective NCLEX Study Plan
Balancing Study Time With Nursing School and Other Responsibilities
One of the greatest challenges in NCLEX preparation is that candidates rarely study in isolation. Nursing students may be completing lectures, clinical rotations, assignments, examinations, and skills evaluations. Nursing graduates may be working full-time, preparing for licensure, managing family responsibilities, or adjusting to employment after graduation.
For this reason, an effective NCLEX Study Plan must account for the candidate’s actual life rather than an idealized schedule.
A schedule that requires eight hours of daily study may look impressive on paper but may be impossible for someone working 40 hours per week. A more realistic plan might involve two focused hours on workdays and longer sessions on selected days off.
For example, a working nursing graduate might use:
Day
Available Time
NCLEX Focus
Monday
1.5 hours
Content review + 20 questions
Tuesday
1.5 hours
Pharmacology + rationales
Wednesday
1 hour
Mixed questions + remediation
Thursday
1.5 hours
NGN case study + review
Friday
1 hour
Cumulative recall
Saturday
3 hours
Extended practice + weak areas
Sunday
2 hours
Mixed practice + weekly review
This provides approximately 11.5 hours of structured preparation without requiring the candidate to study for most of the day.
A nursing student with clinicals might use an entirely different approach. On a demanding clinical day, the goal may be a short 30–45-minute retrieval session rather than a lengthy content review. On a less demanding day, the candidate can complete a longer study session.
The important principle is consistency rather than perfection.
If a candidate misses one scheduled study session, the appropriate response is not to double the workload the following day. Excessive catch-up can create fatigue and make the entire schedule difficult to maintain. Instead, the candidate can move the highest-priority activity to another available period and continue with the plan.
A practical way to balance responsibilities is to divide activities into three levels:
Essential activities are tasks that should occur consistently, such as targeted NCLEX practice questions, remediation of important weaknesses, and cumulative review.
Flexible activities can be moved when the week becomes busy. Examples include additional content reading, supplemental videos, or extra question sets.
Optional activities are useful only when time and energy permit. These might include additional review resources or extended study sessions after the day’s primary objectives have been completed.
This distinction protects the most important components of the NCLEX Study Plan when unexpected responsibilities arise.
Candidates can also use short study periods effectively. A 20-minute period may be sufficient to:
Complete 5–10 focused questions.
Review five medications.
Recall a previously studied disease process.
Review one set of rationales.
Practice one short clinical judgment scenario.
Review common laboratory values or safety principles.
Short sessions should not be viewed as inferior simply because they are short. Their value increases when they are focused and repeated over time. Distributed practice involves spreading learning across time rather than concentrating it into one large session, and evidence from health professions education supports the use of distributed and retrieval-based approaches.
Another important consideration is protecting time for sleep and recovery. Candidates sometimes respond to anxiety by sacrificing sleep to increase study time. This can be counterproductive because preparation requires sustained attention, memory retrieval, reasoning, and decision-making. A schedule should therefore provide a realistic stopping point rather than encouraging continuous studying.
Technology can also make a schedule easier to maintain. A digital calendar, paper study planner, or simple spreadsheet can be used to identify study periods and record completed objectives. The tool itself is less important than whether the candidate uses it consistently.
A useful weekly planning process is:
Identify fixed commitments such as work, clinicals, classes, appointments, and family responsibilities.
Identify realistic study periods around those commitments.
Assign each study period a specific objective.
Reserve time for practice and remediation.
Include cumulative review.
Schedule at least one lighter period.
Review the week’s performance.
Adjust the following week according to actual needs.
For example, instead of writing “study pharmacology” in a calendar, a more useful entry would be:
Tuesday, 7:00–8:30 p.m.: Review insulin safety, complete 20 pharmacology questions, review all rationales, and record recurring errors.
The second version tells the candidate exactly what successful completion looks like.
Balancing responsibilities also requires recognizing that different candidates need different amounts of preparation. A nursing graduate who recently completed school may have strong recall of core nursing concepts but need intensive test-taking and clinical judgment practice. Another candidate who has been away from nursing school for several years may need more extensive content review before emphasizing question volume.
The NCLEX Study Plan should therefore be personalized according to baseline knowledge, available study time, performance data, and the candidate’s exam date.
The strongest schedule is not necessarily the most demanding schedule. It is the schedule that a candidate can follow consistently while progressively improving knowledge, application, clinical judgment, and confidence. By combining realistic daily commitments, structured weekly goals, a phased three-month framework, and flexibility for nursing school or personal responsibilities, candidates can make their NCLEX Study Plan sustainable throughout the preparation period.
NCLEX Study Resources and Preparation Materials
Choosing appropriate NCLEX study resources is an important part of building an effective NCLEX Study Plan. Nursing graduates often have access to textbooks, lecture notes, question banks, review books, mobile applications, videos, flashcards, podcasts, online courses, and numerous websites. The challenge is not finding something to study; it is determining which materials are accurate, relevant to the current NCLEX-RN, and useful for developing the knowledge and clinical judgment required for safe entry-level nursing practice.
The best NCLEX study materials should complement the official examination framework rather than replace it. The 2026 NCLEX-RN Test Plan is particularly important because it describes the content categories, clinical judgment expectations, and scope of the examination. NCSBN states that the test plan serves both as a guide for examination development and as a resource for candidates preparing for the exam. The 2026 RN Test Plan is effective from April 1, 2026, through March 31, 2029.
This means an NCLEX Study Plan should not be built around whichever commercial review book or question bank happens to be most popular. Instead, candidates should use the test plan as the framework and select supplementary materials that help them master the concepts and behaviors represented within that framework.
A strong collection of NCLEX study resources generally contains four components:
An authoritative examination framework, particularly the current NCLEX-RN Test Plan.
A dependable source for nursing content review.
A high-quality bank of NCLEX-style practice questions.
Resources that specifically develop clinical judgment and Next Generation NCLEX skills.
Additional materials such as pharmacology references, flashcards, videos, audio lessons, and free online resources can then be added according to individual learning needs.
The number of resources should also be controlled. Collecting multiple study guides does not necessarily improve NCLEX preparation. In fact, using too many resources can make preparation fragmented because candidates may encounter slightly different explanations, terminology, or priorities across materials. It is usually more productive to select a small group of reliable resources and use them consistently.
NCLEX Study Guides and Review Materials
An NCLEX study guide is most useful when it organizes essential nursing knowledge in a way that supports application rather than simply presenting large amounts of information. A review resource should help the candidate understand the concepts that underpin safe nursing practice and then connect those concepts to NCLEX questions.
The 2026 NCLEX-RN Test Plan should be the starting point for evaluating any study guide. The test plan includes the major Client Needs categories and provides detailed content examples and information about clinical judgment.
A good study guide should therefore make it reasonably easy to review topics such as:
Management of Care
Safety and Infection Prevention and Control
Health Promotion and Maintenance
Psychosocial Integrity
Basic Care and Comfort
Pharmacological and Parenteral Therapies
Reduction of Risk Potential
Physiological Adaptation
The purpose is not to memorize the headings themselves. The purpose is to use them to organize the nursing knowledge that supports clinical decision-making.
For example, when studying heart failure, a candidate should not stop after memorizing the definition of the condition. The review material should help the learner understand assessment findings, expected manifestations, complications, medications, fluid management, patient education, and nursing priorities. The candidate should then be able to apply those concepts to an NCLEX question involving a client whose condition is deteriorating.
This illustrates an important distinction between content review and exam preparation.
Content review answers:
What do I need to know?
NCLEX preparation asks:
How do I use what I know to make a safe nursing decision?
Both are necessary.
A useful study guide should also support progressive review. Candidates can first use it to establish foundational knowledge, then return to selected sections when practice questions reveal a knowledge deficit.
For example, a candidate might answer a question about a client receiving warfarin and realize that the problem is not simply difficulty with the question. The candidate may actually have an incomplete understanding of anticoagulation, bleeding precautions, medication interactions, or laboratory monitoring. The study guide can then be used for targeted remediation.
This makes the study guide part of a larger learning cycle:
Question → identify the gap → review the concept → apply the concept → reassess.
A review book should therefore not be treated as a textbook that must be read from beginning to end before answering any questions. Candidates who already have strong knowledge in certain areas may benefit more from targeted review.
Another useful feature is organization by nursing concepts rather than excessive detail. An NCLEX study guide does not need to reproduce everything learned during nursing school. The candidate needs material that helps consolidate essential information and recognize how that information affects patient care.
For example, a useful respiratory review should connect:
This structure encourages clinical reasoning instead of isolated memorization.
Candidates should also distinguish between official information and third-party review content. The official NCSBN and NCLEX resources should take precedence whenever information about examination structure, policies, registration, administration, or the current NCLEX-RN test plan is involved. NCSBN’s 2026 Candidate Bulletin provides information about registration, examination rules, results processing, and related candidate procedures.
Commercial or independently produced study materials can be valuable for teaching and practice, but they should be regarded as supplementary study materials, not as replacements for official examination information.
NCLEX Practice Questions and NGN Case Studies
NCLEX practice questions are among the most important preparation tools because they require candidates to retrieve knowledge and apply it to clinical situations. Practice testing is supported by research in health professions education, and a systematic review of distributed practice and retrieval practice found that many included studies demonstrated benefits compared with control or comparison approaches.
However, simply completing large numbers of practice questions is not enough. The educational value of a question depends heavily on what the candidate does afterward.
A productive question-review process involves four stages:
Answer the question independently.
Determine why the selected answer was appropriate or inappropriate.
Review the rationale for every relevant option.
Identify the underlying knowledge or reasoning issue.
For example, suppose a candidate chooses an incorrect intervention for a client with respiratory distress. The mistake could result from several different problems:
The candidate does not know the relevant pathophysiology.
The candidate failed to recognize an abnormal finding.
The candidate recognized the problem but selected an intervention that was not the priority.
The candidate misunderstood the wording of the question.
The candidate knew the appropriate intervention but changed the answer because of uncertainty.
These are different learning problems and require different remediation.
A question bank should therefore be judged by more than its number of questions. A useful NCLEX practice resource should provide clear rationales, clinically appropriate explanations, varied question types, and opportunities to practice different levels of nursing reasoning.
Candidates should also avoid becoming overly dependent on memorizing question patterns. The actual NCLEX exam is administered using computerized adaptive testing, meaning candidates encounter an individualized sequence of items. Memorizing answers from a question bank does not prepare a candidate for unfamiliar clinical situations. The goal of practice is to develop transferable reasoning.
NGN case studies are particularly important because the Next Generation NCLEX was designed to better measure clinical judgment and uses real-world case studies and innovative item formats.
A case study may require the candidate to work through a clinical situation rather than answer a completely isolated question. This creates an opportunity to practice recognizing important information, interpreting changes in patient status, determining priorities, selecting appropriate actions, and evaluating outcomes.
For example, consider a client admitted with an infection who subsequently develops:
increasing temperature,
altered mental status,
tachycardia,
decreasing blood pressure,
reduced urine output.
A traditional content review might ask the candidate to identify manifestations of systemic deterioration. NGN case-study practice, however, can require the candidate to interpret the changing clinical picture and determine which findings are most concerning, what additional information matters, what action should occur, and whether the intervention produced the expected outcome.
This is closer to the reasoning process expected of a registered nurse.
The NCLEX Study Plan should therefore include both stand-alone questions and case studies. Stand-alone questions help reinforce specific concepts and question types, while case studies allow candidates to practice integrating multiple findings within a developing clinical situation.
Candidates should also practice different question formats. The purpose is not to memorize the appearance of each item but to become comfortable processing information when the response format changes.
For example, a candidate may encounter questions requiring:
Selection of one best response.
Selection of multiple appropriate responses.
Interpretation of clinical information.
Identification of important findings.
Ordering or sequencing of actions.
Evaluation of patient outcomes.
Application of information across several related case-study items.
The exact format should always be learned from current official NCLEX materials rather than outdated preparation books.
A particularly useful habit is to ask a clinical-judgment question after each practice item:
What information in this question actually matters to the patient’s safety?
The candidate can then identify the relevant cues, connect them to the clinical situation, establish priorities, and determine an appropriate nursing response.
This approach transforms NCLEX practice questions from a scoring exercise into a clinical reasoning exercise.
Another important principle is to review incorrect answers without ignoring correct ones. A correct answer obtained through guessing does not demonstrate reliable knowledge. Candidates should therefore distinguish among:
Correct and confident: concept appears well understood.
Correct but uncertain: concept needs reinforcement.
Incorrect because of knowledge deficit: content review is required.
Incorrect because of reasoning: clinical judgment or prioritization needs work.
Incorrect because of question interpretation: test-taking skills need attention.
This classification makes practice data much more useful for the NCLEX study plan.
Pharmacology and High-Yield Nursing Resources
Pharmacology deserves a prominent place in NCLEX preparation, but studying medications solely through long lists of drug names can become inefficient. The more useful approach is to organize medications around their clinical purpose, major effects, important adverse effects, safety considerations, and nursing implications.
For each medication or medication class, candidates can ask:
What is the medication used to treat?
What is its expected therapeutic effect?
What important adverse effects should the nurse recognize?
What assessment findings require attention?
What laboratory or diagnostic information may be relevant?
What client teaching is important?
What contraindications, precautions, or interactions matter?
What findings indicate toxicity or treatment failure?
For example, rather than memorizing a drug name without context, a candidate studying an antihypertensive medication should understand what effect the medication is intended to produce, what assessment findings should be monitored, what adverse effects are clinically significant, and what patient education may be required.
This approach makes pharmacology more useful for NCLEX questions, because medication questions often involve patient assessment, safety, adverse effects, interactions, and nursing actions rather than simple identification of a drug’s name.
High-yield nursing resources can also be organized around frequently integrated clinical concepts, such as:
Fluid and electrolyte balance.
Acid-base principles.
Infection prevention.
Cardiovascular emergencies.
Respiratory deterioration.
Neurological assessment.
Endocrine disorders.
Renal function.
Gastrointestinal conditions.
Maternal and newborn care.
Pediatric nursing.
Mental health nursing.
Emergency and prioritization concepts.
Delegation and assignment principles.
Patient safety.
These topics should not be considered a substitute for the complete NCLEX content. “High-yield” should mean that a topic is important to understand and frequently connects with other nursing concepts—not that everything outside the list can safely be ignored.
For example, fluid and electrolyte concepts can appear in questions involving renal disease, heart failure, gastrointestinal losses, endocrine disorders, medication effects, postoperative complications, and critical illness. Learning the underlying principles therefore provides broader value than memorizing isolated laboratory values.
Similarly, infection prevention can intersect with isolation precautions, wound care, invasive devices, medication administration, postoperative care, and patient education.
A strong NCLEX Study Plan should therefore use high-yield resources to build connections among concepts.
Flashcards can be useful for factual information that genuinely benefits from repeated retrieval. Examples include medication classes, selected laboratory values, antidotes, precautions, terminology, and other information that must be recalled efficiently.
However, flashcards should not become the entire study strategy. Clinical judgment requires more than remembering facts. A candidate may know that a medication can cause hypotension but still need to determine whether a client’s current blood pressure, symptoms, and clinical context make the finding an immediate concern.
Research in health professions education supports retrieval practice, and recent evidence also supports spaced repetition as a useful approach for learning and retention, although the precise optimal implementation can vary.
A practical pharmacology routine might therefore look like:
Day 1: Learn a medication class. Day 3: Recall the mechanism and major safety concerns without looking at notes. Day 7: Answer medication-related questions. Day 14: Revisit the class during mixed NCLEX practice. Later: Apply the medication knowledge to a patient case.
This is more robust than reading the same medication list repeatedly.
Candidates should also be cautious with resources that promise to reveal the “exact” questions appearing on the NCLEX test. Legitimate preparation should focus on nursing knowledge, clinical judgment, and familiarity with the examination framework rather than attempting to predict or obtain secure examination content.
Free NCLEX Study Resources
A strong NCLEX Study Plan does not necessarily require a large financial investment. Several authoritative resources are available without purchasing a comprehensive commercial prep course.
The first resource candidates should explore is the official NCLEX/NCSBN material. The current 2026 NCLEX-RN Test Plan provides the examination framework, including Client Needs categories and clinical judgment information.
The official NCLEX Candidate Bulletin is also valuable because it provides information candidates need before and after the examination, including registration-related information, candidate rules, and results processing.
Candidates can also use official preparation materials available through the NCLEX platform, including examination information and sample preparation resources. These materials are particularly important when a third-party resource provides information that conflicts with current official guidance.
A useful free-resource collection may include:
Free Resource
Best Use
2026 NCLEX-RN Test Plan
Understanding exam content and structure
NCSBN Candidate Bulletin
Registration, rules, and examination procedures
Official NCLEX preparation materials
Familiarity with examination expectations
Nursing school notes
Rebuilding foundational knowledge
Previous course materials
Reviewing difficult concepts
Personal medication notes
Pharmacology reinforcement
Self-created flashcards
Retrieval practice
Error log
Tracking recurring weaknesses
Free practice questions from reputable educational sources
Additional application practice
Nursing school resources can be particularly valuable because they are already familiar to the candidate. A graduate who struggled with cardiac nursing, for example, may have lecture notes, concept maps, care plans, or faculty resources that explain the topic in greater depth than a condensed NCLEX study guide.
However, free does not automatically mean reliable. Candidates should evaluate online materials carefully.
Before using a free NCLEX study resource, ask:
Is the information current?
Does it reflect the current NCLEX-RN and Next Generation NCLEX?
Is the author or organization identifiable?
Are clinical claims consistent with reputable nursing references?
Are practice-question rationales clinically sound?
Does the resource distinguish educational content from official NCLEX information?
Does it encourage understanding rather than memorization of answer patterns?
Does it clearly indicate when information was updated?
This matters because outdated resources can contain obsolete examination structures, outdated terminology, or approaches that do not reflect the current NCLEX test plan.
Candidates should be particularly careful with older resources that describe the examination as though the pre-NGN version were still current. The Next Generation NCLEX has been in use since April 1, 2023, and the current preparation approach should account for clinical judgment and NGN item formats.
Free resources can also be combined strategically instead of used randomly. For example, a candidate could use the official test plan to identify the target content, nursing school notes for foundational review, a reputable free question source for application, and self-created flashcards for difficult factual information.
An example might look like this:
Target: Pharmacological and Parenteral Therapies
Primary framework: 2026 NCLEX-RN Test Plan
Content source: Existing pharmacology notes
Active learning: Self-created medication flashcards
Application: Reputable NCLEX-style questions
Remediation: Review the rationale and return to the relevant pharmacology concept
Follow-up: Re-test the concept later using mixed questions
This creates a complete learning cycle without requiring multiple paid products.
Candidates should also avoid measuring the quality of their preparation by the amount of material they have collected. Ten study guides, five question banks, several video subscriptions, and hundreds of flashcards can create the appearance of preparation without producing mastery.
A smaller, carefully selected collection of study resources can be more effective:
Official framework + dependable content review + quality practice questions + NGN case studies + targeted remediation.
The resources should serve the NCLEX Study Plan, not become the plan themselves.
Most importantly, candidates should remember that no study guide, question bank, free resource, or prep course can guarantee a passing result. The purpose of preparation materials is to develop the knowledge, application skills, and clinical judgment expected of a newly licensed registered nurse. The official NCLEX framework should remain the reference point, while supplementary materials should help candidates understand, practice, and retain the material.
A well-selected collection of NCLEX study resources therefore supports a progression from learning to application:
Learn the concept → retrieve it from memory → answer an NCLEX-style question → analyze the rationale → apply the concept to a new situation → revisit it later.
This approach makes preparation more active and purposeful than simply reading through large volumes of review material. Research in health professions education supports the value of retrieval and distributed practice, reinforcing the importance of repeatedly recalling and applying information across the preparation period.
NCLEX Study Strategy and Practice
Having reliable study materials is only the beginning of effective NCLEX preparation. Candidates also need a deliberate strategy for turning those materials into knowledge, clinical reasoning, and consistent performance. An effective NCLEX Study Plan should therefore answer not only what the candidate will study, but also how the candidate will learn, practice, evaluate mistakes, and modify the plan when progress is slower than expected.
The NCLEX-RN is designed to measure the knowledge, skills, abilities, and clinical judgment needed for safe and effective entry-level nursing practice. The 2026 NCLEX-RN Test Plan specifically incorporates Client Needs, integrated processes, and clinical judgment, making it important for candidates to prepare for application and decision-making rather than relying exclusively on memorization.
A strong NCLEX study strategy therefore combines several complementary approaches:
Active content review rather than passive rereading.
Retrieval practice and spaced review.
Consistent NCLEX practice questions.
Careful analysis of rationales.
NGN case-study practice.
Clinical judgment development.
Targeted remediation of weak areas.
Regular measurement of progress.
These activities should work together. Content review supplies the knowledge base, practice questions test whether that knowledge can be retrieved and applied, rationales explain the reasoning, and remediation addresses the specific weaknesses identified through practice.
Research in health professions education provides support for retrieval and distributed practice. A systematic review identified 56 eligible studies comprising 63 experiments and found that 43 demonstrated significant benefits of distributed practice and/or retrieval practice over comparison or control conditions. A more recent review likewise describes retrieval practice as an evidence-supported approach used across health professions education, including nursing.
The objective is therefore not to study harder indiscriminately. It is to study in a manner that repeatedly requires the candidate to retrieve information, interpret clinical situations, make decisions, and learn from errors.
Effective NCLEX Content Review Strategies
Effective NCLEX content review begins with understanding rather than memorization. Nursing students spend years learning large amounts of information, but the NCLEX exam does not require candidates to reproduce an entire nursing-school curriculum word for word. Candidates need to understand important concepts well enough to recognize relevant findings, identify risks, determine priorities, select appropriate interventions, and evaluate patient responses.
A useful content-review strategy begins with the question:
“What nursing decision does this knowledge allow me to make?”
For example, instead of memorizing that a client with heart failure may experience peripheral edema, the candidate should connect the finding with fluid retention, impaired cardiac function, assessment priorities, medication considerations, patient education, and potential deterioration.
That chain is more useful for NCLEX study than memorizing disconnected facts.
Use active recall instead of repeated rereading
One of the most useful changes candidates can make is replacing passive rereading with active retrieval. After reviewing a topic, close the book or study guide and attempt to explain the concept without looking at the material.
For example, after studying hypoglycemia, ask yourself:
What findings would I expect?
Which findings require immediate attention?
What should the nurse do first?
What intervention would be inappropriate?
How would the client’s condition change if treatment were delayed?
If the candidate cannot answer these questions without looking at the notes, the concept probably needs additional review.
Retrieval practice can take several forms:
Answering questions without notes.
Explaining a concept aloud.
Creating a concept map from memory.
Writing the major nursing priorities on a blank page.
Teaching the concept to another nursing student.
Using flashcards for factual information.
Completing practice questions.
Research supports retrieval practice as a useful learning strategy in health professions education, although its effectiveness can vary according to how it is implemented.
Use spaced review
Candidates should avoid studying a topic once and then abandoning it. Spaced review distributes learning across multiple sessions.
For example:
Day 1: Study diabetes mellitus. Day 3: Recall major manifestations and complications. Day 7: Complete diabetes-related NCLEX questions. Day 14: Include diabetes questions in a mixed practice set. Day 21: Review previously missed diabetes concepts.
The purpose is not to reread the entire diabetes chapter each time. The candidate should progressively retrieve and apply the knowledge.
Distributed learning is particularly useful for an extended NCLEX study schedule because the examination requires retention across many content areas. Research in health professions education has found evidence supporting distributed and retrieval practice for academic outcomes.
Study concepts, not isolated facts
A common problem during NCLEX preparation is attempting to memorize thousands of individual facts. Some factual recall is necessary, but isolated memorization becomes less useful when a question changes the clinical context.
For example, when studying an antihypertensive medication, the candidate should understand what therapeutic response is expected, what assessment findings matter, what adverse effects could create safety concerns, and what patient teaching is appropriate.
This allows the candidate to answer unfamiliar NCLEX questions because the knowledge can be transferred to a new situation.
Interleave related content
Interleaving means mixing related topics instead of practicing only one category repeatedly.
For example, rather than completing 100 cardiovascular questions in one session, a candidate might complete a mixed set involving:
Heart failure.
Myocardial infarction.
Hypertension.
Dysrhythmias.
Medication safety.
Fluid balance.
Prioritization.
This forces the candidate to determine which knowledge is relevant to each new situation.
Interleaving can be especially valuable later in an NCLEX Study Plan, when the goal shifts from recognizing a familiar topic to selecting the correct nursing response in an unfamiliar clinical context.
Use the “teach-back” method
Another effective strategy is to explain a concept as if teaching another nursing student.
Suppose the topic is pulmonary embolism. Instead of saying, “I read about pulmonary embolism,” the candidate should be able to explain:
What it is.
Why it is dangerous.
What findings may suggest deterioration.
Which assessments are important.
What interventions may be anticipated.
What findings require urgent action.
What the nurse should monitor.
If the explanation becomes vague or depends heavily on the textbook, the candidate has identified a learning gap.
Peer teaching may also be useful as a supplemental strategy. A systematic review and meta-analysis of peer teaching in health professions education found beneficial effects particularly for procedural skills, with theoretical knowledge and other learning outcomes also examined across the included studies.
Connect content review to clinical application
Every major study session should eventually move from information to application.
For example:
Content: Signs of increased intracranial pressure.
Application: Which assessment finding should concern the nurse most?
Clinical judgment: What change suggests worsening neurological status?
Action: Which intervention should receive priority?
Evaluation: How would the nurse determine whether the intervention was effective?
This approach makes NCLEX content review more clinically meaningful.
The current NCSBN test plan emphasizes clinical judgment because entry-level nurses must make increasingly complex decisions while maintaining client safety.
Answering NCLEX Questions and Understanding Rationales
Answering NCLEX questions is not simply a matter of selecting the correct option. Each question provides an opportunity to practice clinical reasoning. Candidates should therefore spend substantial time analyzing questions rather than focusing only on their percentage score.
A useful approach is to read the question in stages.
First, determine what the question is asking.
Look for words such as:
First.
Priority.
Best.
Most appropriate.
Requires immediate intervention.
Further teaching.
Needs follow-up.
Expected.
Unexpected.
Contraindicated.
These words establish the decision the candidate must make.
Next, identify the client and clinical context. Ask:
Who is the client?
What condition or situation is present?
What assessment information is provided?
Is the client stable or unstable?
Is the question testing assessment, intervention, prioritization, education, safety, or evaluation?
Then identify the information that changes the decision.
For example, consider a question involving four clients:
One client reports mild postoperative discomfort.
One client has a new change in mental status.
One client requests assistance with bathing.
One client needs routine medication administration.
The candidate should not simply select the client with the most familiar diagnosis. The reasoning should focus on which situation represents the greatest immediate threat to safety and requires nursing attention first.
Separate relevant cues from background information
Many NCLEX-style questions contain information that is clinically relevant but not the immediate focus of the question.
A useful technique is to identify:
What do I know?
What has changed?
What is abnormal?
What poses the greatest immediate risk?
What does the question actually require me to decide?
This prevents the candidate from becoming distracted by unnecessary details.
Do not select an answer simply because it is true
One of the most important NCLEX test-taking principles is that an answer can be factually correct but still not be the best answer.
For example, a client may require education, monitoring, medication administration, and safety precautions. All four may be appropriate nursing activities. If the question asks what the nurse should do first, the candidate must determine which action has the highest priority in the specific situation.
The question is therefore not:
“Which answer is true?”
It is:
“Which answer best satisfies the question under the circumstances described?”
This distinction is central to prioritization.
Read every option before deciding
Candidates sometimes identify a plausible answer early and stop evaluating the remaining options. This can lead to selecting an intervention that is appropriate but not the priority.
A better approach is to compare all options.
Ask:
Which option directly addresses the problem?
Which option protects the client from immediate harm?
Which option is within the nurse’s scope?
Which option addresses the current—not merely possible—problem?
Which option is appropriate for this stage of care?
Analyze rationales deeply
The rationale should be one of the most valuable parts of NCLEX practice.
After answering a question, ask:
Why is the correct option correct?
Then ask:
Why are the other options less appropriate?
This second question is important because it expands the candidate’s understanding of the clinical situation.
For example, suppose the correct answer involves assessing a client’s respiratory status before performing another intervention. The candidate should understand why assessment is required and under what circumstances another action might become appropriate.
Rationales should therefore be used to build principles, not merely memorize answer letters.
Keep an error log
An NCLEX study strategy becomes more effective when mistakes are categorized.
A simple error log can include:
Question
Topic
Error Type
Why I Missed It
Correct Principle
1
Heart failure
Knowledge
Forgot fluid-retention signs
Recognize worsening congestion
2
Delegation
Reasoning
Chose task based on convenience
Match task to scope and client needs
3
Pharmacology
Knowledge
Confused adverse effects
Review medication class
4
Prioritization
Test interpretation
Missed “first”
Determine immediate safety priority
This prevents the candidate from treating every wrong answer as the same problem.
For example, if 15 missed questions all involve pharmacology knowledge, the solution is targeted pharmacology review. If the candidate knows the content but repeatedly chooses the second-best intervention, the solution is more clinical judgment and prioritization practice.
Review correct answers too
A correct answer does not always equal mastery.
If a candidate selected an answer by guessing, that question should be marked for review. Similarly, if the candidate selected the right answer but cannot explain why the alternatives are inappropriate, the concept may not yet be secure.
A useful classification is:
Green: Correct and confident.
Yellow: Correct but uncertain.
Orange: Incorrect because of reasoning.
Red: Incorrect because of a knowledge deficit.
This makes practice data much more informative.
Developing Clinical Judgment Through NGN Practice
Clinical judgment is a central component of the modern NCLEX-RN, and candidates should deliberately practice it rather than assuming that it will develop automatically from answering large numbers of questions.
The 2026 NCLEX-RN Test Plan identifies clinical judgment as an integrated process and incorporates the NCSBN Clinical Judgment Measurement Model into examination development.
The six steps of the model are:
Recognize cues
Analyze cues
Prioritize hypotheses
Generate solutions
Take action
Evaluate outcomes
These steps provide a useful framework for NGN practice.
Recognize cues
The first task is identifying clinically meaningful information.
Suppose a client has:
Increasing respiratory rate.
Decreasing oxygen saturation.
New confusion.
Restlessness.
Changes in breath sounds.
The candidate should recognize that these findings may represent an important change in respiratory status.
Not every piece of information in a case carries equal importance. Clinical judgment begins with identifying cues that require attention.
Analyze cues
After identifying the findings, determine how they relate to one another.
may represent a more concerning clinical pattern than any one finding considered alone.
The candidate should ask:
Which findings are connected?
What do they suggest?
Is the client improving or deteriorating?
What additional information would help clarify the situation?
This moves the learner from recognition toward interpretation.
Prioritize hypotheses
The next step is determining which explanation or problem deserves the greatest attention.
Candidates should avoid selecting the diagnosis that merely sounds most familiar. Instead, they should consider which problem is most consistent with the available evidence and poses the greatest immediate risk.
For example, if a client has several chronic conditions but suddenly develops severe respiratory distress, the immediate nursing priority may be the acute respiratory problem rather than one of the stable chronic conditions.
Generate solutions
Once the priority problem is identified, the candidate should consider possible nursing responses.
Ask:
What can the nurse do?
What should be assessed?
What intervention is appropriate?
What intervention could cause harm?
What additional information is needed?
This is where foundational NCLEX content becomes clinically useful.
Take action
The candidate then determines what should actually happen.
The important distinction is between an intervention that is generally appropriate and one that is appropriate now.
For example, a client may eventually require extensive education, but if the client is acutely unstable, immediate stabilization takes precedence over routine teaching.
Evaluate outcomes
Clinical judgment does not end with intervention.
The nurse must determine whether the client’s condition improved.
For example:
Problem: Respiratory deterioration.
Intervention: Appropriate oxygen-support measures and escalation of care according to the clinical situation.
Evaluation: Reassess respiratory status, oxygenation, mental status, and other relevant findings.
If the client does not improve, the nurse must reconsider the situation and take further action.
This cyclical process is exactly why NGN case studies should not be approached as collections of unrelated questions.
Practice with evolving case studies
An effective NGN case study should be approached as a developing clinical story.
Instead of asking only:
“What is the diagnosis?”
ask:
“What changed?”
“What matters most now?”
“What should the nurse do next?”
“How will I know whether the intervention worked?”
For example, imagine a postoperative client who initially has stable vital signs but later develops:
Increasing pain.
Tachycardia.
Falling blood pressure.
Pale, cool skin.
Increasing restlessness.
The candidate should recognize that the later findings represent a change from baseline. The case is therefore testing more than recognition of postoperative care; it requires interpretation of trends and prioritization of possible deterioration.
This type of practice develops the ability to connect multiple pieces of information rather than treating every question as an isolated fact.
Candidates should also practice identifying trends. A single laboratory value may be less informative than a significant change over time. Likewise, a single symptom may become much more concerning when combined with other findings.
Avoid memorizing NGN answer patterns
The goal of Next Generation NCLEX preparation is not to memorize that a particular visual arrangement or item type usually has a particular answer. The actual examination assesses nursing competence through an individualized computerized adaptive testing process, so candidates must be able to reason through unfamiliar situations.
A better strategy is to learn the underlying reasoning process.
When practicing a case study, write down:
Cues → Meaning → Priority → Action → Expected outcome.
For example:
Cues: New confusion, hypotension, tachycardia.
Meaning: Possible clinical deterioration requiring immediate assessment.
Priority: Determine the cause and protect the client from further deterioration.
Action: Perform appropriate immediate assessment and interventions within nursing scope.
Expected outcome: Improved clinical status and stabilization.
This framework helps candidates practice clinical judgment rather than memorize answers.
Tracking Progress and Improving Weak Areas
An NCLEX Study Plan should change according to evidence. Candidates need a method for determining whether their preparation is working and identifying where additional effort is needed.
A score alone is not enough.
Suppose a candidate scores:
70% → 72% → 74% → 76%
That suggests improvement, but it does not explain why.
A more useful tracking system records:
Content area.
Number of questions attempted.
Number correct.
Error type.
Confidence level.
Recurring concepts missed.
NGN performance.
Progress after remediation.
For example:
Area
Questions
Correct
Main Problem
Action
Pharmacology
50
31
Medication knowledge
Targeted review
Management of Care
50
39
Prioritization
More priority questions
Physiological Adaptation
50
34
Disease processes
Content remediation
Safety
50
44
Minor errors
Maintenance practice
NGN case studies
20
12
Cue analysis
Clinical judgment practice
This produces much more useful information than an overall percentage.
Track error patterns
A candidate should look for repeated patterns.
For example:
Pattern 1: Knowledge deficit
The candidate repeatedly cannot recall the relevant information.
Response: Return to authoritative content review and use retrieval practice.
Pattern 2: Misinterpreting questions
The candidate knows the content but repeatedly overlooks words such as “first,” “priority,” or “requires immediate intervention.”
Response: Slow down the reading process and practice identifying the exact task in the question.
Pattern 3: Prioritization difficulty
The candidate recognizes each answer as appropriate but struggles to determine which should occur first.
Response: Increase practice involving prioritization, safety, acute versus chronic problems, and changes in patient condition.
Pattern 4: Clinical judgment difficulty
The candidate can recall facts but struggles to connect cues and determine what they mean.
Response: Increase NGN case-study practice and explicitly work through the six clinical judgment steps.
Pattern 5: Careless errors
The candidate changes correct answers unnecessarily, overlooks important details, or answers too quickly.
Response: Work on deliberate question reading and confidence in evidence-based reasoning.
Use targeted remediation
Remediation should be specific.
“Study more pharmacology” is too broad.
A stronger remediation objective would be:
“Review insulin safety, hypoglycemia recognition, insulin administration principles, and related NCLEX questions.”
Similarly:
“Study cardiac nursing” is less useful than:
“Review heart-failure assessment findings, fluid-management priorities, medication considerations, and recognition of worsening status.”
The more specific the remediation target, the easier it becomes to determine whether improvement has occurred.
Reassess after remediation
Remediation should always be followed by reassessment.
For example:
Step 1: Miss several questions involving electrolyte imbalances.
Step 2: Identify the specific knowledge gaps.
Step 3: Review the relevant concepts.
Step 4: Retrieve the information without notes.
Step 5: Complete targeted practice questions.
Step 6: Reassess the same concepts in a mixed-question set later.
This prevents candidates from confusing exposure with mastery.
A candidate who rereads potassium disorders for an hour has demonstrated study activity. A candidate who can correctly analyze a new potassium-related clinical scenario several days later has demonstrated learning.
Measure improvement by more than percentages
Progress can be measured through several indicators:
Increased accuracy.
Better rationale explanations.
Fewer repeated mistakes.
Improved performance in previously weak areas.
Greater confidence without excessive guessing.
Improved ability to identify relevant cues.
Better prioritization.
More consistent performance on mixed questions.
Improved performance on NGN case studies.
Greater ability to explain why distractors are inappropriate.
These indicators provide a broader picture of NCLEX readiness than a single practice-test score.
Maintain a “missed concepts” list
A concise missed-concepts list can become one of the most valuable tools in an NCLEX Study Plan.
For example:
Current missed concepts
Heart-failure fluid management.
Delegation principles.
Insulin safety.
Isolation precautions.
Acid-base interpretation.
Pediatric medication safety.
NGN cue prioritization.
The list should be updated regularly. Once a concept has been mastered, it can be removed or moved into maintenance review.
This prevents candidates from repeatedly studying what they already know while ignoring persistent weaknesses.
Use performance data to redistribute study time
If the candidate’s data show:
Safety: strong
Health Promotion: strong
Pharmacology: moderate
Physiological Adaptation: weak
then the next phase of the NCLEX study strategy should reflect that distribution.
The candidate does not need to stop reviewing strong areas completely. Instead, strong areas can receive maintenance practice while weak areas receive concentrated remediation.
That cycle should continue throughout NCLEX preparation.
The approach also prevents a common problem: studying according to preference rather than need. Candidates often gravitate toward subjects they enjoy or understand because those sessions feel productive. However, an effective NCLEX Study Plan should allocate additional attention to areas where performance data demonstrate a genuine need.
At the same time, weak performance should not automatically be interpreted as failure. A difficult practice session can reveal exactly what needs to be learned before exam day.
The most productive response to a poor practice result is therefore not panic. It is analysis.
Ask:
What did I miss?
Why did I miss it?
What concept does the mistake represent?
What will I do differently next time?
How will I verify that I improved?
This transforms mistakes into study information.
A candidate who follows this process repeatedly develops a progressively more personalized approach to NCLEX study. Content review becomes more targeted, practice becomes more meaningful, and clinical judgment becomes increasingly integrated into preparation.
The central principle is simple:
Do not use practice merely to measure what you know. Use practice to improve what you do not yet know or cannot yet apply consistently.
When an NCLEX Study Plan combines active content review, retrieval and spaced learning, deliberate question analysis, NGN case studies, clinical judgment practice, and systematic tracking of weak areas, preparation becomes an iterative learning process rather than a race to complete as many study materials as possible. This approach is consistent with the current NCSBN emphasis on entry-level nursing knowledge and clinical judgment and with evidence supporting retrieval and distributed learning in health professions education.
Evaluating NCLEX Readiness
Evaluating NCLEX readiness is an important stage of any effective NCLEX Study Plan because completing content review does not automatically mean a nursing student is prepared to pass the NCLEX-RN. Readiness involves determining whether knowledge can be consistently recalled, applied to unfamiliar clinical situations, and used to make safe decisions under exam conditions. A strong NCLEX Study Plan therefore needs a deliberate process for measuring progress rather than relying on the amount of material studied.
The NCLEX-RN is designed to determine whether a candidate demonstrates the level of ability required for safe and effective entry-level registered nursing practice. Because the actual examination uses computerized adaptive testing (CAT), the experience and scoring process are different from those of most commercial practice tests. A practice exam can provide valuable information about preparation, but a practice score should not be treated as a guarantee of passing or failing the NCLEX.
For this reason, NCLEX readiness should be evaluated across several dimensions: content knowledge, performance on practice questions, clinical judgment, consistency, ability to handle different question types, endurance during longer testing sessions, and the ability to recognize and correct weak areas. A nursing graduate who scores well on one practice test but repeatedly struggles with medication safety or prioritization may not be as prepared as another candidate with slightly lower scores but more consistent performance across diverse content areas.
A useful NCLEX Study Plan treats readiness as a developing pattern rather than a single number. The goal is to determine whether performance is becoming sufficiently consistent and reliable to support confidence on exam day.
Using NCLEX Practice Exams
NCLEX practice exams are an important component of NCLEX preparation because they provide an opportunity to apply nursing knowledge in an examination environment. Unlike ordinary content review, a practice exam requires the test taker to interpret a question, identify relevant information, select the safest or most appropriate response, and move forward without receiving immediate feedback.
Practice exams are particularly valuable because the NCLEX is not simply a test of whether a candidate can remember isolated nursing facts. Candidates must apply knowledge to clinical situations involving prioritization, safety, communication, pharmacology, assessment, delegation, physiological changes, psychosocial needs, and other aspects of nursing practice. The NCLEX-RN test plan organizes examination content around Client Needs categories while integrating clinical judgment throughout the examination.
A well-designed NCLEX Study Plan should therefore incorporate practice exams progressively rather than waiting until the final few days before the exam.
Early in preparation, a practice test can function as a diagnostic tool. At this stage, the objective is not necessarily to achieve a high score. Instead, the nursing student should determine which content areas and question types require attention.
For example, a nursing student might complete an initial practice exam and discover the following pattern:
78% on Management of Care
81% on Safety and Infection Prevention and Control
74% on Health Promotion and Maintenance
69% on Pharmacological and Parenteral Therapies
82% on Psychosocial Integrity
66% on Physiological Adaptation
Frequent errors on prioritization questions
Difficulty identifying the most important cue in case studies
This information is much more useful than simply saying, “I scored 74%.” The detailed results show that pharmacology, physiological adaptation, prioritization, and clinical judgment deserve additional attention.
As preparation progresses, practice exams should become increasingly representative of the demands of the actual NCLEX exam. The student should gradually move from shorter, targeted sets of practice questions toward mixed-content and longer practice sessions.
A practical progression might look like this:
Early preparation: Use shorter practice sets to identify knowledge gaps and become familiar with NCLEX-style questions.
Middle preparation: Combine multiple Client Needs categories and question types so that the student must shift between subjects rather than relying on a predictable topic sequence.
Late preparation: Complete longer or full-length practice exams under realistic conditions to evaluate endurance, consistency, timing, concentration, and clinical reasoning.
This progression is important because targeted practice and full-length practice serve different purposes. A 25-question pharmacology quiz can determine whether a student understands medication principles, but it cannot fully demonstrate whether the student can maintain concentration while moving between pharmacology, maternity, mental health, pediatric, medical-surgical, safety, and prioritization questions.
Simulating the NCLEX Testing Experience
At least some NCLEX practice exams should be completed under conditions that resemble the actual testing environment as closely as reasonably possible. The purpose is not to create unnecessary anxiety but to evaluate whether the student’s knowledge and clinical judgment remain stable when distractions, fatigue, and sustained concentration become factors.
During a simulation, the student can:
Set aside uninterrupted study time.
Use a quiet environment.
Avoid checking notes while answering questions.
Avoid looking up answers during the examination.
Follow the time limits established for the practice test.
Complete the questions in one sitting when practical.
Take only the breaks permitted by the simulation being used.
Record questions for later review rather than stopping the exam to investigate every uncertainty.
Review performance only after completing the examination.
This approach produces more meaningful information than repeatedly taking practice tests while simultaneously checking textbooks or changing answers based on outside information.
For example, a student might score 86% on a 60-question practice test while taking frequent breaks and looking up medications between questions. That result may feel encouraging, but it does not provide the same evidence of readiness as an 82% score achieved under uninterrupted, timed conditions.
The purpose of simulation is therefore measurement, not simply reassurance.
How Often Should You Take an NCLEX Practice Exam?
There is no universal number of practice exams that every nursing student must complete. The appropriate frequency depends on the length of the student’s NCLEX Study Plan, previous nursing education, baseline performance, available study time, and progress.
Taking full-length practice exams too frequently can also be counterproductive. A student may spend excessive time testing and insufficient time addressing the weaknesses revealed by those tests. Practice examinations are most useful when their results lead to meaningful remediation.
For example, within a three-month NCLEX Study Plan, a student might use:
Month 1: One diagnostic or baseline practice exam, supplemented by targeted question sets.
Month 2: Periodic mixed-content practice exams to evaluate whether knowledge is transferring across subjects.
Month 3: More frequent longer practice sessions to assess consistency, endurance, and readiness.
The exact schedule should remain flexible. If a practice exam reveals a major weakness in pharmacology, spending the next several days completing additional full-length exams may provide less benefit than targeted pharmacology review followed by another assessment.
What Practice Exams Can and Cannot Tell You
A practice exam can answer several useful questions:
Which content areas remain weak?
Which Client Needs categories are producing repeated errors?
Is performance improving over time?
Does performance remain stable when questions become more difficult?
Can the student apply knowledge to unfamiliar situations?
How well is the student performing on NGN case studies?
Does performance decline during longer sessions?
Are errors primarily caused by knowledge gaps, misreading, prioritization, or clinical reasoning?
Is the student becoming more consistent?
However, a practice exam cannot guarantee an NCLEX outcome. Commercial practice tests may use different scoring systems, difficulty levels, question distributions, and predictive methods. A percentage score on a practice test is not equivalent to the CAT decision used by the actual NCLEX.
The NCSBN emphasizes that NCLEX results are based on whether the candidate’s demonstrated ability is above or below the passing standard; the examination is not designed around a fixed percentage of candidates who must pass or fail. The number of questions a candidate receives is also not, by itself, an indicator of success or failure.
Therefore, the best NCLEX Study Plan uses practice exams as evidence for decision-making rather than as guarantees.
Interpreting Practice Performance
Interpreting NCLEX practice performance requires more than looking at the percentage displayed after an examination. A single score provides only a snapshot. A series of results can reveal a trend, and the trend is generally much more informative for an NCLEX Study Plan.
For example, consider two nursing graduates.
Student A
Practice Exam 1: 82%
Practice Exam 2: 74%
Practice Exam 3: 79%
Practice Exam 4: 71%
Student B
Practice Exam 1: 68%
Practice Exam 2: 73%
Practice Exam 3: 78%
Practice Exam 4: 82%
Student A has the higher average score, but the declining and inconsistent pattern deserves investigation. Student B began at a lower level but demonstrates a steady improvement. Neither pattern alone proves NCLEX readiness, but the second pattern suggests that the student’s NCLEX Study Plan may be successfully addressing weaknesses.
This illustrates why readiness should be evaluated through performance trends, not isolated scores.
Look Beyond the Overall Percentage
An overall practice-test score can conceal important weaknesses.
Suppose a nursing student receives 80% overall. That may initially appear strong. However, the detailed results might show:
92% in psychosocial nursing
89% in health promotion
84% in basic care and comfort
79% in management of care
73% in safety and infection prevention
68% in pharmacological and parenteral therapies
64% in physiological adaptation
The overall 80% does not mean that every area is equally strong. The lower results identify areas that may require targeted content review.
The reverse can also occur. A student may score 72% overall but perform adequately across all major areas, with most errors resulting from occasional unfamiliar questions. That student may have a different remediation need from someone scoring 80% with a severe weakness in one clinically important area.
The purpose of analyzing practice performance is therefore to answer why the student is missing questions, not merely how many questions were missed.
Distinguishing Knowledge Errors From Reasoning Errors
One of the most important parts of interpreting an NCLEX practice test is identifying the type of error.
A knowledge error occurs when the student does not know the underlying nursing information.
For example, a student may miss a question because they do not know the expected adverse effects of a medication or cannot identify the signs of hypoglycemia.
A reasoning error occurs when the student possesses the necessary information but does not apply it appropriately.
For example, the student may know that a patient with respiratory distress requires prompt assessment but select a less urgent intervention because they fail to recognize which clinical cue has the greatest priority.
These errors require different interventions.
If the problem is knowledge, the NCLEX Study Plan should allocate additional time to content review and active recall.
If the problem is reasoning, the student needs more opportunities to interpret cues, prioritize hypotheses, evaluate options, and apply nursing principles to unfamiliar situations.
A third category is a test-taking or process error. The student may know the answer but:
Misread the question.
Overlook a key word.
Select an answer before reading all options.
Change a correct answer without sufficient reason.
Fail to distinguish an assessment question from an intervention question.
Confuse what is expected with what is immediately dangerous.
Allow an irrelevant detail to dominate the decision.
A useful error log can separate these categories:
Error type
Example
Appropriate response
Knowledge gap
Does not know signs of hypokalemia
Review potassium physiology and manifestations
Clinical reasoning
Notices all cues but fails to identify the priority
Practice cue recognition and prioritization
Question interpretation
Answers what to teach instead of what to assess
Analyze wording and question intent
Content application
Knows medication class but cannot apply safety principles
Practice medication-based clinical scenarios
Care-priority error
Selects a stable patient over an unstable patient
Review prioritization and ABC principles
Carelessness
Misreads “requires immediate intervention”
Slow down and identify the exact task
This approach transforms a practice exam into a learning tool.
Evaluate Performance by Content and Client Needs
The 2026 NCLEX-RN test plan organizes examination content through eight Client Needs categories, including Management of Care, Safety and Infection Prevention and Control, Health Promotion and Maintenance, Psychosocial Integrity, Basic Care and Comfort, Pharmacological and Parenteral Therapies, Reduction of Risk Potential, and Physiological Adaptation.
Performance should therefore be evaluated across these categories whenever the practice resource provides reliable category-level reporting.
For example, consistently weak performance in Management of Care may suggest the need to review delegation, assignment, prioritization, coordination of care, client rights, continuity of care, or supervision.
Weak performance in Pharmacological and Parenteral Therapies may require review of medication classes, adverse effects, contraindications, administration principles, laboratory monitoring, client education, and safety considerations.
Weak performance in Physiological Adaptation may indicate difficulty recognizing complications, interpreting clinical changes, responding to acute conditions, or integrating assessment findings into appropriate nursing action.
The goal is not to memorize the names of the Client Needs categories. The goal is to use them as an organizational framework for determining where the NCLEX Study Plan needs adjustment.
Evaluate NGN and Clinical Judgment Performance
Because the Next Generation NCLEX places substantial emphasis on clinical judgment, practice performance should also be examined in relation to NGN case studies and other clinical judgment items.
The NCSBN Clinical Judgment Measurement Model describes six related steps: recognizing cues, analyzing cues, prioritizing hypotheses, generating solutions, taking action, and evaluating outcomes. These steps are integrated into the NCLEX through clinical judgment measurement.
A student may perform well on traditional multiple-choice questions but struggle with an NGN case study because the case requires information to be integrated across several steps.
For example, a case study may provide a patient’s history, vital signs, laboratory results, medication information, and changing assessment findings. The student may correctly identify an abnormal laboratory result but fail to connect it with the patient’s other findings or determine which change requires the most immediate action.
That pattern suggests a clinical judgment weakness rather than simply a content deficit.
An effective NCLEX Study Plan should therefore ask:
Can I recognize important cues?
Can I distinguish relevant cues from background information?
Can I connect multiple findings?
Can I determine which problem is most urgent?
Can I identify an appropriate nursing response?
Can I evaluate whether the intervention produced the expected outcome?
These questions provide more useful information than simply counting the number of NGN questions answered correctly.
Evaluate Consistency
Consistency is one of the most valuable indicators when assessing NCLEX readiness.
A student who scores 85% one day and 55% the next may need to determine why performance varies so significantly. Possible explanations include fatigue, inconsistent preparation, particular content areas, difficulty level, anxiety, or weaknesses that are hidden by favorable question selection.
Consider this example:
Practice session
Score
Observation
Monday
81%
Strong performance after focused review
Wednesday
64%
Weak pharmacology and prioritization
Friday
78%
Improved after targeted remediation
Following Monday
80%
Mixed-content performance remains stable
This pattern provides more confidence than a single 81% score because the student has demonstrated improvement and increasing stability.
Consistency does not mean achieving exactly the same score on every test. Different practice exams have different questions and difficulty levels. Instead, consistency means that the student’s underlying performance remains reasonably stable across different content areas, question types, and testing conditions.
Monitor Performance Over Time
A simple NCLEX Study Plan performance tracker can include:
Date of practice test
Number of questions
Overall percentage
Client Needs performance
NGN/case-study performance
Pharmacology performance
Clinical judgment errors
Knowledge errors
Reasoning errors
Test-taking errors
Time or endurance concerns
Topics requiring remediation
For example:
Date
Questions
Score
Main weakness
Action
Week 2
50
66%
Pharmacology
Review medication classes
Week 4
75
72%
Prioritization
Practice priority questions
Week 6
100
76%
Physiological adaptation
Review acute conditions
Week 8
100
81%
NGN clinical judgment
Complete additional case studies
Week 10
100
83%
Minor content gaps
Targeted remediation
This type of tracking allows the nursing student to see whether the NCLEX Study Plan is producing measurable improvement.
How to Categorize Your NCLEX Mistakes
Determining When You Are Ready for the NCLEX
Determining when to take the NCLEX exam is one of the most difficult decisions for nursing graduates. Studying for too long can lead to unnecessary delay, fatigue, and loss of confidence, while taking the exam before adequate preparation can create avoidable risk.
There is no single practice-test score, number of questions completed, or number of study hours that can guarantee that a candidate is ready for the NCLEX. Readiness should instead be based on a collection of indicators demonstrating that the student can consistently perform at the level expected of an entry-level registered nurse.
A strong NCLEX Study Plan should therefore include a final readiness assessment rather than simply ending when the student has finished the study materials.
Indicator 1: Consistent Mixed-Content Performance
A student should be able to perform reasonably consistently when questions are presented across different nursing subjects.
This matters because the actual NCLEX-RN does not function like a chapter-by-chapter classroom examination. The candidate must shift mentally between different clinical situations and Client Needs areas.
For example, a student may answer a medication question followed by a pediatric question, a delegation question, a psychiatric nursing question, a postoperative complication question, and an infection-control question.
If the student can consistently handle this variety without relying on predictable topic patterns, the NCLEX Study Plan is providing evidence of broader preparation.
Indicator 2: Weak Areas Have Been Addressed
Being ready does not mean knowing every nursing fact. Nursing is too broad for that standard to be realistic.
However, major weaknesses should have been identified and addressed.
For example, if a student’s diagnostic testing repeatedly demonstrates poor pharmacology performance, the student should not simply continue completing random practice questions while ignoring medication review.
Likewise, repeated difficulty with:
Prioritization
Delegation
Infection prevention
Medication safety
Physiological adaptation
Clinical judgment
Maternal-newborn complications
Pediatric emergencies
Mental health safety
should trigger targeted remediation.
A candidate does not need perfection. The important question is whether the weaknesses are sufficiently controlled that they no longer consistently interfere with safe clinical decision-making.
Indicator 3: You Can Explain Why Answers Are Correct
Another valuable readiness indicator is the ability to explain the reasoning behind an answer.
A student who selects an answer correctly by guessing is not demonstrating the same level of readiness as a student who can explain:
What the question is asking.
Which cues are relevant.
Why the selected option is appropriate.
Why the other options are less appropriate.
Which nursing principle supports the decision.
What additional assessment might be necessary.
How the situation could change if new information appeared.
For example, suppose a student selects an answer involving immediate assessment of a patient with respiratory distress. If the student can explain that the patient’s deteriorating oxygenation represents an immediate physiological threat and identify which additional findings would increase concern, that demonstrates deeper clinical reasoning.
The ability to explain decisions is particularly important for NGN case studies, where several pieces of information may need to be integrated.
Indicator 4: Clinical Judgment Is Becoming Reliable
Because clinical judgment is explicitly measured in the Next Generation NCLEX, readiness should include evidence that the student can apply clinical judgment consistently.
A student should be increasingly comfortable moving through the clinical reasoning process:
For example, consider a patient who develops increasing shortness of breath after surgery.
A prepared student should be able to recognize concerning cues, analyze the change in respiratory status, identify possible complications, prioritize the most urgent concern, select appropriate nursing actions, and evaluate the patient’s response.
The exact disease diagnosis is not always the central issue. The examination may be assessing whether the candidate can recognize deterioration and respond safely.
Indicator 5: Performance Holds Up During Longer Sessions
The ability to answer 20 questions correctly does not necessarily demonstrate readiness for a longer examination session.
As preparation advances, students should evaluate whether performance deteriorates significantly when they become tired.
For example:
First 25 questions: 84%
Next 25 questions: 82%
Next 25 questions: 80%
Final 25 questions: 78%
This represents a relatively stable performance pattern.
By contrast:
First 25 questions: 86%
Next 25 questions: 80%
Next 25 questions: 68%
Final 25 questions: 58%
may indicate that endurance, concentration, anxiety, or pacing needs additional attention.
This does not mean the second student is automatically unprepared. It means the NCLEX Study Plan should address the factor causing the decline before the exam date when possible.
Indicator 6: You Can Handle Unfamiliar Questions
Readiness is not demonstrated by recognizing questions that have appeared repeatedly in study materials. The NCLEX requires candidates to apply nursing knowledge to questions and clinical situations that may be unfamiliar.
A prepared nursing graduate should therefore be able to reason through a question even when:
The disease is unfamiliar.
The medication is unfamiliar.
The wording is different from the study guide.
Several answers appear plausible.
New information is introduced in a case study.
The question requires prioritization rather than simple recall.
This is one reason memorizing answer patterns is an unreliable NCLEX prep strategy.
For example, instead of memorizing that a particular disease is associated with a particular intervention, the student should understand the physiological problem and determine which nursing action follows from the patient’s current condition.
Indicator 7: Practice Performance Is Improving or Stable
A student should look for a generally favorable performance trend rather than a single exceptionally high score.
This progression demonstrates that the NCLEX Study Plan is functioning as an adaptive learning process.
If scores remain stagnant despite weeks of practice, the solution may not be completing more questions. The student may need to change the study strategy, strengthen foundational knowledge, analyze rationales more carefully, or seek additional instruction.
Indicator 8: You Are Prepared for the Practical Requirements of Test Day
Academic readiness is only one part of NCLEX preparation. Candidates should also be prepared for the administrative and logistical requirements associated with the examination.
Depending on their situation, nursing graduates should confirm that they have completed the required registration and licensure steps, received their Authorization to Test (ATT) when applicable, confirmed their examination appointment, reviewed testing requirements, and understand what they need to bring or do on exam day. Current requirements should be checked against official NCSBN and nursing regulatory-body information rather than relying on an old study guide.
This practical preparation reduces avoidable uncertainty during test day.
Indicator 9: You Can Manage Test Anxiety Without Losing Clinical Judgment
Feeling nervous before the NCLEX is not necessarily evidence that a student is unprepared. Some anxiety is normal before an important professional examination.
The more important question is whether anxiety prevents the student from applying knowledge.
For example, a student may know how to prioritize care during practice but begin selecting answers randomly when encountering an unfamiliar question. In that case, the NCLEX Study Plan should include strategies for slowing down, identifying the clinical task, recognizing relevant cues, and returning to evidence-based reasoning.
Readiness therefore includes psychological preparation as well as academic preparation.
A useful mindset is:
“I do not need to know everything. I need to consistently recognize what matters, apply safe nursing principles, and make the best-supported decision.”
A Practical NCLEX Readiness Checklist
Before scheduling or sitting for the NCLEX-RN, a nursing graduate can ask:
Have I completed a structured NCLEX Study Plan?
Have I reviewed the current NCLEX-RN test plan?
Have I identified my weakest Client Needs areas?
Have I addressed major knowledge gaps?
Can I perform consistently on mixed-content practice questions?
Can I work through unfamiliar NCLEX-style questions without relying on memorized answers?
Can I interpret rationales and explain why an answer is correct?
Can I distinguish knowledge errors from clinical reasoning errors?
Can I recognize and prioritize important clinical cues?
Can I work through NGN case studies using clinical judgment?
Can I maintain concentration during longer practice sessions?
Is my performance reasonably consistent rather than dependent on one unusually good test?
Have I addressed recurring weaknesses instead of repeatedly testing without remediation?
Have I completed the necessary registration and authorization requirements?
Do I understand my exam appointment and test-day logistics?
Can I manage normal test anxiety without abandoning my clinical reasoning?
If several of these questions receive a “no,” the student may benefit from additional targeted NCLEX preparation.
If most receive a confident “yes,” and practice performance demonstrates sustained improvement and consistency, the student has stronger evidence that the NCLEX Study Plan has produced meaningful readiness.
The most important principle is that NCLEX readiness is multidimensional. A high practice percentage alone is insufficient, just as completing every chapter of a study guide does not automatically demonstrate competence. Readiness is better reflected by the ability to consistently apply nursing knowledge, use clinical judgment, recognize priorities, respond safely to unfamiliar situations, and maintain performance across different conditions.
The goal of an NCLEX Study Plan is therefore not to create a candidate who can memorize the greatest number of facts. It is to develop a nursing graduate who can think and respond like a safe entry-level registered nurse when confronted with changing clinical information. That distinction is especially important for the Next Generation NCLEX, where clinical judgment is integrated into the examination and measured through case studies and other item formats.
Final NCLEX Preparation and Test Day
The final stage of an NCLEX Study Plan is not the time to begin learning the entire nursing curriculum again. It is the time to consolidate what has already been learned, reinforce high-priority concepts, protect mental and physical readiness, and prepare to apply nursing knowledge effectively on exam day.
For many nursing students and nursing graduates, the final week can be emotionally challenging. After months of NCLEX prep, it is common to feel that there is still too much to study. A candidate may suddenly want to review every medication, disease, laboratory value, procedure, and nursing intervention. This approach can create unnecessary stress and may interfere with sleep and concentration.
A more effective final NCLEX Study Plan becomes increasingly focused as the exam approaches. The objective is to strengthen existing knowledge, address only meaningful remaining weaknesses, practice clinical judgment, and arrive at the testing center mentally alert and physically prepared.
The current NCSBN NCLEX-RN test plan should remain the primary framework for understanding what the examination is designed to measure. The 2026 RN Test Plan applies from April 1, 2026, through March 31, 2029, and emphasizes safe and effective entry-level nursing practice across the Client Needs categories, with clinical judgment integrated throughout the examination.
Final Week Study Plan
The final week of an NCLEX Study Plan should be different from the first weeks of preparation. Earlier stages may emphasize broad content review and extensive practice. The final week should emphasize consolidation, confidence, targeted remediation, and readiness.
The most important principle is to avoid trying to learn everything again.
A nursing graduate who has spent several months preparing for the NCLEX exam already possesses a substantial knowledge base. The final week should help organize and retrieve that knowledge rather than overwhelm the learner with an enormous amount of new information.
A practical final-week NCLEX Study Plan can be organized around four priorities:
Targeted content review
Clinical judgment and NCLEX practice
Identification of persistent weak areas
Physical and mental preparation for test day
Days 7–5 Before the NCLEX
Approximately one week before the NCLEX, the student can begin transitioning away from intensive broad review.
The focus should be on:
Reviewing persistent weak areas.
Revisiting high-priority nursing concepts.
Completing mixed practice questions.
Reviewing selected NGN case studies.
Reinforcing pharmacology principles.
Reviewing safety and prioritization concepts.
Reviewing important laboratory and assessment relationships.
Identifying concepts that still cause repeated confusion.
For example, suppose a student has repeatedly struggled with recognizing complications after surgery. Instead of reviewing every surgical condition, the student could focus on recognizing deterioration, expected versus unexpected findings, priority assessment, postoperative complications, and appropriate nursing responses.
This is more efficient than opening a comprehensive study guide and attempting to read every page again.
The same principle applies to pharmacology. Rather than attempting to memorize hundreds of individual medications, the student can review important medication classes and connect each class to:
Therapeutic purpose
Major adverse effects
Important assessments
Relevant laboratory monitoring
Safety precautions
Client education
Major contraindications
Findings requiring immediate intervention
This type of review supports clinical application rather than isolated memorization.
Days 4–3 Before the NCLEX
At approximately three to four days before the NCLEX test, the emphasis can shift toward integration.
A student might complete a mixed set of NCLEX-style questions and several NGN case studies, then perform focused review based on the results.
The objective is not to chase an increasingly high score. Instead, the student should ask:
What mistakes am I still making?
Are these mistakes caused by missing knowledge, poor interpretation, or clinical reasoning?
Which concepts are worth reviewing again before the exam?
For example, if a student repeatedly identifies the correct clinical problem but selects the wrong initial nursing action, the final review should focus on prioritization and intervention principles rather than adding dozens of new disease facts.
Likewise, if a student consistently confuses medication adverse effects, a short focused pharmacology review may be more valuable than completing another large randomized practice exam.
Days 2–1 Before the NCLEX
The final two days should generally involve a substantial reduction in study intensity.
The candidate can review concise notes, important concepts, selected medication principles, prioritization frameworks, and previously identified weak areas.
However, the student should avoid attempting to complete an enormous amount of NCLEX study during this period.
For example, studying for 12 hours the day before the exam may seem productive, but if it results in severe fatigue and inadequate sleep, the student may arrive at the examination with reduced concentration.
The final day should therefore be used to prepare both the mind and the logistics of exam day.
The candidate should:
Confirm the examination appointment.
Review the route to the testing center.
Determine transportation arrangements.
Prepare permitted identification and other required items.
Set an alarm.
Prepare comfortable clothing.
Plan meals and hydration.
Avoid unnecessary late-night studying.
Establish an appropriate bedtime.
Review the testing requirements from the official source.
Prepare mentally for the examination.
The final evening should not become a marathon NCLEX preparation session.
A student who encounters a difficult topic at 10:30 p.m. may feel an urge to continue studying until it is mastered. In many cases, the better decision is to recognize that the examination requires alertness and clinical judgment and that sleep is part of preparation.
Last-Minute Review and Preparation
Last-minute review is most useful when it is selective and active.
The goal is not to consume more information. The goal is to make important information easier to retrieve and apply.
A useful final NCLEX Study Plan might include concise review of:
Prioritization
Delegation and assignment
Safety
Infection prevention and control
Pharmacology
Common laboratory relationships
Physiological adaptation
Basic care and comfort
Health promotion and maintenance
Psychosocial integrity
Management of care
Important emergency findings
Clinical judgment
NGN case-study reasoning
The 2026 NCLEX-RN test plan identifies Management of Care and Pharmacological and Parenteral Therapies among the larger Client Needs areas by percentage range, while the examination also integrates clinical judgment across Client Needs categories. This makes these areas reasonable components of a structured review, but candidates should avoid interpreting the percentages as a prediction of the exact questions they will personally receive.
Use Active Recall Instead of Passive Reading
During the final days, active recall can be more useful than repeatedly reading a textbook.
For example, instead of reading a page about hypoglycemia several times, close the book and ask:
What are the signs of hypoglycemia?
What should the nurse assess?
What is the immediate nursing priority?
What intervention would be appropriate?
How would the response be evaluated?
This transforms NCLEX study from passive exposure into retrieval and application.
The same approach can be applied to pharmacology.
Instead of simply reading:
“Beta blockers can cause bradycardia.”
Ask:
What should I assess before administering a beta blocker?
What finding would cause me to question the medication?
What should I teach the patient?
What adverse effect requires attention?
This approach more closely reflects the reasoning required in nursing practice.
Evidence from health-professions education supports the value of distributed and retrieval-based learning, making active recall and appropriately spaced review useful components of exam preparation. A systematic review of 56 studies involving 63 experiments found that distributed/retrieval practice frequently produced significant learning benefits compared with comparison or control conditions.
Review Your Personal Error Log
The student’s own history of mistakes is often more useful during the final week than a generic list of “high-yield” topics.
A personal NCLEX Study Plan error log may reveal patterns such as:
Repeatedly missing delegation questions.
Confusing expected and unexpected findings.
Selecting an intervention before completing an assessment.
Missing important cues in NGN case studies.
Misinterpreting medication questions.
Choosing an answer that is correct but not the priority.
Overthinking straightforward questions.
Changing answers because of anxiety rather than evidence.
Reviewing these recurring errors allows the final preparation period to be personalized.
For example, if a student repeatedly chooses a technically correct intervention when another answer addresses an immediate threat to life, the student should review prioritization rather than spend several additional hours memorizing disease definitions.
Do Not Chase Every New Topic
One of the most common mistakes during the final phase of an NCLEX Study Plan is continually expanding the study list.
A nursing graduate may encounter a social media post claiming:
“These are the 100 topics you MUST know before the NCLEX.”
This can trigger unnecessary anxiety.
No unofficial list can predict the exact questions a candidate will receive. The NCLEX is designed using a test plan and computerized adaptive testing process, so candidates receive individualized examinations rather than a predetermined identical question set.
A better strategy is to prioritize concepts based on the current test plan, personal weaknesses, nursing fundamentals, safety principles, and demonstrated performance.
Avoid Learning Unverified “NCLEX Questions”
Candidates should also be cautious about websites or social-media groups claiming to provide “actual NCLEX questions” or guaranteed exam content.
The purpose of NCLEX preparation should be to develop nursing competence and clinical judgment, not to memorize recalled questions.
If a study resource encourages students to memorize answers without understanding why they are correct, it is unlikely to develop the type of flexible reasoning needed for unfamiliar exam questions.
A student should instead be able to encounter a new clinical scenario and ask:
What is happening?
What cues matter?
What is the greatest risk?
What should the nurse do first?
How will I know whether the intervention worked?
That reasoning remains useful even when the wording and clinical scenario change.
NCLEX Test-Taking Strategies
The NCLEX test requires more than knowledge. Candidates must manage information, identify what each question is asking, apply nursing judgment, and select the response that is best supported by the clinical situation.
The test-taking strategies used during the examination should therefore support—not replace—clinical reasoning.
Read the Question Before Becoming Distracted by the Options
When presented with an NCLEX question, first determine what the question is asking.
Look for the central task:
What should the nurse do first?
Which finding requires immediate attention?
Which client should the nurse assess first?
Which intervention is appropriate?
Which statement indicates understanding?
Which finding requires further teaching?
Which action requires intervention?
Which client is at greatest risk?
This prevents the candidate from becoming overwhelmed by the clinical information.
For example, if a question asks which patient should be assessed first, the task is prioritization. The candidate should not allow a large amount of background information to obscure the central issue.
Identify the Most Important Clinical Cues
The NCLEX frequently provides multiple pieces of information, but not every detail has equal importance.
A useful approach is to identify:
What is abnormal?
What is changing?
What could become life-threatening?
What requires immediate nursing attention?
Which information changes the priority?
For example, consider four patients:
One reports mild chronic back pain.
One requests assistance with a meal.
One has a new respiratory rate of 30/min with increasing confusion.
One needs routine discharge instructions.
The new respiratory deterioration should immediately attract attention because it represents a potentially unstable physiological condition.
The goal is not simply to recognize that all four patients have needs. The goal is to determine which need is most urgent.
Apply Safety and Priority Principles
When several options appear reasonable, consider fundamental nursing priorities.
Depending on the question, these may include:
Airway, breathing, and circulation.
Acute versus chronic conditions.
Unstable versus stable patients.
Actual problems versus potential problems.
Unexpected versus expected findings.
Immediate threats versus routine needs.
Assessment before intervention when additional assessment is needed.
Least restrictive and least invasive appropriate interventions.
Protection of the patient from immediate harm.
These principles should not be used as rigid formulas. Clinical context matters.
For example, “assess before intervening” is not appropriate if the patient is experiencing an immediately life-threatening emergency where urgent intervention is clearly required. Similarly, a potential problem may become more urgent than an existing stable problem when the potential complication represents an immediate threat.
The candidate should always return to the patient’s condition and the specific question.
Do Not Add Information That Is Not Provided
A common NCLEX question error is creating an imaginary clinical situation.
Suppose the question states that a patient is alert, has stable vital signs, and reports mild postoperative discomfort. A candidate should not assume that the patient is about to deteriorate simply because postoperative complications are possible.
Answer the question based on the information provided.
This is particularly important with NGN case studies, where the examination intentionally provides multiple pieces of information. The candidate should distinguish actual cues from imagined possibilities.
Pay Attention to Qualifying Words
Words such as:
First
Priority
Best
Immediate
Requires further teaching
Requires intervention
Most appropriate
Most important
Expected
Unexpected
can change what the question is asking.
For example, two answers may both be clinically appropriate, but the question may ask which intervention should occur first. In that situation, selecting an intervention that is appropriate but lower priority may still be incorrect.
The candidate should therefore identify the exact decision being tested before evaluating the options.
Do Not Treat All Correct Statements as Correct Answers
Some NCLEX-style questions are challenging because several options may contain accurate information.
The question is often asking for the best response under the circumstances.
For example, a patient may require assessment, education, emotional support, and monitoring. All four may be appropriate nursing activities. If the question asks what the nurse should do first and the patient is showing signs of acute deterioration, immediate assessment or intervention related to the deterioration may take priority.
This distinction between “true” and “best” is central to NCLEX test-taking.
Avoid Changing Answers Without a Reason
Candidates sometimes select an appropriate answer and then change it because they become anxious.
Changing an answer is not automatically wrong. If the candidate recognizes that the original choice was based on a misunderstanding, changing it may be appropriate.
However, answers should not be changed simply because:
“This seems too obvious.”
“The other option sounds more complicated.”
“I have not seen this question before.”
“I think the NCLEX is trying to trick me.”
A better approach is to change an answer only when there is a clear clinical or textual reason.
Use the Information in NGN Case Studies
For Next Generation NCLEX questions, the candidate should treat the case as an evolving clinical situation.
The patient may have:
Initial assessment findings.
Laboratory results.
Vital-sign changes.
Medication information.
Provider orders.
Nursing interventions.
Changes in condition.
Follow-up findings.
The candidate should continually ask:
What changed?
Which cue is new?
What does the change mean?
What problem is becoming more important?
What action should follow?
Did the patient improve after the intervention?
This reflects the clinical judgment process emphasized by the NCSBN.
For example, a patient initially reports mild shortness of breath. Later, the patient becomes increasingly tachypneic, oxygen saturation declines, and mental status changes. The candidate should not continue treating the situation as though the original presentation remains unchanged. The new cues should alter the clinical priority.
Do Not Panic When You See Difficult Questions
An unfamiliar or difficult NCLEX question does not automatically indicate poor performance.
The NCLEX uses computerized adaptive testing, meaning the examination is designed to select questions based on the candidate’s estimated ability. Candidates should therefore expect questions that challenge them. The NCSBN also notes that examination length is not itself an indicator of whether a candidate passed or failed.
If a question seems difficult, the candidate should:
Read the question carefully.
Identify the clinical task.
Identify the relevant cues.
Eliminate clearly inappropriate options.
Apply safe nursing principles.
Select the best-supported answer.
Move forward.
The candidate does not need to feel certain about every answer.
Remember That You Cannot Return to Previous Questions
The NCLEX does not allow candidates to return to a previous item after proceeding. Candidates should therefore answer each question carefully before moving forward rather than assuming they can revisit difficult questions later.
This makes focused reading especially important.
However, it does not mean that every question should consume an excessive amount of time. If a candidate has considered the available evidence and selected the best-supported answer, continuing to repeatedly reconsider the same information may not improve the decision.
Managing Test Anxiety and Exam-Day Logistics
Test anxiety is common among nursing students and nursing graduates preparing for the NCLEX-RN. Because the examination represents an important step toward professional licensure and a nursing career, candidates may experience fear, self-doubt, racing thoughts, difficulty sleeping, or physical tension.
The goal is not necessarily to eliminate all anxiety. A more realistic goal is to prevent normal anxiety from interfering with clinical judgment and test-taking.
Prepare the Logistics Before Test Day
One of the simplest ways to reduce unnecessary stress is to eliminate avoidable logistical problems.
Before exam day, confirm:
Examination date and time.
Testing location.
Transportation.
Expected travel time.
Parking or access arrangements, if applicable.
Required identification.
Testing-center requirements.
Appointment details.
Any permitted or prohibited personal items.
Alarm and wake-up arrangements.
Food and hydration plans.
Candidates should verify current requirements using official examination information rather than relying on advice from another test taker whose examination occurred under different rules.
The NCSBN Candidate Bulletin provides important information about registration, examination procedures, identification, security, and candidate responsibilities.
Plan Your Morning
A predictable morning can reduce unnecessary cognitive load.
A candidate might:
Wake up with enough time to avoid rushing.
Eat a familiar meal if they normally eat breakfast.
Hydrate normally.
Dress comfortably.
Leave early enough to accommodate unexpected delays.
Avoid attempting to learn large amounts of new information immediately before leaving.
Bring only items permitted under the current testing requirements.
For example, if the testing center is 45 minutes away, leaving with only 45 minutes available is risky. Traffic, navigation problems, parking, or unexpected delays can create anxiety before the examination even begins.
The purpose of planning is to make the morning as routine as possible.
Use Brief Anxiety-Control Techniques
If anxiety increases before or during the NCLEX, simple techniques can help restore attention.
A candidate can pause briefly, relax the shoulders, take a slow breath, and redirect attention to the question.
A useful mental sequence is:
Stop → breathe → read → identify the task → recognize the cues → reason → answer → move forward.
This prevents one difficult question from triggering a chain of anxious thoughts about the entire examination.
For example:
“I don’t know this question. I’m going to fail.”
can be replaced with:
“This question is difficult, but I only need to determine what the patient needs based on the information provided.”
That change does not guarantee the answer will be correct, but it brings attention back to the clinical problem.
Avoid Comparing Yourself With Other Test Takers
During exam day, candidates may hear other people discussing how many questions they received or what topics appeared on their examination.
Such comparisons are not useful.
The NCLEX uses CAT, so examinations are individualized. One candidate may receive a different number and sequence of questions from another candidate. The number of questions received should not be interpreted as a pass/fail signal.
Therefore, a candidate should avoid thinking:
“My friend passed after 85 questions, so if I go beyond 85, I must be failing.”
or:
“Someone else received easier questions than I did.”
These assumptions do not provide reliable information about examination performance.
The candidate’s responsibility is to answer the question currently displayed as carefully as possible.
Do Not Let One Difficult Question Affect the Next One
A difficult question should remain one difficult question.
If a candidate spends several minutes mentally replaying a previous item, attention is being taken away from the current item.
A useful approach is:
Answer → accept the decision → reset → focus on the next question.
This is especially important during an adaptive examination because candidates may encounter challenging questions throughout the testing experience.
Use Breaks Intentionally
Candidates should understand the current testing-center rules regarding breaks and follow the instructions provided at the examination site.
If a break is permitted or necessary, use it to reset rather than to search online for answers or compare experiences with other candidates.
A short break can be used to:
Breathe.
Stretch.
Drink water if permitted.
Use the restroom.
Reset attention.
Return with a clear mind.
The purpose is to restore concentration, not to evaluate how the examination is going.
Remember What the NCLEX Is Actually Asking You to Demonstrate
The NCLEX-RN is not asking candidates to prove that they know every detail ever taught in nursing school. It is designed to determine whether they demonstrate the competencies needed for safe and effective entry-level nursing practice.
This perspective can help reduce the pressure to achieve perfection.
When confronted with an unfamiliar question, think like a safe entry-level registered nurse:
What is the patient’s most important problem?
What information matters most?
What could cause immediate harm?
What should the nurse do?
What outcome should be expected?
What finding would require escalation?
These questions bring the candidate back to nursing practice rather than fear of the examination.
The Final Mindset for NCLEX Test Day
The final stage of an NCLEX Study Plan should produce a candidate who is prepared to think, not a candidate who believes they have memorized every possible NCLEX question.
On test day, remember that:
You do not need to know everything.
You should read every question carefully.
You should focus on the information provided.
You should prioritize safety and patient needs.
You should use clinical judgment when several options appear plausible.
You should not interpret difficult questions as evidence of failure.
You should not compare your examination experience with another candidate’s.
You should answer each item before moving forward.
You should maintain concentration from the beginning to the end of the examination.
You should trust the nursing knowledge and reasoning developed through your NCLEX preparation.
A successful final NCLEX Study Plan is therefore not defined by studying until the last possible minute. It is defined by entering the examination prepared, rested, organized, and capable of applying nursing knowledge to unfamiliar clinical situations.
The final week should consolidate knowledge. Last-minute review should target meaningful weaknesses. NCLEX test-taking should emphasize careful interpretation and clinical judgment. Exam-day preparation should remove avoidable logistical barriers and support concentration.
For the nursing graduate, the purpose of this final preparation is to transition from studying about nursing to demonstrating the ability to think and act as a safe entry-level registered nurse. That is the standard the NCLEX-RN is designed to assess, and it should remain the central focus of the final stage of every effective NCLEX Study Plan.
After Taking the NCLEX-RN
Completing the NCLEX-RN is a major milestone in the transition from nursing school to professional practice. However, finishing the examination does not necessarily mean that every question has been answered with certainty or that the candidate immediately knows the result. The period after the NCLEX exam can therefore involve a mixture of relief, uncertainty, excitement, and anxiety.
The post-examination stage should be considered part of the overall NCLEX Study Plan. Preparation does not end simply because the final question has been answered. Candidates need to understand how results are communicated, what passing means for the beginning of a nursing career, and what steps to take if the examination is unsuccessful.
The NCLEX is a licensure examination developed to determine whether candidates demonstrate the competencies required for safe and effective entry-level nursing practice. The examination is administered through computerized adaptive testing, and the candidate’s performance is evaluated against the established passing standard rather than against a fixed percentage of other test takers.
Because the NCLEX-RN is a regulatory examination, candidates should rely on official information from the National Council of State Boards of Nursing (NCSBN) and their nursing regulatory body when interpreting results or determining what happens next. Procedures for receiving results, licensure, and retesting can vary according to jurisdiction.
Understanding Your NCLEX Results
One of the most stressful parts of taking the NCLEX-RN is waiting to learn the outcome. Candidates sometimes leave the testing center believing that they failed because they encountered difficult questions, received a large number of questions, or were uncertain about many of their answers.
These impressions are not reliable indicators of the result.
The NCSBN explains that the number of questions a candidate receives is not itself a pass/fail indicator. The NCLEX uses computerized adaptive testing, meaning the examination selects subsequent items based on the candidate’s demonstrated performance. Consequently, two candidates can receive examinations that differ substantially in content, sequence, and length.
A candidate should therefore avoid trying to calculate the result from the number of questions answered.
For example, a nursing graduate might think:
“I reached 150 questions, so I must have failed.”
Another candidate might think:
“My exam stopped at 85 questions, so I definitely passed.”
Neither conclusion is justified solely by examination length. The NCLEX can end at different points depending on the candidate’s performance and the rules governing examination termination.
How the NCLEX Determines the Result
The NCLEX-RN does not use a simple classroom-style percentage such as “75% correct equals passing.”
Instead, the CAT system continuously evaluates the candidate’s demonstrated ability relative to the passing standard. The examination ends when the applicable stopping rule is satisfied. The NCSBN explains that the passing standard represents the level of ability necessary for safe and effective entry-level nursing practice.
This is an important distinction when interpreting the experience of taking the NCLEX test.
A candidate can answer some difficult questions incorrectly and still pass. Likewise, answering many questions correctly does not mean that the candidate can calculate a conventional percentage and determine the outcome.
This is why candidates should not attempt to reconstruct their performance immediately after the examination.
When and How Results Are Received
The process for receiving NCLEX results depends on the candidate’s jurisdiction and the applicable reporting procedures.
Candidates should distinguish between:
Official examination results.
Results or licensure information provided by the nursing regulatory body.
Any authorized quick-result service that may be available in the candidate’s jurisdiction.
Informal interpretations of examination behavior or question count.
The official result and licensure status should be confirmed through the appropriate regulatory authority.
Candidates should also be cautious about websites, social-media posts, or individuals claiming that they can determine whether someone passed based on the number of questions received or the types of questions encountered.
For example, statements such as:
“You received mostly difficult questions, so you definitely passed.”
or:
“Your test shut off at the minimum number of questions, so you are guaranteed to pass.”
are not reliable methods of determining an individual’s NCLEX outcome.
The candidate should wait for the appropriate official result rather than attempting to interpret every aspect of the examination experience.
Do Not Obsess Over Individual Questions
After completing the NCLEX, it is common to remember several questions and wonder whether the selected answers were correct.
A candidate may think:
“I should have selected the other medication.”
“I knew that laboratory value but forgot it.”
“Why did I choose that intervention?”
This type of post-examination review rarely provides useful information because the candidate does not know the scoring context, item difficulty, or how the overall examination was evaluated.
The better approach is to recognize that the examination is complete.
The candidate should avoid searching the internet for remembered NCLEX questions and attempting to determine whether every answer was correct. This can increase anxiety without providing a reliable result.
Instead, focus on the next practical step: waiting for official results.
What a Passing Result Means
A passing NCLEX-RN result indicates that the candidate has demonstrated the level of ability required by the examination’s passing standard for safe and effective entry-level nursing practice.
However, passing the NCLEX does not mean that the nurse has mastered every area of nursing. New graduates continue learning through orientation, supervision, continuing education, clinical experience, and professional development.
For example, a newly licensed registered nurse may have passed the NCLEX exam successfully but still require substantial orientation before independently caring for a complex patient assignment.
This distinction is important. The NCLEX establishes readiness for entry-level licensure; it does not certify that a nurse has extensive specialty experience.
What to Do After Passing the NCLEX
Passing the NCLEX-RN is an important professional achievement. After months of nursing school, NCLEX preparation, practice questions, case studies, and clinical learning, receiving a passing result marks the transition from student nurse to licensed professional, subject to completion of the applicable jurisdictional licensure process.
The next steps should be practical and career-focused.
Confirm Your Nursing Licensure
After receiving a passing result, the candidate should verify the status of their nursing license with the appropriate nursing regulatory body.
The NCLEX is one component of the licensure process. Candidates should follow the requirements established by their jurisdiction and confirm when their license becomes active.
A useful post-NCLEX checklist includes:
Confirm the official NCLEX result.
Check nursing regulatory-body records for license status.
Confirm the correct name and license information.
Save important licensure documentation.
Follow any remaining jurisdiction-specific requirements.
Keep professional records organized.
The exact procedure varies by jurisdiction, so candidates should use their regulatory body’s official instructions rather than assuming that the process is identical everywhere.
Update Your Résumé
Once licensed, the new registered nurse should update their résumé to accurately reflect their professional status.
For example, a résumé may previously have stated:
BSN Graduate | NCLEX Candidate
After licensure, it should be updated to reflect the appropriate nursing credential and active licensure status according to the jurisdiction.
The candidate should never list a nursing license as active before it has actually been granted.
A new RN résumé can emphasize:
Nursing education.
Clinical rotations.
Relevant clinical experience.
Certifications.
Academic achievements.
Leadership experience.
Relevant volunteer activities.
Electronic health record experience.
Patient-care skills.
Relevant employment experience.
The résumé should remain accurate and should not imply independent professional experience that the candidate has not yet obtained.
Begin the Job Search
After licensure, the new RN can begin or continue applying for nursing positions.
Potential entry-level opportunities may include:
Medical-surgical nursing.
Long-term care.
Rehabilitation.
Ambulatory care.
Community health.
Mental health.
Pediatrics.
Women’s health.
Emergency nursing, where entry-level opportunities and employer requirements permit.
New-graduate residency programs.
A new graduate should examine job descriptions carefully because requirements differ among employers.
For example, one hospital may offer a structured new-graduate residency with classroom education, preceptorship, and progressive clinical responsibilities. Another employer may have a shorter orientation period.
Passing the NCLEX-RN establishes licensure eligibility but does not eliminate the importance of employer-specific orientation and competency development.
Prepare for New-Graduate Orientation
Passing the NCLEX is not the end of learning. It is the beginning of professional nursing practice.
A new RN should expect to continue developing:
Clinical prioritization.
Time management.
Medication administration.
Patient assessment.
Documentation.
Communication.
Delegation.
Interprofessional collaboration.
Patient education.
Recognition of deterioration.
Emergency response.
Clinical judgment.
The transition from nursing school to employment can feel very different from the structured environment of a nursing program.
For example, during nursing school, a student may care for a limited number of patients under direct supervision. During professional practice, the RN may gradually assume responsibility for multiple patients while coordinating medications, assessments, documentation, communication, admissions, discharges, and changes in patient condition.
The goal is not to expect a new graduate to know everything immediately. The goal is to recognize when assistance is needed and to continue developing safe nursing practice.
Maintain Professional Development
A successful NCLEX Study Plan should eventually give way to a broader professional learning plan.
After becoming an RN, the nurse should remain aware of:
License-renewal requirements.
Continuing education requirements.
Employer competency requirements.
Certification opportunities.
Evidence-based practice updates.
Scope-of-practice requirements.
Professional standards.
Specialty-specific education.
Nursing is a continually changing profession. New graduates should therefore view the NCLEX as one milestone in lifelong professional education.
Celebrate the Achievement
The emotional importance of passing the NCLEX-RN should not be overlooked.
For many nursing graduates, the examination represents the culmination of years of coursework, clinical rotations, examinations, assignments, financial investment, personal sacrifice, and professional preparation.
Taking time to acknowledge the achievement can provide a meaningful transition from the intensity of NCLEX prep into professional nursing.
Celebration does not have to be elaborate. The important point is to recognize that becoming licensed is a significant professional milestone.
What to Do After an Unsuccessful Attempt
An unsuccessful NCLEX-RN attempt can be deeply disappointing, especially after extensive preparation. However, an unsuccessful result should not be interpreted as proof that a candidate cannot become a registered nurse.
Instead, it should be treated as information that can guide a more targeted NCLEX Study Plan.
The first response should be to allow time to process the result. A candidate may experience disappointment, frustration, embarrassment, or self-doubt. These reactions are understandable.
The next step is to move from emotion to analysis.
Obtain and Review the Appropriate Performance Information
Candidates who do not pass may receive a candidate performance report or other performance information, depending on the applicable examination and regulatory procedures.
The report can help identify areas in which the candidate’s performance needs improvement. The exact reporting process and available information should be confirmed through the candidate’s nursing regulatory body and official NCSBN information.
The candidate should avoid interpreting an unsuccessful attempt as:
“I know nothing about nursing.”
A more accurate interpretation is:
“My performance did not demonstrate the required level on this examination attempt, and I need to identify where and how my preparation should change.”
That difference is important.
Analyze the Weak Areas
An unsuccessful NCLEX attempt should lead to a revised study strategy rather than simply repeating the previous one.
For example, suppose a candidate’s performance information and practice history indicate weaknesses in:
Management of Care.
Pharmacological and Parenteral Therapies.
Physiological Adaptation.
Clinical judgment.
The candidate should not simply restart the same NCLEX Study Plan from page one.
Instead, the new plan should target these areas.
The student might divide study time into:
Content rebuilding: Review concepts that are genuinely unfamiliar.
Application: Complete practice questions that require those concepts to be applied.
Clinical judgment: Work through NGN case studies and changing patient scenarios.
Remediation: Analyze why questions are missed and correct recurring reasoning errors.
Reassessment: Test the same areas again after targeted study.
This creates a cycle of:
Assess → Remediate → Practice → Reassess.
Do Not Assume More Questions Will Automatically Fix the Problem
A common response after an unsuccessful NCLEX exam is to dramatically increase the number of practice questions.
More questions can be useful, but quantity alone does not guarantee improvement.
For example, a candidate might complete 150 practice questions every day but spend only a few minutes reviewing rationales. Another candidate might complete 50 carefully selected questions and spend substantial time understanding the underlying concepts and reasoning.
If the first candidate continues making the same errors, increasing the number of questions may simply reinforce the same mistakes.
The purpose of NCLEX practice questions is to identify and correct weaknesses.
Therefore, a candidate should ask:
Why did I miss this question?
What information did I not know?
Which cue did I overlook?
Did I misunderstand the question?
Did I fail to prioritize correctly?
Did I know the content but apply it incorrectly?
What will I do differently next time?
These questions turn an unsuccessful attempt into a learning opportunity.
Determine Whether the Problem Was Content, Clinical Judgment, or Test-Taking
A revised NCLEX Study Plan should be based on the reason for poor performance.
If the primary problem is content knowledge, the candidate may need structured review of nursing fundamentals, pharmacology, pathophysiology, assessment, and relevant Client Needs categories.
If the primary problem is clinical judgment, the candidate may need more practice recognizing cues, analyzing patient information, prioritizing hypotheses, generating solutions, taking appropriate action, and evaluating outcomes.
If the primary problem is test-taking, the candidate may need to improve question interpretation, prioritization, elimination of inappropriate answers, pacing, and concentration.
If the problem is a combination, the NCLEX preparation strategy should address each component.
For example, a candidate may know the signs of sepsis but consistently miss questions because they fail to recognize which finding represents the greatest immediate concern. The solution is not simply more sepsis memorization. The candidate needs practice applying assessment findings and prioritization principles.
Rebuild the Study Schedule
A candidate preparing for a retake should create a new NCLEX Study Plan rather than automatically following the original schedule.
The revised schedule might include:
Week 1: Review performance information and identify priority weaknesses.
Weeks 2–4: Rebuild foundational knowledge and complete targeted practice.
Weeks 5–7: Increase mixed-content practice and NGN case studies.
Weeks 8–9: Complete longer practice sessions and reassess weak areas.
Final phase: Consolidate knowledge, confirm readiness, and prepare for the next test date.
The exact length should be individualized.
A candidate with significant content gaps may require a longer preparation period. Someone with relatively strong content knowledge but inconsistent clinical judgment may need a different emphasis.
The important point is that the second NCLEX Study Plan should be informed by evidence from the first attempt.
Avoid Shame and Unhelpful Comparisons
One unsuccessful attempt does not define a nurse’s future.
Candidates may compare themselves with classmates who passed on their first attempt and conclude that they are less capable.
That conclusion is not justified.
Different candidates enter the NCLEX with different educational experiences, preparation methods, anxiety levels, testing histories, content strengths, and clinical reasoning skills.
A more productive comparison is:
“What did I learn about my preparation from this attempt, and what can I change before the next one?”
This shifts the focus from judgment to improvement.
Follow Retesting Requirements
Candidates who do not pass should carefully review the retesting requirements that apply to their jurisdiction.
The NCSBN provides examination information, but nursing regulatory bodies establish and administer licensure requirements within their respective jurisdictions. Retesting eligibility, waiting periods, applications, fees, and other requirements may therefore vary.
Before scheduling another NCLEX test, the candidate should verify:
Whether a waiting period applies.
Whether a new application is required.
Whether another authorization to test is required.
Whether fees must be paid again.
Whether additional documentation is required.
Whether the jurisdiction imposes limits or additional requirements for repeat attempts.
Candidates should rely on their nursing regulatory body and current official NCSBN information for these details rather than an outdated study guide or advice from another test taker.
Return to the NCLEX With a Different Strategy
A retake should not simply be a repetition of the first attempt.
If the original NCLEX Study Plan consisted primarily of reading, the candidate may need more active recall and application.
If it consisted primarily of practice questions, the candidate may need stronger content review and deeper rationale analysis.
If the candidate knew the content but struggled with NGN case studies, the revised plan should emphasize clinical judgment.
If anxiety interfered with performance, the preparation plan should incorporate strategies for managing examination stress and maintaining concentration.
For example:
First attempt: Read study guide → complete questions → check score → move to next topic.
Revised approach: Assess weak areas → review concepts → retrieve information without notes → apply concepts through NCLEX-style questions → analyze errors → practice NGN case studies → reassess performance → adjust study time.
The second approach is more diagnostic and responsive.
An unsuccessful NCLEX-RN attempt can therefore become a turning point in preparation. It provides information about what the candidate needs to strengthen before trying again.
The most important response is neither to panic nor to ignore the result. It is to analyze the available evidence, address the specific weaknesses, revise the NCLEX Study Plan, and prepare with a more targeted strategy.
For candidates who pass, the next stage is professional transition: confirming licensure, beginning the job search, entering orientation, and continuing to develop nursing competence.
For candidates who do not pass, the next stage is targeted reassessment: understanding performance information, identifying weaknesses, following retesting requirements, and building a revised preparation strategy.
In both situations, the NCLEX should be viewed as one stage in a much larger nursing journey. Passing marks an important step toward professional practice, while an unsuccessful attempt can provide valuable information for strengthening preparation. What matters after the examination is responding to the result thoughtfully and using the experience to support safe, competent, and sustainable nursing practice.
Conclusion
Preparing for the NCLEX-RN is more than completing a study guide, memorizing laboratory values, or answering thousands of practice questions. It is a structured process of transforming the knowledge gained through nursing school into the clinical judgment, prioritization, problem-solving, and safe decision-making expected of an entry-level registered nurse. A well-designed NCLEX Study Plan provides the framework for making that transformation purposeful, organized, and measurable.
An effective NCLEX Study Plan begins with understanding the current NCLEX-RN test plan and recognizing that the examination evaluates competencies across the Client Needs categories while integrating clinical judgment throughout the examination. From there, successful NCLEX preparation requires an honest assessment of strengths and weak areas, realistic study goals, a manageable study schedule, reliable study resources, active content review, meaningful practice questions, and repeated opportunities to apply nursing knowledge to unfamiliar clinical situations.
The Next Generation NCLEX has made clinical judgment an especially important component of examination preparation. Nursing graduates must be able to recognize relevant cues, analyze information, prioritize patient needs, generate appropriate solutions, take safe action, and evaluate outcomes. These skills cannot be developed effectively through memorization alone. They require deliberate practice with realistic scenarios, NGN case studies, changing patient conditions, and questions that require the candidate to determine what matters most in a clinical situation.
Equally important is the ability to evaluate NCLEX readiness objectively. A single practice-test score does not determine whether someone is ready to pass the NCLEX. Stronger evidence comes from consistent performance across mixed content, improvement in previously weak areas, effective clinical judgment, the ability to explain why answers are correct, and the capacity to maintain concentration during longer testing sessions. Practice exams should therefore be used as diagnostic tools that guide remediation rather than as guarantees of an examination outcome.
The final stage of the NCLEX Study Plan should focus on consolidation rather than panic-driven studying. During the final week, candidates benefit from targeted review, active recall, selective pharmacology and high-priority content review, continued clinical judgment practice, and adequate rest. On exam day, careful reading, recognition of relevant cues, prioritization, patient-safety principles, and disciplined decision-making are more valuable than trying to predict what questions will appear.
It is also important to remember that the NCLEX is only one milestone in a nursing career. Passing the examination represents an important achievement and opens the pathway toward professional licensure and practice, but it does not mark the end of learning. New registered nurses continue developing clinical competence through orientation, mentorship, experience, continuing education, evidence-based practice, and lifelong professional development.
For candidates who do not pass on the first attempt, the result should not be viewed as the end of the nursing journey. An unsuccessful attempt can provide information about areas requiring further development. By reviewing available performance information, identifying content and clinical reasoning weaknesses, following applicable retesting requirements, and developing a revised NCLEX Study Plan, a candidate can approach the next attempt with greater insight and a more targeted strategy.
The most effective approach to the NCLEX is therefore not to ask, “How can I memorize enough information to pass?” but rather, “How can I consistently think, prioritize, and respond like a safe entry-level registered nurse?” That shift in perspective captures the true purpose of NCLEX preparation.
With a structured NCLEX Study Plan, realistic study schedule, reliable resources, deliberate practice, strong clinical judgment, thoughtful readiness assessment, and appropriate preparation for test day, nursing graduates can approach the NCLEX-RN with greater confidence and purpose. The examination may be challenging, but preparation becomes far more manageable when every study session is directed toward the same goal: demonstrating the knowledge and judgment necessary to provide safe and effective nursing care.
Frequently Asked Questions
How hard is the NCLEX-RN exam in 2026?
The 2026 NCLEX-RN can be challenging because it tests clinical judgment, prioritization, application of nursing knowledge, and safe decision-making, rather than simple memorization. The Next Generation NCLEX (NGN) also includes case studies and newer question types designed to assess clinical judgment.
What are some good study plans for the NCLEX-RN exam?
A good NCLEX Study Plan should combine content review, daily practice questions, NGN case studies, pharmacology review, and targeted work on weak areas. A 3-month NCLEX Study Plan can be effective, with the first month focused on foundational content, the second on application and clinical judgment, and the final month on practice exams and readiness.
What are the best NCLEX-RN prep books for the 2026 exam?
The best NCLEX-RN prep books are those that are aligned with the current 2026 NCLEX-RN Test Plan, provide realistic NCLEX-style questions, detailed rationales, and NGN case studies. Choose current editions rather than older books because the test plan and question formats can change.
What to study for 2026 NCLEX?
Study the 2026 NCLEX-RN Test Plan and its Client Needs categories, including Management of Care, Safety and Infection Prevention and Control, Health Promotion and Maintenance, Psychosocial Integrity, Basic Care and Comfort, Pharmacological and Parenteral Therapies, Reduction of Risk Potential, and Physiological Adaptation. Give particular attention to clinical judgment, prioritization, pharmacology, safety, and NGN case studies.
Lipase Normal Range: Understanding the Lipase Blood Test and What Your Results Mean
The Lipase Normal Range is one of the most important laboratory reference values used to assess pancreatic function and evaluate patients with suspected pancreatic disorders. Lipase is a digestive enzyme primarily produced by the pancreas, where it plays a vital role in breaking down dietary fats into smaller molecules that can be absorbed by the body. Under normal physiological conditions, only small amounts of this enzyme circulate in the bloodstream. However, when the pancreas becomes inflamed, injured, or affected by disease, lipase may leak into the blood, resulting in abnormal laboratory values. For this reason, the lipase blood test has become an essential diagnostic tool in modern clinical practice, particularly when evaluating patients with symptoms suggestive of pancreatic disease.
Interpreting lipase levels, however, involves much more than determining whether a result falls within or outside the normal range. Although elevated lipase is strongly associated with acute pancreatitis, abnormal lipase values can also occur in chronic pancreatitis, pancreatic cancer, gallbladder disease, intestinal disorders, kidney disease, and several other medical conditions. Likewise, low lipase levels, while less frequently encountered, may indicate reduced pancreatic enzyme production or long-standing pancreatic dysfunction. Consequently, healthcare professionals must interpret lipase test results within the broader clinical context, taking into account the patient’s symptoms, medical history, physical examination findings, additional laboratory investigations, and diagnostic imaging rather than relying on a single laboratory value alone.
An understanding of the Lipase Normal Range is therefore essential for anyone involved in the interpretation of laboratory findings and the care of patients with gastrointestinal or pancreatic disorders. Beyond recognizing whether a lipase level is normal, clinicians must understand the physiological role of lipase, the factors that influence serum concentrations, the limitations of laboratory testing, and the clinical significance of both elevated and decreased values. Equally important is recognizing that laboratory reference ranges may vary between healthcare facilities because of differences in analytical methods, testing equipment, and population-specific reference intervals. Appreciating these factors helps ensure that laboratory findings are interpreted accurately and in conjunction with the patient’s overall clinical presentation.
This guide provides a comprehensive examination of the Lipase Normal Range and the clinical applications of the lipase blood test. It begins by explaining the biological role of lipase and its importance in digestion before exploring how the test is performed, when it is indicated, and the factors that may influence test results. The discussion then examines normal reference ranges, the interpretation of high and low lipase levels, common pancreatic and non-pancreatic causes of abnormal results, and the role of lipase in diagnosing acute and chronic pancreatic disorders. In addition, the guide explains why lipase is frequently interpreted alongside amylase and diagnostic imaging, outlines the limitations of lipase testing, and discusses important nursing considerations related to patient preparation, specimen collection, result interpretation, patient education, and follow-up care. By understanding these concepts, readers will be better equipped to interpret lipase laboratory findings accurately, appreciate their clinical significance, and apply this knowledge in evidence-based patient care.
What Is Lipase and Why Is It Important?
Lipase is a digestive enzyme that plays an indispensable role in the digestion and absorption of dietary fats. Every day, the human body consumes fats in the form of triglycerides from foods such as meat, dairy products, fish, nuts, seeds, cooking oils, and avocados. Before these fats can be absorbed through the intestinal wall and used for energy, hormone production, cell membrane formation, and vitamin absorption, they must first be broken down into smaller molecules. This process is made possible by an enzyme called lipase, which catalyzes the hydrolysis of triglycerides into free fatty acids and monoglycerides.
Although lipase is primarily associated with thepancreas, it is produced in several parts of the body, each contributing to fat digestion at different stages. However, pancreatic lipase is by far the most important form because it is responsible for digesting the majority of dietary fats once food reaches the small intestine.
Under normal physiological conditions, only a small amount of lipase enters the bloodstream. As a result, lipase in your blood remains relatively low, producing normal lipase concentrations that fall within the laboratory reference range. When pancreatic cells become inflamed or damaged, however, significantly more lipase leaks into the circulation. This increase forms the basis of the lipase blood test, a laboratory test that helps clinicians evaluate pancreatic injury and contributes to the diagnosis of acute pancreatitis and other pancreatic disorders.
Understanding the biological role of lipase is essential because the enzyme serves two equally important purposes:
Physiological function: It enables normal digestion and absorption of dietary fat.
Clinical significance: Changes in blood lipase levels provide valuable information about pancreatic health and help clinicians diagnose several medical conditions.
Rather than viewing lipase simply as a laboratory value, it should be understood as both a vital digestive enzyme and an important biomarker that reflects the functional status of the pancreas.
Behind on multiple nursing assignments?
Our team will handle them while you focus on learning and clinical work.
Digestion begins in the mouth and stomach, but fat digestion occurs predominantly in the small intestine, where pancreatic secretions mix with partially digested food. The digestive system is highly coordinated, requiring several organs and enzymes to work together efficiently. While bile produced by the liver emulsifies fats into tiny droplets, it is pancreatic lipase that chemically breaks these droplets into absorbable components.
The digestive process involving lipase can be summarized in several steps:
Consumption of dietary fat
Foods containing triglycerides enter the digestive tract.
Mechanical digestion begins through chewing and stomach contractions.
Release of bile
The liver produces bile, which is stored in the gallbladder.
Bile salts emulsify fat into microscopic droplets, increasing the surface area available for enzyme activity.
Release of pancreatic lipase
The pancreas secretes pancreatic juice containing the enzyme lipase into the duodenum.
Lipase acts on emulsified triglycerides.
Breakdown of triglycerides
Lipase converts triglycerides into:
Free fatty acids
Monoglycerides
Absorption
These smaller molecules are absorbed through the intestinal lining and transported throughout the body for energy storage, cellular function, and metabolic processes.
Without adequate lipase activity, fat digestion becomes incomplete, leading to poor absorption of nutrients. This condition can result in steatorrhea (fatty stools), weight loss, deficiencies of fat-soluble vitamins (A, D, E, and K), and malnutrition.
For example, a patient with advanced chronic pancreatitis may experience progressive destruction of pancreatic tissue. As the pancreas loses its ability to produce digestive enzymes, including lipase, the patient may develop chronic diarrhea, oily stools, unintended weight loss, and vitamin deficiencies despite consuming a normal diet. In this situation, symptoms arise not only because of inflammation but also because insufficient lipase is available to digest dietary fats effectively.
Support of hormone synthesis and cell membrane integrity.
These functions explain why disturbances in lipase production can have widespread effects extending far beyond the digestive tract.
Where Lipase Is Produced
Although the pancreas is the principal source of circulating lipase measured during a lipase test, it is not the only organ capable of producing this enzyme. Different forms of lipase are synthesized throughout the gastrointestinal tract and other tissues, each serving a specialized function.
Major sources of lipase include:
1. The pancreas (primary source)
The pancreas is responsible for producing most of the lipase required for normal digestion. Specialized acinar cells synthesize and secrete pancreatic lipase, which travels through the pancreatic ducts into the duodenum after food enters the digestive tract.
This pancreatic enzyme performs the majority of fat digestion and is the form most closely associated with pancreatic injury. When inflammation damages pancreatic cells, serum lipase levels rise because the enzyme escapes into the bloodstream.
2. The tongue
Small quantities of lingual lipase are secreted by glands located on the tongue. Although this enzyme begins fat digestion in the mouth and continues to function within the acidic environment of the stomach, its contribution in healthy adults is relatively minor compared with pancreatic lipase.
Lingual lipase is particularly important in newborns because infants consume fat-rich milk and have immature pancreatic function.
3. The stomach
Chief cells within the stomach produce gastric lipase, which contributes modestly to fat digestion before food reaches the intestine. Gastric lipase becomes especially important when pancreatic enzyme production is impaired.
4. Other tissues
Smaller amounts of lipase are produced in:
The liver
The intestine
Adipose tissue
Certain immune cells
These lipases have specialized metabolic roles and generally do not contribute substantially to the blood lipase measured during routine clinical testing.
Because the pancreas produces the majority of circulating digestive lipase, abnormalities detected during a lipase blood test usually reflect pancreatic injury rather than disease affecting other organs.
Why Lipase Is an Important Pancreatic Enzyme
Among all digestive enzymes produced by the pancreas, lipase has particular clinical importance because it performs two critical functions simultaneously: it supports normal digestion and serves as one of the most reliable biochemical markers of pancreatic injury.
The pancreas secretes several digestive enzymes, including:
Lipase for fat digestion.
Amylase for carbohydrate digestion.
Proteases (such as trypsin and chymotrypsin) for protein digestion.
Although each enzyme contributes to digestion, lipase has become especially valuable in clinical medicine because of its greater sensitivity and specificity for many pancreatic disorders. In patients with suspected acute pancreatitis, clinicians often order amylase and lipase together. However, serum lipase typically remains elevated longer than serum amylase, making it more useful in patients who present several days after symptom onset.
Consider the following example:
A 48-year-old patient arrives at the emergency department with sudden, severe upper abdominal pain radiating to the back, accompanied by nausea and vomiting. Physical examination raises suspicion for acute pancreatitis. A blood test reveals blood lipase levels that are more than 3 times normal, while imaging demonstrates pancreatic inflammation. Together with the patient’s symptoms, these findings strongly support the diagnosis of acute pancreatitis.
Conversely, another patient with longstanding alcohol-related chronic pancreatitis may have persistent digestive symptoms but only mildly elevated or even low lipase levels because extensive pancreatic damage has reduced the organ’s ability to make lipase. This example illustrates why laboratory findings must always be interpreted alongside clinical presentation rather than in isolation.
The importance of lipase extends beyond diagnosing pancreatitis. Abnormal lipase values may also be observed in patients with:
Pancreatic duct obstruction.
Pancreatic cancer.
Gallstone-related pancreatic disease.
Severe bowel ischemia.
Perforated peptic ulcers.
Certain diseases affecting the small intestine or intestine.
Kidney dysfunction that reduces lipase clearance.
These conditions demonstrate that while abnormal lipase levels often point toward a problem with your pancreas, they are not exclusively caused by pancreatic disease. A comprehensive evaluation—including the patient’s symptoms, medical history, physical examination, additional laboratory findings, and imaging—is always necessary to determine the underlying cause.
Ultimately, lipase represents far more than a digestive enzyme. It is a cornerstone of gastrointestinal physiology, an essential contributor to nutrient absorption, and one of the most valuable biochemical markers used to evaluate pancreatic health. A solid understanding of lipase provides the foundation for interpreting the Lipase Normal Range, recognizing abnormal lipase test results, and appreciating the clinical significance of changes in serum lipase across a wide range of pancreatic and non-pancreatic disorders.
Understanding the Lipase Blood Test
The lipase blood test is a commonly performed laboratory test used to measure the amount of lipase circulating in the bloodstream. Because lipase is an enzyme produced primarily by the pancreas, changes in its concentration can provide valuable information about pancreatic health and function. Under normal circumstances, only a small quantity of lipase in the blood is present because the enzyme is secreted into the digestive tract rather than the circulation. However, when pancreatic cells become inflamed, injured, or obstructed, lipase leaks into the bloodstream, resulting in elevated blood lipase levels that can be detected through laboratory analysis.
The lipase test has become one of the most important diagnostic investigations for evaluating patients with suspected pancreatic disorders, particularly acute pancreatitis. Compared with several other pancreatic biomarkers, serum lipase generally rises within a few hours after pancreatic injury, reaches peak concentrations within approximately 24 hours, and may remain elevated for 8–14 days. This prolonged elevation makes the test particularly useful in patients who do not seek medical attention immediately after symptom onset.
Although the test primarily evaluates pancreatic injury, abnormal lipase test results should never be interpreted in isolation. An elevated lipase level does not automatically confirm a pancreatic disorder, nor does a normal result completely exclude disease. Instead, healthcare providers integrate the patient’s symptoms, physical examination findings, medical history, additional laboratory investigations, and imaging studies to determine the underlying cause of abnormal values.
Several characteristics make the lipase blood test an important clinical investigation:
It is minimally invasive, requiring only a routine blood draw.
It can detect pancreatic injury early in the disease process.
It assists in the diagnosis of acute pancreatitis and other pancreatic conditions.
It helps distinguish pancreatic causes of abdominal pain from other gastrointestinal disorders.
It provides objective laboratory data that complement clinical assessment and diagnostic imaging.
For example, a patient presenting to the emergency department with severe upper abdominal pain, persistent vomiting, and tenderness over the epigastric region may undergo a lipase blood test soon after arrival. If the serum lipase levels are markedly elevated and imaging confirms pancreatic inflammation, the findings strongly support a diagnosis of acute pancreatitis. Conversely, if lipase remains within the normal range, clinicians may investigate other causes of abdominal pain such as peptic ulcer disease, gallbladder disease, bowel obstruction, or cardiac conditions.
Understanding both the strengths and limitations of the lipase test is therefore essential for accurate clinical decision-making.
Purpose of the Lipase Test
The primary purpose of the lipase test is to evaluate pancreatic function and assist healthcare professionals in identifying diseases that affect the pancreas. Because pancreatic injury causes leakage of digestive enzymes into the bloodstream, measuring the level of lipase provides important diagnostic information that cannot be obtained through symptoms alone.
In clinical practice, the lipase test measures the concentration of pancreatic lipase circulating in a patient’s blood. The results help clinicians determine whether pancreatic inflammation, obstruction, or tissue damage is likely to be present.
The test is used for several important clinical purposes, including:
Diagnosing acute pancreatitis The most common indication for ordering a lipase blood test is suspected acute pancreatitis. International clinical guidelines recommend measuring serum lipase because it has greater diagnostic sensitivity and remains elevated longer than serum amylase in many patients.
Evaluating persistent abdominal pain Patients presenting with unexplained upper abdominal pain, nausea, vomiting, fever, or pain radiating to the back often undergo lipase testing to determine whether pancreatic inflammation is responsible for their symptoms.
Assessing chronic pancreatic disease Although chronic pancreatitis may not always produce markedly elevated enzyme levels, lipase testing can contribute to the overall assessment when interpreted alongside imaging studies and the patient’s clinical history.
Investigating suspected pancreatic obstruction or pancreatic cancer Conditions such as pancreatic duct obstruction and pancreatic cancer may alter pancreatic enzyme release, making lipase one component of a broader diagnostic evaluation.
Monitoring selected clinical situations While serial lipase measurements are generally not used to monitor recovery from pancreatitis, repeat testing may occasionally be appropriate when complications are suspected or when the clinical picture changes significantly.
Importantly, the lipase test is not a screening examination for healthy individuals. Instead, it is ordered when there is a clinical suspicion of pancreatic disease based on symptoms, examination findings, or other laboratory abnormalities.
How the Lipase Blood Test Is Performed
One of the advantages of the lipase blood test is that it is relatively simple, safe, and quick to perform. The procedure requires only a venous blood sample, which is analyzed in a clinical laboratory using standardized biochemical methods.
The testing process generally follows these steps:
Clinical assessment Before ordering the test, the healthcare provider evaluates the patient’s symptoms, medical history, medication use, and physical examination findings. This assessment helps determine whether lipase testing is appropriate.
Patient preparation In many healthcare settings, fasting is not routinely required for a lipase test. However, individual laboratories or healthcare providers may recommend temporary fasting depending on other blood tests ordered at the same time. Patients should also inform the healthcare team about prescription medications, over-the-counter drugs, herbal supplements, and alcohol use because these factors may influence test results.
Blood collection A trained healthcare professional performs a routine blood draw, usually from a vein in the antecubital fossa of the arm. After cleaning the skin with an antiseptic solution, a sterile needle is inserted into the vein, and the required blood sample is collected into a laboratory tube.
Laboratory analysis The specimen is transported to the laboratory, where automated analyzers determine the concentration of serum lipase. Results are typically reported in units per liter (U/L), although the exact reference range varies among laboratories.
Interpretation of results Once available, the laboratory findings are interpreted together with the patient’s symptoms, physical examination, imaging studies, and other laboratory investigations such as the amylase test, liver function tests, complete blood count, and inflammatory markers.
The procedure itself usually takes only a few minutes. Aside from minor discomfort during the blood draw, complications are uncommon. Occasionally, patients may experience mild bruising, temporary soreness, or slight bleeding at the puncture site, all of which generally resolve without treatment.
When a Lipase Test Is Recommended
Healthcare providers order a lipase test when there is concern that a patient may have a disorder affecting the pancreas or another condition capable of altering blood lipase concentrations. The decision to perform the test is based on the patient’s symptoms, clinical findings, and overall presentation rather than on laboratory testing alone.
Common situations in which a lipase blood test is recommended include:
Patients with symptoms suggestive of acute pancreatitis
One of the strongest indications for testing is the presence of classic symptoms of acute pancreatitis, including:
Sudden severe upper abdominal pain.
Pain radiating to the back.
Persistent nausea and vomiting.
Abdominal tenderness.
Fever.
Rapid heart rate.
When these symptoms occur, measuring serum lipase levels helps support or exclude the diagnosis of acute pancreatitis.
Suspected chronic pancreatic disorders
Patients with recurrent abdominal pain, unexplained weight loss, oily stools (steatorrhea), or malabsorption may undergo lipase testing as part of an evaluation for chronic pancreatitis or other pancreatic disease.
Evaluation of pancreatic masses
Individuals undergoing assessment for pancreatic cancer or pancreatic duct obstruction may have lipase measured alongside imaging studies and additional laboratory tests.
Investigation of unexplained gastrointestinal symptoms
A clinician may request a lipase test in patients presenting with:
Persistent abdominal pain.
Severe nausea or vomiting.
Suspected gallstone disease.
Possible bowel ischemia.
Diseases involving the small intestine or intestine.
Although these conditions are not always pancreatic in origin, they may influence lipase concentrations and require careful interpretation.
Assessment following abdominal trauma or procedures
Pancreatic injury following blunt abdominal trauma, endoscopic procedures, or abdominal surgery may also prompt measurement of blood lipase levels.
It is important to remember that ordering a lipase test does not necessarily mean that pancreatic disease is present. Rather, the test forms one component of a comprehensive diagnostic evaluation designed to identify or exclude pancreatic involvement.
Factors That May Affect Lipase Test Results
Although the lipase blood test is highly valuable, numerous physiological, pathological, and technical factors can influence lipase test results. Understanding these variables helps prevent misinterpretation and reinforces the importance of correlating laboratory findings with the patient’s overall clinical picture.
Several factors may affect measured lipase concentrations:
1. Timing of the blood sample
Lipase does not increase immediately after pancreatic injury. Concentrations usually begin rising within 4–8 hours, peak around 24 hours, and gradually decline over the following one to two weeks. Testing either too early or long after symptom onset may produce results that do not accurately reflect disease severity.
2. Kidney dysfunction
Because the kidneys help remove lipase from the circulation, impaired renal function may result in elevated lipase levels even when significant pancreatic disease is absent.
3. Medications
Certain medications have been associated with increased serum lipase levels, including:
Opioids.
Corticosteroids.
Valproic acid.
Azathioprine.
Thiazide diuretics.
Some glucagon-like peptide-1 (GLP-1) receptor agonists.
Medication history should therefore be reviewed carefully before interpreting abnormal findings.
4. Alcohol use
Excessive alcohol consumption is a well-recognized cause of pancreatic injury and may contribute to elevated lipase values, particularly in patients with alcohol-induced pancreatitis.
5. Non-pancreatic diseases
Abnormal lipase test results may also occur in conditions unrelated to primary pancreatic disease, including:
Kidney disease.
Gallbladder disease.
Severe infections.
Bowel obstruction or ischemia.
Perforated peptic ulcers.
Diseases affecting the intestine.
These conditions illustrate why elevated lipase should not automatically be interpreted as pancreatitis.
6. Laboratory variation
Different laboratories may use different analytical methods, instruments, and calibration systems. Consequently, the normal range and upper limit of normal may vary slightly between healthcare institutions. For this reason, clinicians should always interpret results using the laboratory-specificreference range provided with the report.
7. Clinical context
Perhaps the most important factor affecting interpretation is the patient’s overall clinical presentation. Laboratory values must always be considered alongside:
Medical history.
Physical examination findings.
Symptoms.
Imaging studies.
Other laboratory investigations, including serum amylase and the amylase test.
For example, a patient with severe epigastric pain and a lipase level greater than 3 times normal is much more likely to have acute pancreatitis than an asymptomatic patient with only a mild elevation discovered incidentally during routine testing. Similarly, mildly higher than normal lipase concentrations in a patient with advanced kidney disease may reflect reduced clearance rather than active pancreatic injury.
Understanding these influencing factors ensures that the lipase blood test is used appropriately—as one important piece of diagnostic evidence rather than a standalone determinant of pancreatic disease.
Lipase Normal Range and How to Interpret Test Results
Interpreting the Lipase Normal Range is one of the most important aspects of evaluating pancreatic function and diagnosing disorders that affect the digestive system. While obtaining a lipase blood test is relatively straightforward, understanding what the test results mean requires much more than simply determining whether the reported value falls within or outside the laboratory’s reference range. Healthcare professionals must consider the patient’s symptoms, medical history, physical examination findings, additional laboratory investigations, and imaging studies before reaching a clinical diagnosis.
The Lipase Normal Range represents the concentration of lipase expected in the blood of healthy individuals. Since lipase is an enzyme that normally functions within the digestive tract rather than the bloodstream, only small quantities circulate in the blood under physiological conditions. When pancreatic cells are injured, inflamed, or obstructed, more lipase enters the circulation, causing measurable increases in blood lipase levels.
However, interpreting abnormal values is not always straightforward. Elevated lipase does not always indicate pancreatic disease, and a normal result does not necessarily exclude every pancreatic disorder. Numerous clinical factors—including the timing of the blood test, kidney function, medications, laboratory methodology, and underlying medical conditions—can influence the measured level of lipase.
A systematic interpretation of lipase test results generally involves answering several key questions:
Does the lipase level fall within the laboratory’s normal range?
If abnormal, how far above or below the upper limit of normal is the result?
Does the patient have symptoms consistent with pancreatic disease?
Are there additional laboratory findings, such as abnormalities in serum amylase, liver enzymes, or inflammatory markers?
Do imaging studies support the laboratory findings?
Could another medical condition explain the abnormal result?
Answering these questions allows clinicians to interpret the Lipase Normal Range within the appropriate clinical context rather than relying solely on numerical laboratory values.
Normal Lipase Levels and the Reference Range
The Lipase Normal Range refers to the interval of normal lipase concentrations established by individual laboratories using healthy populations. This interval serves as a benchmark against which patient test results are compared.
Most laboratories report serum lipase levels in units per liter (U/L). Although exact values vary, many clinical laboratories use a reference range that falls approximately between:
0–160 U/L
10–140 U/L
13–60 U/L
These examples illustrate that there is no single universally accepted normal range for lipase. Instead, each laboratory establishes its own reference range based on:
The analytical equipment used.
Laboratory testing methods.
Population characteristics.
Calibration standards.
Quality control procedures.
For this reason, healthcare professionals should always interpret results using the laboratory-specific reference interval printed on the patient’s report rather than comparing values with ranges published elsewhere.
Under normal physiological conditions:
The pancreas continuously produces pancreatic lipase.
Most of the enzyme is secreted directly into the small intestine to assist with digestion.
Only a small amount of lipase enters the bloodstream.
Consequently, blood lipase remains within the expected normal serum concentration.
For example:
Lipase Result
Laboratory Reference Range
Interpretation
42 U/L
13–60 U/L
Normal
55 U/L
10–140 U/L
Normal
95 U/L
0–160 U/L
Normal
Although these values differ numerically, each falls within its respective laboratory’s normal results because different laboratories establish different reference intervals.
It is also important to understand that normal serum lipase does not necessarily guarantee a completely healthy pancreas. Some patients with longstanding chronic pancreatitis, advanced pancreatic fibrosis, or certain forms of pancreatic insufficiency may have normal or even low lipase levels because damaged pancreatic tissue loses its ability to make lipase effectively. Therefore, clinicians always interpret laboratory findings alongside the patient’s symptoms and overall clinical picture.
Why Lipase Reference Ranges Vary Between Laboratories
A common source of confusion for both patients and healthcare professionals is that the Lipase Normal Range is not identical across all hospitals and diagnostic laboratories. A result considered normal in one facility may appear slightly abnormal in another simply because different laboratories establish different reference ranges.
Several factors contribute to these variations.
1. Differences in laboratory equipment
Modern laboratories use automated biochemical analyzers manufactured by different companies. Each analyzer may employ unique testing technologies, reagents, and calibration methods, resulting in slight differences in measured serum lipase concentrations.
2. Differences in analytical methods
Various enzymatic assays are available for measuring lipase activity. Because these methods do not measure enzyme activity in exactly the same way, reported values may differ despite testing identical blood samples.
3. Population-specific reference intervals
Laboratories establish their reference range by testing healthy individuals representative of the local population. Factors such as age distribution, ethnicity, geographic location, and population health characteristics may influence the final reference interval.
4. Quality assurance and calibration standards
Each accredited laboratory follows rigorous quality control procedures to ensure accurate reporting. Nevertheless, differences in calibration materials and validation studies contribute to modest variation in normal serum values.
5. Units of measurement
Although most laboratories report results in units per liter (U/L), international reporting practices and laboratory information systems may occasionally present results using different formats or reference intervals.
Because of these differences, clinicians should avoid comparing lipase values obtained from different laboratories without considering the accompanying reference intervals.
For example:
Laboratory A reports a normal range of 10–140 U/L.
Laboratory B reports 13–60 U/L.
A patient with a lipase level of 75 U/L would be:
Normal according to Laboratory A.
Mildly elevated according to Laboratory B.
This example demonstrates why laboratory-specific interpretation is essential. Rather than focusing on the absolute number alone, clinicians compare the patient’s result with the laboratory’s published upper limit of normal and interpret it within the broader clinical context.
Understanding Normal, High, and Low Lipase Results
Once the laboratory has established whether the patient’s lipase level falls within the reference range, clinicians determine whether the result is normal, elevated, or decreased and assess its clinical significance.
Normal lipase results
A result within the Lipase Normal Range generally indicates that pancreatic injury is unlikely at the time of testing. Normal findings suggest that pancreatic cells are not releasing excessive amounts of lipase into the bloodstream.
However, normal results should never be interpreted in isolation because:
Testing performed too early after symptom onset may not yet show lipase increases.
Patients with advanced chronic pancreatitis may have normal enzyme concentrations due to loss of pancreatic tissue.
Certain pancreatic disorders may not significantly affect circulating lipase.
Therefore, persistent symptoms may still require additional diagnostic evaluation despite a normal laboratory value.
High lipase results
High lipase levels occur when pancreatic cells release excessive amounts of enzyme into the bloodstream or when other medical conditions reduce lipase clearance.
The degree of elevation of lipase often provides valuable diagnostic information.
Mild elevation
Slightly elevated values may occur in:
Gallbladder disease.
Kidney disease.
Peptic ulcer disease.
Certain medications.
Diseases involving the bowel or intestine.
Moderate elevation
Moderately elevated lipase levels may suggest:
Early pancreatic inflammation.
Pancreatic duct obstruction.
Acute gastrointestinal disorders.
Marked elevation
Patients with acute pancreatitis often demonstrate blood lipase levels exceeding 3 times normal or 3 times the normal laboratory value. According to international clinical guidelines, the diagnosis of acute pancreatitis can be established when at least two of the following are present:
Characteristic upper abdominal pain.
Serum lipase levels or amylase levels at least 3 times normal.
Imaging findings consistent with pancreatic inflammation.
It is important to recognize that the magnitude of enzyme elevation does not necessarily indicate disease severity. A patient with extremely higher than normal lipase may recover quickly, while another with only modest enzyme elevation may experience severe complications.
Low lipase results
Although less common, low lipase levels can also provide important clinical information.
Persistently reduced enzyme concentrations may occur in patients with:
Advanced chronic pancreatitis.
Extensive pancreatic destruction.
Chronic pancreatic insufficiency.
Certain inherited pancreatic disorders.
These patients may produce insufficient pancreatic enzyme to support normal digestion, leading to fat malabsorption, steatorrhea, weight loss, and nutritional deficiencies.
For example, a patient with longstanding alcohol-related chronic pancreatitis may experience recurrent abdominal pain, oily stools, and unintended weight loss. Despite significant pancreatic damage, laboratory testing may reveal low lipase levels because the pancreas has lost much of its capacity to produce digestive enzymes.
Why laboratory values should never be interpreted alone
One of the most important principles in clinical medicine is that laboratory values support—but do not replace—clinical judgment.
For example:
Scenario 1
A patient presents with sudden severe epigastric pain radiating to the back, vomiting, and a lipase level that is 3 times normal. Combined with the patient’s symptoms and imaging findings, these results strongly support acute pancreatitis.
Scenario 2
Another patient has mildly elevated lipase levels discovered during routine blood work but reports no abdominal symptoms. Further evaluation identifies chronic kidney disease as the underlying cause rather than pancreatic inflammation.
These examples illustrate why the Lipase Normal Range should always be interpreted alongside:
The patient’s symptoms.
Medical history.
Physical examination.
Additional laboratory findings, including amylase and lipase when appropriate.
Diagnostic imaging.
Overall clinical assessment.
Ultimately, the Lipase Normal Range serves as a valuable reference point rather than a definitive diagnosis. Understanding what constitutes normal, elevated, and decreased lipase concentrations—and recognizing the clinical circumstances in which these values occur—allows healthcare professionals to make informed diagnostic decisions while avoiding unnecessary investigations or misinterpretation of laboratory findings.
Causes of Abnormal Lipase Levels
An abnormal lipase level is often the first indication that further clinical evaluation is necessary. However, it is important to recognize that abnormal lipase test results do not represent a diagnosis on their own. Instead, they signal that an underlying physiological or pathological process may be affecting the pancreas, another organ, or the body’s ability to produce or clear lipase from the bloodstream.
When interpreting the Lipase Normal Range, healthcare providers must understand that lipase concentrations are influenced by numerous factors. While pancreatic disorders remain the most common cause of abnormal results, diseases involving the kidneys, gallbladder, liver, gastrointestinal tract, and even certain medications can alter blood lipase levels. Likewise, the timing of the blood test, laboratory methodology, and the patient’s overall health status all contribute to accurate interpretation.
Abnormal lipase values generally fall into two broad categories:
High lipase levels, which usually indicate leakage of pancreatic enzymes into the bloodstream or impaired clearance.
Low lipase levels, which often reflect reduced pancreatic enzyme production due to chronic pancreatic damage or insufficiency.
The degree of abnormality also matters. For example, a patient whose lipase is only slightly above the laboratory’s upper limit of normal requires a different clinical approach than someone whose serum lipase levels are 3 times normal or higher and who presents with severe abdominal pain. Consequently, clinicians evaluate not only whether the result is abnormal but also its magnitude, associated symptoms, and supporting diagnostic findings.
Causes of High Lipase Levels
High lipase levels occur when excess lipase in the blood is released from damaged pancreatic tissue or when the body’s ability to remove the enzyme from circulation is impaired. Although elevated values are strongly associated with pancreatic disease, they are not exclusive to disorders of the pancreas.
The most common causes of elevated lipase levels include the following.
1. Acute pancreatitis
The most frequent and clinically significant cause of elevated lipase is acute pancreatitis, an inflammatory condition characterized by sudden injury to pancreatic tissue.
During an episode of acute pancreatitis:
Digestive enzymes become activated within the pancreas instead of the small intestine.
The resulting inflammation damages pancreatic cells.
Large amounts of pancreatic lipase leak into the bloodstream.
Serum lipase levels rise rapidly, often within 4–8 hours.
Concentrations frequently exceed 3 times the normal laboratory value.
Current international guidelines recommend that the diagnosis of acute pancreatitis can be established when at least two of the following are present:
Characteristic upper abdominal pain.
Serum lipase or amylase concentrations at least 3 times normal.
For example, a patient who develops severe epigastric pain after heavy alcohol consumption may have blood lipase levels of 900 U/L in a laboratory where the upper limit of normal is 300 U/L. Because the enzyme concentration is more than 3 times normal, and the patient has classic symptoms, the findings strongly support acute pancreatitis.
It is important to remember, however, that the magnitude of lipase elevation does not necessarily predict disease severity. Some patients with markedly elevated values recover quickly, while others with modest elevations develop serious complications.
2. Chronic pancreatitis
Unlike acute pancreatitis, chronic pancreatitis involves progressive inflammation, fibrosis, and permanent structural damage to the pancreas.
During the early stages, recurrent inflammatory episodes may produce intermittent elevated lipase levels. As the disease progresses and pancreatic tissue is gradually destroyed, enzyme production declines, and lipase concentrations may become normal or even low.
This explains why lipase testing is generally more useful for diagnosing acute pancreatic injury than advanced chronic disease.
3. Pancreatic duct obstruction
Any condition that blocks normal pancreatic drainage can increase intraductal pressure, leading to leakage of digestive enzymes into the bloodstream.
Common causes include:
Gallstones.
Pancreatic duct strictures.
Benign pancreatic cysts.
Postsurgical narrowing of the pancreatic duct.
These patients may develop elevated levels of lipase even without widespread pancreatic inflammation.
4. Pancreatic cancer
Although the lipase blood test is not used to diagnose pancreatic cancer, malignant tumors may obstruct pancreatic ducts or damage surrounding tissue, causing abnormal enzyme release.
Patients with pancreatic cancer often require a combination of:
Imaging studies.
Tumor markers.
Tissue biopsy.
Laboratory investigations, including lipase and liver function tests.
Because pancreatic cancer produces nonspecific symptoms during its early stages, lipase should never be interpreted as a stand-alone screening tool.
5. Gallbladder disease
Gallstones are one of the leading causes of acute pancreatitis.
A stone lodged within the common bile duct may temporarily obstruct the pancreatic duct, allowing digestive enzymes to accumulate inside the pancreas and leak into the bloodstream. In these patients, elevated lipase often reflects secondary pancreatic inflammation rather than primary pancreatic disease.
6. Kidney disease
The kidneys play an important role in removing circulating lipase from the bloodstream.
Patients with reduced kidney function may demonstrate increased blood lipase concentrations because the enzyme is cleared more slowly, even when the pancreas is functioning normally.
This highlights why renal function should always be reviewed before attributing abnormal lipase values solely to pancreatic disease.
7. Gastrointestinal disorders
Several gastrointestinal diseases may produce elevated lipase levels, including:
Bowel obstruction.
Bowel ischemia.
Perforated peptic ulcers.
Inflammatory diseases involving the small intestine.
Severe diseases affecting the intestine.
Inflammation and tissue injury in these conditions may indirectly stimulate pancreatic enzyme release or interfere with enzyme metabolism.
8. Medications and medical procedures
Certain medications have been associated with lipase elevation, including:
Corticosteroids.
Valproic acid.
Azathioprine.
Thiazide diuretics.
Some GLP-1 receptor agonists.
Similarly, endoscopic retrograde cholangiopancreatography (ERCP), abdominal surgery, or pancreatic trauma may temporarily increase lipase concentrations.
Causes of Low Lipase Levels
Although clinicians often focus on elevated enzyme concentrations, low lipase levels can also provide valuable information regarding pancreatic function. Reduced lipase usually indicates diminished enzyme production rather than excessive enzyme leakage.
Unlike acute pancreatic injury, which causes lipase release into the bloodstream, conditions associated with low lipase often reflect long-standing destruction of the cells responsible for producing digestive enzymes.
The most important causes include the following.
1. Advanced chronic pancreatitis
The most common cause of persistently low lipase levels is advanced chronic pancreatitis.
Repeated episodes of inflammation gradually replace healthy pancreatic tissue with scar tissue, reducing the pancreas’s ability to make lipase and other digestive enzymes.
As pancreatic insufficiency develops, patients may experience:
Chronic abdominal discomfort.
Fat malabsorption.
Oily stools (steatorrhea).
Weight loss.
Deficiencies of fat-soluble vitamins.
Malnutrition.
Ironically, despite severe pancreatic damage, the lipase level may be low because the pancreas has lost its capacity to produce adequate enzyme.
2. Chronic pancreatic insufficiency
Exocrine pancreatic insufficiency results from inadequate production of digestive enzymes.
Common causes include:
Chronic pancreatitis.
Extensive pancreatic surgery.
Severe pancreatic trauma.
Certain inherited pancreatic disorders.
Patients frequently require pancreatic enzyme replacement therapy to restore normal digestion.
3. Extensive pancreatic destruction
Severe destruction of pancreatic tissue from longstanding disease, recurrent inflammation, or surgical removal significantly reduces production of pancreatic enzyme secretions.
Consequently, the amount of lipase released into both the digestive tract and bloodstream decreases.
4. Certain inherited disorders
Although relatively uncommon, some genetic disorders affecting pancreatic development or function may impair enzyme production from an early age.
Examples include conditions associated with exocrine pancreatic dysfunction, where reduced digestive enzyme production contributes to chronic malabsorption and nutritional deficiencies.
Lipase Blood Test
Non-Pancreatic Conditions That Can Affect Lipase Levels
One of the most important principles when interpreting the Lipase Normal Range is recognizing that abnormal lipase values are not always caused by pancreatic disease.
Numerous non-pancreatic conditions may alter serum lipase levels, either by increasing enzyme release from other tissues or by reducing clearance from the circulation. Failure to consider these alternative diagnoses may lead to unnecessary investigations or inappropriate treatment.
Common non-pancreatic causes include:
Kidney disease
Reduced renal clearance allows lipase to remain in circulation longer than normal, producing elevated laboratory values despite the absence of pancreatic inflammation.
Gallbladder disease
Gallstones and biliary obstruction may secondarily affect pancreatic drainage, resulting in increased lipase in the blood.
Gastrointestinal disorders
Diseases involving the digestive tract may influence blood lipase levels, including:
Bowel obstruction.
Mesenteric ischemia.
Perforated peptic ulcer.
Severe gastroenteritis.
Inflammatory bowel disease.
Disorders affecting the small intestine or intestine.
Liver disease
Although less common, severe liver dysfunction may alter enzyme metabolism and contribute to abnormal laboratory findings.
Diabetes mellitus and metabolic disorders
Some patients with diabetic ketoacidosis or severe metabolic illness demonstrate elevated lipase despite the absence of true pancreatitis.
Severe systemic illness
Critical illness, sepsis, major trauma, and shock may produce nonspecific enzyme elevation because of widespread tissue injury and altered organ function.
Certain medications
Drug-induced lipase elevation remains an important diagnostic consideration, particularly when laboratory abnormalities develop shortly after initiation of a new medication.
Why clinical correlation is essential
Because abnormal lipase test results occur in numerous pancreatic and non-pancreatic conditions, clinicians should never interpret the laboratory value alone.
Consider the following examples:
Example 1
A patient presents with sudden severe upper abdominal pain, vomiting, and serum lipase levels greater than 3 times normal. Computed tomography confirms pancreatic inflammation. Together, these findings support acute pancreatitis.
Example 2
A patient with chronic kidney disease has mildly higher than normal lipase concentrations during routine laboratory testing but reports no abdominal pain or gastrointestinal symptoms. Imaging demonstrates a normal pancreas. In this case, impaired renal clearance rather than pancreatic injury explains the abnormal result.
Example 3
Another patient with advanced chronic pancreatitis experiences weight loss, steatorrhea, and malnutrition but has low lipase levels because extensive pancreatic fibrosis has markedly reduced enzyme production.
These examples emphasize that interpreting the Lipase Normal Range requires integration of multiple clinical factors, including:
The patient’s symptoms.
Medical history.
Physical examination.
Laboratory findings.
Imaging studies.
Underlying medical conditions.
Only by evaluating all available evidence can healthcare professionals accurately determine whether abnormal lipase values reflect pancreatic disease or an alternative clinical condition requiring a different diagnostic and therapeutic approach.
Using Lipase to Diagnose Pancreatic Disorders
The lipase blood test is one of the most valuable diagnostic tools for evaluating diseases that affect the pancreas, particularly inflammatory conditions such as acute pancreatitis and chronic pancreatitis. Because lipase is an enzyme produced primarily by pancreatic acinar cells, damage to these cells causes the enzyme to leak into the bloodstream, making changes in blood lipase levels an important indicator of pancreatic injury.
However, the role of lipase extends beyond simply identifying whether enzyme levels are elevated. In clinical practice, the lipase test helps healthcare providers determine the likelihood of pancreatic disease, assess the need for additional diagnostic investigations, and distinguish pancreatic disorders from other causes of abdominal pain. Although lipase is highly useful, it is only one component of a comprehensive diagnostic evaluation. A definitive diagnosis depends on correlating laboratory findings with the patient’s symptoms, medical history, physical examination, and imaging studies.
The process of diagnosing pancreatic disorders typically involves several steps:
Assessment of symptoms
Sudden or persistent upper abdominal pain.
Pain radiating to the back.
Nausea and vomiting.
Fever.
Abdominal tenderness.
Reduced appetite.
Clinical history
Alcohol consumption.
Previous episodes of pancreatitis.
Gallstone disease.
Family history of pancreatic disorders.
Medication use.
Recent abdominal trauma or procedures.
Laboratory investigations
Lipase blood test.
Amylase test.
Liver function tests.
Complete blood count.
C-reactive protein.
Electrolytes and kidney function tests.
Diagnostic imaging
Abdominal ultrasound.
Computed tomography (CT).
Magnetic resonance imaging (MRI).
Endoscopic ultrasound (EUS) when appropriate.
Only after integrating all these findings can clinicians accurately diagnose pancreatic disorders and determine the most appropriate treatment strategy.
Acute Pancreatitis
Among all pancreatic diseases, acute pancreatitis is the condition in which the lipase test has the greatest diagnostic value. Acute pancreatitis is characterized by sudden inflammation of the pancreas resulting from premature activation of digestive enzymes within pancreatic tissue. Instead of remaining inactive until they reach the digestive tract, these enzymes become activated inside the pancreas, leading to autodigestion, inflammation, edema, and varying degrees of tissue injury.
The most common causes of acute pancreatitis include:
Gallstones.
Excessive alcohol consumption.
Hypertriglyceridemia.
Certain medications.
Pancreatic trauma.
Endoscopic procedures such as ERCP.
Less commonly, infections, autoimmune diseases, and genetic disorders.
As pancreatic cells become damaged, large quantities of pancreatic lipase enter the bloodstream, causing rapid increases in serum lipase levels. Lipase typically begins to rise within 4 to 8 hours after symptom onset, peaks at approximately 24 hours, and may remain elevated for up to two weeks. This prolonged elevation provides a wider diagnostic window than many other pancreatic enzymes.
Current international guidelines state that the diagnosis of acute pancreatitis can usually be established when two of the following three criteria are present:
Characteristic upper abdominal pain consistent with pancreatic inflammation.
Serum lipase (or amylase) levels at least 3 times the normal or 3 times normal relative to the laboratory’s upper limit of normal.
Characteristic findings on diagnostic imaging.
This means that a patient does not necessarily require all three criteria. For example:
Clinical Example
A 52-year-old patient presents to the emergency department with sudden severe epigastric pain radiating to the back after consuming a large amount of alcohol. The patient reports persistent vomiting and significant abdominal tenderness.
Laboratory findings include:
Blood lipase levels: 1,050 U/L
Laboratory reference range: 10–140 U/L
Mildly elevated liver enzymes
Because the patient’s lipase level is more than 3 times normal and the clinical presentation is highly suggestive of pancreatitis, the diagnosis can often be made even before imaging is performed.
Although markedly elevated lipase values strongly support pancreatic inflammation, clinicians should remember that the degree of enzyme elevation does not reliably predict disease severity. Some individuals with extremely high enzyme levels recover rapidly, whereas others with only moderate elevations develop pancreatic necrosis, organ failure, or systemic complications.
Chronic Pancreatitis
Unlike acute pancreatitis, chronic pancreatitis is a progressive disease characterized by irreversible inflammation, fibrosis, and gradual destruction of pancreatic tissue. Over time, repeated episodes of inflammation reduce both endocrine and exocrine pancreatic function, impairing the production of insulin and digestive enzymes.
Because pancreatic tissue is progressively replaced by scar tissue, lipase behaves differently in chronic disease than in acute inflammation.
During the early stages of chronic pancreatitis:
Recurrent inflammatory episodes may produce intermittent elevated lipase levels.
Patients often experience recurrent abdominal pain.
Enzyme concentrations may fluctuate depending on disease activity.
As the disease advances:
The pancreas loses its ability to make lipase.
Digestive enzyme production declines.
Low lipase levels or even normal serum lipase concentrations may occur despite significant pancreatic damage.
Consequently, the lipase blood test is less sensitive for diagnosing chronic pancreatitis than acute pancreatitis.
Patients with chronic pancreatitis commonly present with:
Recurrent upper abdominal pain.
Chronic pain radiating to the back.
Weight loss.
Steatorrhea (fatty stools).
Malnutrition.
Diabetes mellitus due to endocrine dysfunction.
Because laboratory findings alone may appear relatively normal, diagnosis usually relies on multiple sources of information, including:
Clinical symptoms.
Detailed medical history.
Pancreatic function tests.
CT or MRI imaging.
Endoscopic ultrasound.
Assessment of exocrine pancreatic insufficiency.
Clinical Example
A patient with a 15-year history of heavy alcohol consumption reports chronic abdominal pain, oily stools, and unintended weight loss. The lipase test results show only a slight elevation, yet CT imaging demonstrates pancreatic calcifications and fibrosis. In this situation, imaging findings and clinical history are far more valuable than the enzyme level alone in establishing the diagnosis of chronic pancreatitis.
This example illustrates an important clinical principle: normal or mildly abnormal lipase levels do not exclude chronic pancreatic disease.
Why Lipase Is Used Alongside Amylase and Imaging
Although the lipase test is highly informative, it should never be interpreted as a stand-alone diagnostic investigation. Healthcare providers routinely combine amylase and lipase measurements with imaging studies because each diagnostic tool provides different information about pancreatic structure and function.
Lipase and amylase
Both lipase and amylase are digestive enzymes produced by the pancreas.
Their primary functions differ:
Lipase breaks down dietary fats.
Amylase digests carbohydrates.
Because pancreatic injury often releases both enzymes into the bloodstream, clinicians frequently request an amylase test together with the lipase blood test.
However, important differences exist between the two enzymes.
Lipase
Amylase
More specific for pancreatic injury
Less specific because it is also produced by the salivary glands
Remains elevated longer
Returns to normal more quickly
Preferred laboratory marker for suspected acute pancreatitis
Useful as a complementary test
Better sensitivity in patients presenting several days after symptom onset
More likely to normalize within 3–5 days
For this reason, many clinical guidelines recommend prioritizing serum lipase while using serum amylase as a complementary investigation rather than relying on amylase alone.
The role of imaging
Laboratory findings reveal biochemical evidence of pancreatic injury, but imaging demonstrates the actual structural changes occurring within the pancreas.
Common imaging modalities include:
Abdominal ultrasound
Often performed first to identify gallstones, biliary obstruction, or pancreatic enlargement.
Computed tomography (CT)
Provides detailed assessment of pancreatic inflammation, necrosis, fluid collections, pseudocysts, and disease severity.
Magnetic resonance imaging (MRI)
Offers excellent visualization of pancreatic ducts and surrounding soft tissues without ionizing radiation.
Endoscopic ultrasound (EUS)
Particularly valuable for evaluating early chronic pancreatitis, pancreatic tumors, and small structural abnormalities not visible on routine imaging.
By combining laboratory findings with imaging studies, clinicians obtain a much more accurate understanding of both pancreatic function and pancreatic anatomy.
Limitations of the Lipase Test
Despite its considerable diagnostic value, the lipase blood test has important limitations. Understanding these limitations helps prevent overdiagnosis, unnecessary investigations, and inappropriate treatment.
1. Elevated lipase is not specific for pancreatic disease
Although elevated lipase frequently suggests pancreatic injury, abnormal results may also occur in patients with:
Kidney disease.
Gallbladder disease.
Severe infections.
Bowel obstruction.
Mesenteric ischemia.
Peptic ulcer perforation.
Diseases involving the small intestine.
Certain medications.
Therefore, abnormal enzyme levels do not automatically indicate a pancreatic disorder.
2. Normal lipase does not completely exclude pancreatic disease
A result within the Lipase Normal Range should not be interpreted as definitive proof that the pancreas is healthy.
Examples include:
Very early testing before lipase increases occur.
Advanced chronic pancreatitis, where enzyme production has declined.
Certain cases of pancreatic insufficiency.
Delayed testing after enzyme levels have already returned toward baseline.
3. The degree of elevation does not reflect disease severity
One of the most common misconceptions is that higher enzyme levels indicate more severe pancreatitis.
In reality:
A patient with serum lipase levels 10 times above the upper limit of normal may recover rapidly.
Another patient with only moderate enzyme elevation may develop pancreatic necrosis, infection, or multiple organ failure.
Consequently, clinicians assess disease severity using validated clinical scoring systems, imaging findings, and the patient’s physiological status rather than enzyme concentration alone.
4. Timing influences test accuracy
The timing of the blood test significantly affects interpretation.
Testing too early may produce false reassurance because enzyme release has not yet peaked.
Testing several weeks after symptom onset may reveal normal results despite previous pancreatic injury.
Knowledge of symptom onset is therefore essential when interpreting laboratory findings.
5. Additional investigations remain necessary
The lipase test is used to support diagnosis—not replace comprehensive clinical evaluation.
Accurate diagnosis requires integration of:
Clinical presentation.
Medical history.
Physical examination.
Laboratory investigations.
Imaging studies.
Ongoing patient assessment.
For example, a patient presenting with abdominal pain and mildly elevated lipase may ultimately be diagnosed with gallbladder disease rather than pancreatitis after ultrasound examination. Conversely, another patient with persistent symptoms but only minimally abnormal enzyme levels may undergo CT imaging that confirms chronic pancreatitis.
These examples demonstrate why the lipase blood test should always be viewed as one component of a broader diagnostic process. When interpreted alongside amylase, imaging studies, and the patient’s overall clinical presentation, it provides highly valuable information that supports early recognition of pancreatic disorders, guides further investigation, and contributes to timely, evidence-based patient management.
Factors Affecting Lipase Blood Test Results
Nursing Considerations for Lipase Testing
Nurses play a critical role throughout the entire process of lipase testing, from preparing the patient for specimen collection to interpreting laboratory findings within the broader clinical picture and providing appropriate patient education. Although the lipase blood test itself is a relatively simple blood test, nursing responsibilities extend far beyond obtaining a blood sample. Nurses are often the first healthcare professionals to assess patients with symptoms suggestive of pancreatic disease, recognize abnormal lipase test results, communicate significant findings to the healthcare team, and educate patients about the purpose of the test and the next steps in their care.
Because abnormalities in blood lipase levels may indicate acute pancreatitis, chronic pancreatitis, or other pancreatic disorders, nurses must understand both the physiological basis of the test and its clinical significance. Equally important is recognizing that the lipase test should never be interpreted in isolation. Laboratory findings must always be correlated with the patient’s symptoms, medical history, physical examination, imaging studies, and other diagnostic investigations.
From a nursing perspective, care surrounding the lipase blood test can be divided into three key stages:
Preparing the patient and collecting an accurate blood sample.
Interpreting and communicating laboratory findings within the clinical context.
Educating the patient and coordinating appropriate follow-up care.
A systematic approach to these responsibilities contributes to accurate diagnosis, timely treatment, patient safety, and improved clinical outcomes.
Patient Preparation and Blood Sample Collection
Proper patient preparation is the first step in obtaining reliable lipase test results. Although the procedure itself is straightforward, inadequate preparation or errors during specimen collection can affect laboratory accuracy and patient experience.
Pre-test nursing assessment
Before obtaining the blood sample, nurses should perform a focused assessment that includes:
Current symptoms, particularly upper abdominal pain, nausea, vomiting, fever, or pain radiating to the back.
Previous history of acute or chronic pancreatic disease.
Alcohol consumption history.
Gallbladder disease or previous gallstones.
Recent abdominal trauma or surgery.
Current medications, including prescription drugs, over-the-counter medications, and herbal supplements.
Previous episodes of pancreatitis or pancreatic surgery.
Family history of pancreatic disorders when appropriate.
Gathering this information provides important clinical context for interpreting the patient’s lipase level.
Patient preparation
In many healthcare facilities, fasting is not routinely required before a lipase blood test. However, fasting instructions may vary depending on institutional protocols or whether additional laboratory investigations are ordered simultaneously.
Before specimen collection, nurses should:
Verify the healthcare provider’s order.
Confirm patient identity using approved identification methods.
Explain the purpose of the blood test to reduce anxiety.
Answer any questions regarding the procedure.
Assess for bleeding disorders or anticoagulant therapy.
Confirm whether fasting is required according to institutional policy.
Providing a clear explanation improves patient cooperation and reduces procedural anxiety.
For example, a nurse may explain:
“This test measures the amount of lipase, a digestive enzyme produced mainly by your pancreas. The results help your healthcare provider determine whether your pancreas may be inflamed or whether additional testing is needed.”
Obtaining a high-quality blood sample is essential for accurate laboratory analysis.
Standard nursing responsibilities during the blood draw include:
Performing hand hygiene and following infection prevention protocols.
Applying the tourniquet appropriately.
Selecting a suitable vein, usually within the antecubital fossa.
Cleansing the puncture site with an approved antiseptic.
Collecting the specimen using proper venipuncture technique.
Filling the collection tube according to laboratory requirements.
Releasing the tourniquet promptly.
Applying pressure after needle removal to minimize bruising.
Labeling the specimen immediately at the bedside.
Transporting the specimen to the laboratory according to institutional procedures.
Proper specimen identification is particularly important because labeling errors may result in delayed diagnosis or inappropriate clinical decisions.
Monitoring after specimen collection
Following the procedure, nurses should observe for common minor complications, including:
Mild bleeding.
Bruising.
Local discomfort.
Dizziness or vasovagal reactions.
Although complications are uncommon, prompt assessment and intervention help ensure patient safety.
Nursing Interpretation of Lipase Test Results
One of the nurse’s most important responsibilities is understanding the clinical significance of lipase test results while recognizing that interpretation extends beyond the numerical laboratory value.
The first step is determining whether the patient’s lipase level falls within the laboratory’s reference range or exceeds the upper limit of normal. However, interpretation should never rely solely on whether results are classified as normal or abnormal.
Instead, nurses should evaluate laboratory findings alongside:
The patient’s presenting symptoms.
Vital signs.
Physical examination findings.
Medical history.
Additional laboratory investigations.
Diagnostic imaging.
Overall clinical condition.
Recognizing normal results
A result within the Lipase Normal Range generally suggests that significant pancreatic injury is less likely.
However, nurses should remember that:
A normal result does not completely exclude pancreatic disease.
Patients with advanced chronic pancreatitis may have normal or low lipase levels because damaged pancreatic tissue produces less enzyme.
Testing performed very early after symptom onset may not yet demonstrate lipase increases.
Consequently, persistent symptoms always require continued clinical assessment, even when laboratory findings appear normal.
Recognizing elevated lipase levels
Elevated lipase levels are most commonly associated with pancreatic inflammation, particularly acute pancreatitis.
Nurses should recognize that enzyme elevations become more clinically significant when accompanied by symptoms such as:
Severe upper abdominal pain.
Pain radiating to the back.
Persistent nausea and vomiting.
Fever.
Abdominal tenderness.
Tachycardia.
Patients with serum lipase levels at least 3 times normal, together with characteristic symptoms, require prompt medical evaluation because these findings strongly support the diagnosis of acute pancreatitis.
It is equally important to remember that mildly higher than normal values may occur in:
Kidney disease.
Gallbladder disease.
Gastrointestinal disorders.
Certain medications.
Other non-pancreatic conditions.
For this reason, nurses should avoid assuming that every elevated result represents pancreatitis.
Recognizing low lipase levels
Although less frequently encountered, low lipase levels may indicate:
Advanced chronic pancreatitis.
Exocrine pancreatic insufficiency.
Extensive pancreatic damage.
Reduced production of digestive enzymes.
Patients with reduced pancreatic enzyme production often present with additional findings such as:
Steatorrhea.
Weight loss.
Malnutrition.
Deficiencies of fat-soluble vitamins.
Chronic abdominal discomfort.
Recognizing these associated clinical features helps nurses contribute to comprehensive patient assessment.
Communicating abnormal findings
Abnormal laboratory values should be communicated promptly according to institutional policy.
Nurses should immediately notify the healthcare provider when abnormal lipase test results are accompanied by:
Severe abdominal pain.
Persistent vomiting.
Signs of dehydration.
Hypotension.
Tachycardia.
Fever.
Altered mental status.
Clinical deterioration.
Prompt communication facilitates early intervention and may reduce the risk of complications associated with pancreatic inflammation.
Patient Education and Follow-Up Care
Patient education is a fundamental component of nursing care following a lipase blood test. Regardless of whether results are normal or abnormal, patients benefit from understanding the purpose of the test, the meaning of their results, and the importance of ongoing evaluation when necessary.
Explaining test results
Patients frequently assume that an abnormal laboratory value automatically indicates a serious illness.
Nurses should explain that:
The lipase test is one part of a comprehensive diagnostic evaluation.
Abnormal values do not always indicate pancreatic disease.
Additional investigations may be necessary before a diagnosis can be confirmed.
Results are interpreted together with symptoms, imaging studies, and other laboratory findings.
Providing balanced, evidence-based information helps reduce unnecessary anxiety while encouraging patient engagement.
Teaching patients about warning signs
Patients should understand when medical attention is required.
Education should include recognition of symptoms such as:
Severe upper abdominal pain.
Persistent vomiting.
Fever.
Jaundice.
Inability to tolerate oral fluids.
Increasing abdominal distension.
New or worsening pain radiating to the back.
Patients experiencing these symptoms should seek immediate medical evaluation because they may indicate acute pancreatitis or another serious abdominal condition.
Lifestyle education
For patients diagnosed with pancreatic disease, nurses play an important role in reinforcing lifestyle measures that support pancreatic health.
Depending on the underlying condition, education may include:
Avoiding alcohol consumption.
Smoking cessation.
Following dietary recommendations provided by the healthcare team.
Maintaining adequate hydration.
Taking prescribed pancreatic enzyme replacement therapy when indicated.
Managing chronic conditions such as diabetes or hypertriglyceridemia.
Attending scheduled follow-up appointments.
These interventions help reduce recurrent pancreatic injury and improve long-term outcomes.
Coordinating follow-up care
Patients with abnormal lipase test results often require additional evaluation.
Possible follow-up investigations include:
Repeat blood tests when clinically indicated.
Liver function tests.
Kidney function tests.
Amylase test or serum amylase measurement.
Abdominal ultrasound.
Computed tomography (CT).
Magnetic resonance imaging (MRI).
Referral to a gastroenterologist.
Nurses contribute by coordinating appointments, reinforcing discharge instructions, and ensuring patients understand the importance of completing recommended investigations.
Supporting patients throughout the diagnostic process
Patients awaiting a diagnosis of a pancreatic disorder often experience uncertainty and anxiety. Nurses can provide reassurance by encouraging questions, addressing misconceptions, and emphasizing that the lipase blood test is only one component of the overall assessment.
For example, a patient with mildly elevated blood lipase levels but no symptoms may require only additional laboratory testing and outpatient follow-up. In contrast, another patient with severe abdominal pain, vomiting, and serum lipase levels greater than 3 times the normal value may require urgent hospitalization, intravenous fluids, pain management, and close monitoring for complications.
These contrasting scenarios illustrate why effective nursing care extends beyond obtaining a laboratory specimen. By integrating careful assessment, accurate specimen collection, evidence-based interpretation, patient education, and coordinated follow-up, nurses play an essential role in ensuring that lipase test findings are used effectively to support timely diagnosis, appropriate treatment, and high-quality patient-centered care.
Behind on multiple nursing assignments?
Our team will handle them while you focus on learning and clinical work.
Understanding the Lipase Normal Range is essential for accurately evaluating pancreatic health and interpreting the results of a lipase blood test. While lipase is primarily recognized as a digestive enzyme responsible for breaking down dietary fats, its clinical significance extends far beyond digestion. Changes in the lipase level can provide important clues about pancreatic inflammation, injury, and dysfunction, making the lipase test one of the most valuable laboratory investigations in patients with suspected pancreatic disease.
As discussed throughout this guide, interpreting lipase test results involves much more than determining whether a value falls within the normal range. Healthcare professionals must consider the patient’s symptoms, medical history, physical examination findings, other laboratory tests, and imaging studies before reaching a diagnosis. Elevated lipase levels may strongly suggest acute pancreatitis, particularly when they are at least three times the laboratory’s upper limit of normal and accompanied by characteristic clinical features. Conversely, low lipase levels may indicate chronic pancreatic damage or reduced enzyme production, highlighting the importance of evaluating results within the broader clinical context.
It is equally important to recognize that abnormal blood lipase levels are not always caused by pancreatic disorders. Kidney disease, gallbladder disease, gastrointestinal conditions, certain medications, and other systemic illnesses can also influence lipase concentrations. Likewise, a normal lipase result does not completely exclude pancreatic disease, especially in patients with advanced chronic pancreatitis or those tested very early or late in the course of illness. These limitations reinforce why the lipase blood test should always be interpreted alongside clinical assessment and, when appropriate, additional investigations such as the amylase test and diagnostic imaging.
For nurses and other healthcare professionals, understanding the role of lipase testing supports more accurate patient assessment, timely recognition of serious conditions, effective patient education, and improved interdisciplinary communication. Knowledge of specimen collection, interpretation of laboratory findings, and appropriate follow-up care contributes to safer clinical practice and better patient outcomes.
Ultimately, the Lipase Normal Range serves as an important diagnostic reference rather than a definitive diagnosis. By understanding how lipase functions, what influences its concentration in the blood, and how results are interpreted in real-world clinical settings, healthcare professionals can make informed decisions that support early diagnosis, appropriate treatment, and comprehensive care for patients with suspected pancreatic disorders.
Frequently Asked Questions
How to read lipase test results?
To read lipase test results, compare your lipase level with the laboratory’s reference range, which is usually reported in units per liter (U/L). A result within the normal range generally suggests normal pancreatic enzyme activity. Mildly elevated levels may occur in conditions other than pancreatic disease, while levels that are 3 times the upper limit of normal or higher, especially when accompanied by severe abdominal pain, strongly suggest acute pancreatitis. Results should always be interpreted alongside your symptoms, medical history, physical examination, and imaging studies.
Is low or high lipase worse?
Neither is inherently “worse” because each may indicate a different medical condition. High lipase levels are more commonly associated with acute pancreatitis, pancreatic injury, gallstones, or certain non-pancreatic illnesses and may require urgent medical evaluation. Low lipase levels are less common but can indicate advanced chronic pancreatitis, pancreatic insufficiency, or reduced pancreatic enzyme production. The significance of either result depends on the underlying cause and the patient’s overall clinical condition.
What organ does lipase affect?
Lipase primarily reflects the health of the pancreas, the organ responsible for producing most of the body’s digestive lipase. The enzyme is released into the small intestine, where it helps digest dietary fats. Although abnormal lipase levels are most often associated with pancreatic disorders, diseases affecting the kidneys, gallbladder, or gastrointestinal tract can also influence blood lipase levels.
What level of lipase is concerning?
A lipase level becomes particularly concerning when it is 3 times the upper limit of the laboratory’s normal range, especially if it is accompanied by symptoms such as severe upper abdominal pain, nausea, vomiting, or pain radiating to the back. These findings strongly suggest acute pancreatitis and require prompt medical evaluation. Mild elevations may result from less serious conditions or non-pancreatic diseases, while persistently low lipase levels may warrant further investigation for chronic pancreatic dysfunction.
Leopold Maneuver: A Step-by-Step Obstetric Maneuver for Fetal Assessment and Fetal Health Evaluation
Assessment of the fetus is one of the most important components of prenatal and obstetric care. Throughout pregnancy, healthcare professionals must gather accurate information about fetal growth, fetal position, fetal presentation, and fetal well-being to support safe maternal and neonatal outcomes. While modern imaging technologies have significantly enhanced prenatal assessment, physical examination remains a fundamental aspect of clinical practice. Among the most widely recognized and frequently utilized bedside assessment techniques is the Leopold Maneuver, a structured method of abdominal palpation used to evaluate the fetus through examination of the pregnant abdomen.
The Leopold Maneuver is a systematic assessment technique that involves carefully palpating specific areas of the maternal abdomen to determine how the fetus is positioned within the uterus. By using the hands to identify different fetal structures, healthcare providers can obtain valuable information about:
Fetal lie
Fetal presentation
Fetal position
Fetal engagement
The location of the fetal back
The presenting part nearest the birth canal
These findings provide important insight into fetal orientation and help clinicians anticipate potential labor and delivery considerations.
The significance of the Leopold Maneuver extends beyond simply identifying the location of the fetus. Accurate assessment of fetal positioning can influence clinical decision-making throughout the later stages of pregnancy. For example, identifying a cephalic presentation near term generally suggests favorable conditions for vaginal birth, whereas detecting a breech or transverse lie may indicate the need for additional monitoring, further diagnostic evaluation, or alternative delivery planning. Consequently, the information obtained through the maneuver contributes directly to ongoing fetal health evaluation and obstetric management.
One of the defining characteristics of the Leopold Maneuver is that it relies on clinical skill rather than technology. Through systematic palpation of the uterus and surrounding abdominal structures, healthcare providers learn to distinguish between different fetal parts, including the fetal head, buttocks, back, and extremities. The ability to accurately identify these structures requires knowledge of maternal-fetal anatomy, an understanding of pregnancy physiology, and proficiency in physical assessment techniques. As a result, the maneuver remains an important component of obstetric education and clinical competency.
The technique is most commonly performed during the third trimester of pregnancy, particularly when fetal structures become easier to palpate through the abdominal wall. During this period, assessment findings can help answer several important clinical questions:
Is the fetus positioned longitudinally, transversely, or obliquely within the uterus?
Which fetal part is presenting at the pelvic inlet?
Has the presenting part descended into the maternal pelvis?
Where is the fetal back located?
Are there findings that may affect labor progression or delivery planning?
Answers to these questions provide valuable information for prenatal assessments, labor preparation, and ongoing obstetric surveillance.
Although ultrasound examination has become a standard diagnostic tool in modern maternity care, the Leopold Maneuver continues to offer significant clinical value. It provides an immediate, noninvasive, cost-effective, and readily accessible method of assessment that can be performed in a variety of healthcare settings. In many cases, findings obtained through abdominal palpation complement ultrasound results and contribute to a more comprehensive understanding of fetal status. Furthermore, proficiency in physical assessment techniques remains essential because clinical judgment often begins with direct patient examination before diagnostic tests are ordered or interpreted.
The enduring relevance of the Leopold Maneuver is reflected in its continued use by obstetricians, midwives, nurses, and other maternal healthcare professionals worldwide. More than a century after its development, the technique remains a cornerstone of obstetric assessment because it provides a practical framework for evaluating fetal orientation, monitoring pregnancy progression, and supporting evidence-based clinical decision-making.
This article provides a comprehensive examination of the Leopold Maneuver, including its historical origins, underlying principles, clinical applications, step-by-step performance, interpretation of findings, limitations, and practical considerations for clinical practice. Understanding the purpose and proper use of this assessment technique is essential for developing a thorough approach to fetal evaluation and promoting safe, effective maternal care throughout pregnancy.
Understanding the Leopold Maneuver
The Leopold Maneuver is one of the most important hands-on assessment techniques used in obstetric practice to evaluate the position and orientation of the fetus within the pregnant uterus. It consists of a series of systematic palpation techniques performed on the maternal abdomen to gather information about fetal lie, fetal presentation, fetal position, and fetal engagement. Although technological advancements such as ultrasound have transformed prenatal care, the Leopold Maneuver remains a valuable clinical skill because it allows healthcare providers to perform an immediate bedside assessment without specialized equipment.
The technique is based on the principle that different parts of the fetus have distinct physical characteristics that can be identified through careful abdominal examination. By systematically palpating the abdomen with both hands, clinicians can distinguish the fetal head, fetal back, buttocks, and smaller fetal parts. These observations provide essential information about how the fetus is positioned within the uterus and whether the pregnancy is progressing normally.
The Leopold Maneuver is particularly useful during the third trimester of pregnancy, when fetal structures become more prominent and easier to palpate through the abdominal wall. During this stage, assessment findings help healthcare providers prepare for labor, anticipate potential delivery complications, and evaluate overall fetal health.
Definition and Purpose of the Leopold Maneuver
The Leopold Maneuver is a method of abdominal palpation used to assess the fetus by systematically palpating the gravid uterus through four distinct examination steps. Collectively known as Leopold’s maneuvers, these four steps enable the examiner to determine the relationship between the fetus and the maternal pelvis.
At its core, the Leopold Maneuver is designed to answer several important clinical questions:
What is the fetal lie?
Which fetal part occupies the fundus?
What is the presenting part?
Where is the location of the fetal back?
Has the presenting part descended into the pelvis?
Is the fetus in a cephalic, breech, or transverse position?
The technique involves carefully applying gentle but deep pressure to different regions of the maternal abdomen. Through systematic examination, the health care provider palpates various fetal structures and interprets their location relative to the uterus and maternal pelvis.
The primary purposes of the Leopold Maneuver include:
1. Assessment of Fetal Position
One of the most important objectives is the assessment of fetal position. Determining how the fetus is situated within the uterus helps clinicians understand whether labor is likely to progress normally.
For example:
A fetus with its occiput facing anteriorly is generally considered to be in a favorable position for vaginal delivery.
A fetus whose occiput faces posteriorly may be associated with prolonged labor or increased maternal discomfort.
Accurate assessment of fetal position enables healthcare providers to anticipate potential challenges before labor begins.
2. Identification of Fetal Lie
The maneuver helps determine the fetal lie, which refers to the relationship between the long axis of the fetus and the long axis of the mother.
Common fetal lies include:
Longitudinal lie
Transverse lie
Oblique lie
A longitudinal lie is generally considered normal for term pregnancy, whereas a transverse lie may complicate vaginal delivery and require additional evaluation.
3. Determination of Fetal Presentation
Another important purpose is identifying the presenting part, or the portion of the fetus closest to the birth canal.
Common presentations include:
Cephalic presentation
Breech presentation
Shoulder presentation
Identifying the presenting part is critical because presentation significantly influences labor management and delivery planning.
4. Evaluation of Fetal Engagement
The Leopold Maneuver also helps determine whether the presenting part has descended into the maternal pelvis.
When the fetal head is engaged:
Labor may be approaching.
Vaginal delivery may be more likely.
The presenting part becomes less mobile within the pelvis.
Conversely, a high presenting part may indicate delayed engagement or abnormal positioning.
5. Contribution to Fetal Health Evaluation
Although the Leopold Maneuver is not a diagnostic test for fetal disorders, it contributes to overall fetal health assessment by identifying abnormal positions that may place the fetus at risk during labor and delivery.
For example, detection of a breech or transverse presentation late in pregnancy may prompt:
Additional fetal monitoring
Ultrasound examination
Consultation with an obstetrician
Consideration of alternative delivery approaches
Thus, findings obtained during the maneuver often guide further clinical assessment and management.
Feeling stressed about writing a detailed nursing paper?
The Leopold Maneuver owes its name to Christian Gerhard Leopold, a renowned German obstetrician and gynecologist whose contributions significantly influenced modern obstetric assessment.
Born in the nineteenth century, Christian Gerhard Leopold dedicated much of his professional career to improving the evaluation and management of pregnancy. At a time when sophisticated diagnostic imaging did not exist, clinicians relied heavily on physical examination skills to assess the fetus and monitor pregnancy progression.
Recognizing the need for a systematic and reproducible assessment method, the gynecologist Christian Gerhard Leopold developed a structured approach for examining the pregnant abdomen. His technique involved carefully palpating specific regions of the uterus in a predictable sequence to identify fetal orientation and presentation.
The innovation introduced by this German obstetrician and gynecologist Christian Gerhard Leopold offered several advantages:
Standardized fetal assessment
Improved communication among clinicians
Greater accuracy in determining fetal lie and presentation
Enhanced ability to anticipate labor complications
Over time, Leopold’s maneuvers became widely adopted throughout Europe and eventually spread worldwide. As obstetric education evolved, the technique became a fundamental component of clinical training for physicians, nurses, and midwives.
Even after the introduction of ultrasound technology, Leopold’s maneuvers continued to hold clinical significance. Numerous studies have demonstrated that skilled examiners can accurately identify fetal presentation and estimate fetal position through careful abdominal palpation, particularly during late pregnancy.
Today, the technique remains an important example of how meticulous physical examination can provide meaningful clinical information without reliance on advanced technology.
Importance of the Maneuver in Obstetric Care
The continued use of the Leopold Maneuver in contemporary healthcare reflects its practical value in obstetric assessment. Despite advances in diagnostic imaging, bedside physical examination remains an essential component of prenatal care, labor assessment, and maternal-fetal monitoring.
Several factors contribute to the enduring importance of the maneuver.
Provides Immediate Clinical Information
The Leopold Maneuver allows a health care provider to obtain valuable information during a routine examination.
Within minutes, the examiner can assess:
Fetal lie
Fetal presentation
Fetal position
Fetal engagement
Location of the fetal back
This information can influence clinical decisions without requiring immediate imaging studies.
Supports Labor and Delivery Planning
Findings from the maneuver help clinicians anticipate labor progression and delivery needs.
For instance:
A cephalic presentation generally supports plans for vaginal delivery.
A breech presentation may require additional evaluation.
A transverse lie often necessitates further obstetric assessment because vaginal delivery may not be feasible.
Early identification of these findings enables timely intervention and appropriate care planning.
Enhances Clinical Assessment Skills
The Leopold Maneuver reinforces the importance of direct patient assessment and clinical reasoning.
Healthcare professionals develop the ability to:
Recognize anatomical landmarks
Differentiate fetal structures
Correlate physical findings with pregnancy progression
Integrate assessment findings into clinical decision-making
These skills remain valuable even in technologically advanced healthcare settings.
Complements Ultrasound Assessment
Although ultrasound may provide highly detailed information, physical examination and imaging should be viewed as complementary rather than competing approaches.
A clinician may first suspect:
Breech presentation
Abnormal fetal lie
Delayed engagement
through abdominal palpation and then use ultrasound to confirm findings.
This combination strengthens diagnostic accuracy and promotes comprehensive patient evaluation.
Promotes Accessible and Cost-Effective Care
One of the most significant advantages of the Leopold Maneuver is its accessibility.
The technique:
Requires no specialized equipment.
Can be performed in outpatient clinics, hospitals, and community settings.
Is especially useful in resource-limited environments.
Provides valuable assessment data at minimal cost.
As a result, the maneuver remains relevant across diverse healthcare systems worldwide.
Ultimately, the Leopold Maneuver continues to serve as a cornerstone of obstetric assessment because it provides a structured, evidence-based approach to evaluating fetal orientation, fetal position, and fetal well-being. Its enduring value lies in its ability to transform careful observation and skilled palpation into meaningful clinical information that supports safe and effective maternal care.
Key Concepts Assessed Through the Leopold Maneuver
The primary purpose of the Leopold Maneuver is to obtain critical information about how the fetus is situated within the uterus. While the technique involves a series of physical examination steps, its true value lies in the clinical information that those steps reveal. Through systematic abdominal palpation used to assess the fetus, healthcare professionals can determine several key obstetric characteristics that influence pregnancy management, labor progression, and delivery planning.
Four of the most important concepts assessed through the Leopold Maneuver are:
Fetal lie
Fetal presentation
Fetal position
Fetal engagement
Together, these findings provide a comprehensive picture of fetal orientation within the maternal uterus and help clinicians evaluate whether labor is likely to progress normally or whether additional assessment may be required.
Understanding these concepts is essential because the information obtained through Leopold’s maneuvers directly influences obstetric decision-making and contributes to ongoing fetal health evaluation.
Fetal Lie
Fetal lie refers to the relationship between the long axis of the fetus and the long axis of the mother’s uterus. In simple terms, it describes how the fetus is oriented within the uterine cavity.
Determining fetal lie is one of the first objectives of the Leopold Maneuver because it provides a general understanding of how the fetus occupies the uterus.
The three primary types of fetal lie are:
Longitudinal Lie
In a longitudinal lie, the fetus is aligned vertically within the uterus, with the head or buttocks positioned toward the maternal pelvis.
Characteristics include:
Fetal spine runs parallel to the mother’s spine.
Most common lie during late pregnancy.
Usually associated with either cephalic or breech presentation.
Considered favorable for vaginal birth when accompanied by cephalic presentation.
A longitudinal lie is present in the vast majority of pregnancies at term.
Transverse Lie
A transverse lie occurs when the fetus lies horizontally across the uterus.
Characteristics include:
Fetal spine is perpendicular to the maternal spine.
Neither the fetal head nor buttocks occupies the pelvic inlet.
The shoulder often becomes the presenting structure.
Vaginal delivery is generally not possible without correction.
During examination, a health care provider may detect a transverse lie when the fetal head is palpated on one side of the abdomen while the buttocks are felt on the opposite side.
For example, if the examiner identifies the fetal head on the mother’s right side and the buttock on the left side, a transverse lie may be suspected.
Oblique Lie
An oblique lie represents an intermediate position between longitudinal and transverse orientations.
Characteristics include:
Fetus lies diagonally within the uterus.
Often unstable and may change position.
May progress to either longitudinal or transverse lie.
Because oblique lie can interfere with normal labor progression, careful monitoring is often necessary.
Clinical Significance of Fetal Lie
Assessment of fetal lie is crucial because it helps determine:
Whether vaginal delivery is feasible.
The likelihood of labor complications.
Whether additional imaging studies are needed.
Appropriate obstetric management strategies.
When an abnormal fetal lie is identified during the third trimester, ultrasound may be used to confirm findings and guide further care.
Fetal Presentation
Fetal presentation refers to the part of the fetus that occupies the lower portion of the uterus and is expected to enter the birth canal first during labor.
The presenting part is one of the most important findings obtained through the Leopold Maneuver because it directly influences delivery outcomes.
Through systematic palpation, the examiner attempts to determine what fetal part is lying above the inlet of the maternal pelvis.
The most common types of presentation include:
Cephalic Presentation
Cephalic presentation occurs when the fetal head occupies the lower uterus and approaches the pelvic inlet.
Characteristics include:
Head presents first during labor.
Most favorable presentation for vaginal birth.
Present in approximately 95% of term pregnancies.
Usually associated with lower obstetric risk.
During examination, the fetal head is hard, round, and moves independently from the trunk.
Because the fetal head is hard and well-defined, it can often be distinguished from softer fetal structures.
Breech Presentation
A breech presentation occurs when the buttocks or lower extremities occupy the lower uterine segment.
Characteristics include:
Buttock or feet present first.
Increased risk of delivery complications.
May require additional monitoring or intervention.
During palpation, the examiner may detect a softer, broader structure in the lower abdomen while the fetal head is identified near the fundus.
Shoulder Presentation
Shoulder presentation is commonly associated with a transverse lie.
Characteristics include:
Shoulder approaches the birth canal first.
Vaginal delivery is usually not possible.
Requires further obstetric evaluation.
Clinical Significance of Fetal Presentation
Assessment of fetal presentation allows clinicians to:
Anticipate labor progression.
Evaluate delivery options.
Identify high-risk pregnancies.
Plan appropriate interventions when necessary.
Presentation findings are particularly important during the final weeks of gestation when delivery planning becomes increasingly important.
Fetal Position
While fetal lie describes overall orientation and fetal presentation identifies the presenting part, fetal position refers to the relationship of a specific fetal landmark to the maternal pelvis.
The landmark most commonly used in cephalic presentation is the occiput, which is the back of the fetal head.
Determining fetal position requires identifying the fetal back, which is often achieved during the second Leopold Maneuver.
Common fetal positions include:
Occiput Anterior (OA)
In this position:
The occiput faces the front of the maternal pelvis.
The fetal back is directed toward the mother’s abdomen.
Labor progression is generally favorable.
Occiput anterior is considered the optimal fetal position for vaginal delivery.
Occiput Posterior (OP)
Characteristics include:
Occiput directed toward the mother’s back.
Labor may be longer or more painful.
Increased likelihood of operative delivery.
During examination, the fetal back may be difficult to palpate because it lies deeper within the uterus.
Occiput Transverse (OT)
Characteristics include:
Occiput directed toward either side of the maternal pelvis.
Labor may require fetal rotation before delivery.
When the Leopold Maneuver is Performed
Determining Fetal Position Through the Leopold Maneuver
The location of the fetal back provides important clues regarding fetal position.
For example:
If the fetal back is palpated along the left side of the abdomen, the fetus may be positioned differently than if the back is located on the right side.
Small fetal parts are typically felt opposite the side as the back.
This information contributes significantly to assessment of fetal position and labor planning.
Clinical Importance of Fetal Position
Fetal position influences:
Labor duration
Maternal comfort
Descent through the birth canal
Need for obstetric interventions
For this reason, accurate identification of fetal position remains an essential component of obstetric assessment.
Fetal Engagement
Fetal engagement refers to the descent of the presenting part into the maternal pelvis. Engagement occurs when the widest diameter of the presenting part passes through the pelvic inlet and becomes fixed within the pelvis.
Assessment of engagement is commonly performed during the later stages of pregnancy and is particularly important near term.
The fourth Leopold Maneuver helps evaluate whether the presenting part is:
Freely movable
Partially descended
Fully engaged
Signs of Engagement
When engagement has occurred:
The presenting part is less mobile.
The fetal head descends deeper into the pelvis.
The examiner may have difficulty grasping the presenting structure.
Labor may be approaching.
Conversely, if the presenting part remains high and easily movable, engagement may not yet have occurred.
Clinical Example
Consider a patient at 39 weeks of gestation.
During examination:
The fetal head is identified in the lower uterus.
The presenting part cannot be easily moved upward.
Most of the head lies within the maternal pelvis.
These findings suggest fetal engagement and indicate that labor may occur soon.
Clinical Importance of Fetal Engagement
Assessment of engagement provides valuable information regarding:
Readiness for labor
Progress toward delivery
Relationship between the presenting part and the maternal pelvis
Potential labor complications
Evaluating engagement is therefore a critical component of prenatal assessment and labor preparation.
Together, fetal lie, fetal presentation, fetal position, and fetal engagement form the foundation of fetal assessment through the Leopold Maneuver. By carefully evaluating these four concepts, healthcare providers gain a detailed understanding of fetal orientation within the uterus, enabling informed clinical decision-making and supporting safe obstetric care throughout the later stages of pregnancy.
Timing and Preparation for Performing the Maneuvers
The accuracy and clinical usefulness of the Leopold Maneuver depend not only on the examiner’s skill but also on appropriate timing and preparation. Even when healthcare professionals are proficient in performing the maneuvers, inaccurate findings may occur if the examination is conducted too early in pregnancy, if the patient is improperly positioned, or if environmental factors interfere with effective palpation.
Because the Leopold Maneuver is a method of abdominal palpation used to evaluate fetal orientation within the uterus, optimal examination conditions are essential. The examiner must be able to clearly identify fetal structures through the abdominal wall while ensuring maternal comfort and safety. Proper preparation also helps reduce anxiety, encourages cooperation, and improves the reliability of examination findings.
Several factors influence the success of the assessment, including:
Gestational age
Maternal positioning
Bladder status
Abdominal muscle relaxation
Environmental conditions
Examiner experience
Understanding these factors is crucial because the information obtained during the examination may guide clinical decisions related to labor preparation, fetal monitoring, and obstetric management.
When the Leopold Maneuver Should Be Performed
The Leopold Maneuver can technically be performed at various stages of pregnancy; however, its accuracy increases significantly as pregnancy progresses and fetal structures become more distinguishable through the abdominal wall.
Performance During the Third Trimester
The technique is most commonly performed during the third trimester of pregnancy because fetal growth and uterine enlargement make it easier to identify major fetal structures.
During the third trimester:
The fetus occupies a larger portion of the uterus.
The fetal head, buttocks, and fetal back become easier to palpate.
Fetal lie and presentation are more stable.
Assessment findings are more clinically meaningful.
Although some fetal parts may be detectable earlier in pregnancy, accurate determination of fetal lie and presentation is generally more reliable during the later weeks of gestation.
For example, a fetus that appears to be in a breech position at 28 weeks may spontaneously rotate into a cephalic presentation before delivery. For this reason, findings obtained during late pregnancy are often more useful for delivery planning.
Gestational Age Considerations
Healthcare providers frequently perform the Leopold Maneuver after approximately 28 weeks of gestation, with increasing usefulness as term approaches.
The examination becomes particularly valuable during:
Routine prenatal visits during the third trimester
Assessment of suspected malpresentation
Labor admission evaluations
Pre-delivery assessments
Follow-up of previously identified abnormal fetal positions
Near term, the assessment can help determine whether the presenting part has entered the maternal pelvis and whether labor preparations should be adjusted accordingly.
Use During Labor
The Leopold Maneuver may also be performed during labor to assess:
Fetal orientation
Progress of descent
Changes in fetal position
Relationship of the presenting part to the maternal pelvis
For example, a woman admitted in early labor may undergo abdominal examination to determine whether the fetus remains in a favorable cephalic presentation or whether unexpected positional changes have occurred.
Situations Requiring Reassessment
Because fetal position can change throughout pregnancy, repeated assessment may be necessary in certain situations, including:
Suspected transverse lie.
Suspected breech presentation.
Inconsistent fetal heart tone location.
Concerns regarding labor progression.
Need for confirmation of fetal engagement.
In these circumstances, the findings obtained during the maneuver may help determine whether ultrasound may be needed for further evaluation.
Preparing the Patient and Environment
Appropriate preparation is essential for successful performing the maneuvers. Proper preparation improves patient comfort, facilitates relaxation of the abdominal muscles, and increases the examiner’s ability to accurately identify fetal structures.
Explaining the Procedure
Before beginning the examination, the healthcare provider should explain:
The purpose of the assessment.
What the examination involves.
What sensations the patient may experience.
The importance of remaining relaxed during the procedure.
Providing a clear explanation helps reduce anxiety and encourages patient cooperation.
For example, some patients may become concerned when firm pressure is applied to the abdomen. Informing them beforehand that gentle but deep pressure will be used can help minimize discomfort and improve relaxation.
Ensuring Privacy and Comfort
Maintaining a comfortable environment is an important aspect of obstetric care.
The examination area should provide:
Adequate privacy.
Appropriate lighting.
Comfortable room temperature.
Minimal distractions.
A calm environment allows the patient to relax and enables the examiner to focus on subtle examination findings.
Emptying the Bladder
One of the most important preparation steps is ensuring that the patient empties her bladder before the examination.
A full bladder can:
Cause discomfort.
Distort abdominal contours.
Interfere with palpation findings.
Affect assessment accuracy.
For this reason, patients are typically encouraged to void immediately before the examination begins.
Exposure of the Abdomen
The maternal abdomen should be adequately exposed while preserving patient dignity.
Typically:
Clothing is adjusted to expose the abdomen from the lower ribs to the pubic region.
Draping is used appropriately.
Unnecessary exposure is avoided.
Proper exposure allows the examiner to evaluate abdominal shape and perform systematic palpation without obstruction.
Examiner Preparation
The health care provider should also prepare appropriately before beginning the assessment.
Recommended steps include:
Washing hands.
Warming hands before contact.
Removing distracting jewelry when possible.
Positioning at an appropriate height relative to the patient.
Cold hands may cause abdominal muscle tightening, which can interfere with accurate palpation.
Factors That May Affect Examination Accuracy
Several maternal factors can make abdominal palpation more challenging:
Obesity
Polyhydramnios
Multiple gestation
Excessive abdominal muscle tension
Anterior placenta
Recognizing these factors helps clinicians interpret findings appropriately and determine when additional evaluation may be required.
Positioning the Mother for Accurate Assessment
Correct maternal positioning is one of the most important determinants of successful performing the maneuvers. Even an experienced examiner may struggle to accurately identify fetal structures if the patient is not positioned properly.
The goal of positioning is to:
Promote abdominal muscle relaxation.
Improve accessibility of the uterus.
Enhance patient comfort.
Facilitate accurate palpation.
Standard Examination Position
The most commonly recommended position involves placing the patient in a semi-recumbent or supine position.
In this position:
The patient lies on her back.
The head and shoulders are slightly elevated.
The knees may be slightly flexed.
Abdominal muscles remain relatively relaxed.
This position provides optimal access to the upper part of the uterus, lower abdomen, and side of the abdomen.
Slight Knee Flexion
Many clinicians encourage slight flexion of the hips and knees because it helps reduce tension in the abdominal wall.
Benefits include:
Improved relaxation.
Easier palpation of fetal structures.
Greater patient comfort.
Relaxed abdominal muscles make it easier to identify the fetal head, buttock, and fetal back during examination.
Avoiding Supine Hypotension
During late pregnancy, prolonged supine positioning may compress major blood vessels and reduce blood flow.
Signs of supine hypotension may include:
Dizziness
Nausea
Sweating
Lightheadedness
To reduce this risk, a small wedge or pillow may be placed under one hip to create a slight lateral tilt.
This simple adjustment often improves comfort while maintaining examination accuracy.
Examiner Positioning During the Assessment
The examiner’s position changes throughout the examination.
During different stages of the Leopold Maneuver, the health care provider may:
Stand beside the patient.
Face the maternal head.
Face the maternal feet.
These position changes allow systematic evaluation of different fetal structures and facilitate accurate interpretation of findings.
Importance of Maternal Relaxation
Perhaps the most important aspect of positioning is ensuring maternal relaxation.
Tense abdominal muscles can:
Obscure fetal structures.
Reduce palpation accuracy.
Increase patient discomfort.
Make interpretation more difficult.
Healthcare providers often encourage slow breathing and relaxation before beginning palpation.
For example, asking the patient to take several deep breaths before examination may significantly improve the examiner’s ability to identify the fetal back and presenting part.
Proper timing, thorough preparation, and correct maternal positioning create the foundation for accurate performing the maneuvers. When these elements are carefully addressed, the Leopold Maneuver becomes a highly effective method of abdominal palpation used to assess fetal lie, presentation, position, and engagement. These preparatory steps not only improve examination accuracy but also contribute to a safer, more comfortable, and more informative obstetric assessment.
Performing the Maneuvers: A Step-by-Step Guide
The Leopold Maneuver consists of four systematic examination steps designed to evaluate the relationship between the fetus and the maternal pelvis. Collectively referred to as Leopold’s maneuvers, these assessment techniques enable a healthcare professional to gather valuable information regarding fetal lie, fetal presentation, fetal position, and fetal engagement through careful abdominal examination.
The examination is performed by systematically palpating the gravid uterus using both hands in a specific sequence. Each step builds upon information obtained during the previous one, allowing the examiner to develop a comprehensive understanding of fetal orientation within the uterus.
When performing the maneuvers, healthcare providers should use firm but controlled palpation. Excessive force can cause discomfort and may lead to inaccurate findings, whereas insufficient pressure may make fetal structures difficult to identify. The goal is to apply gentle but deep pressure while carefully assessing the size, shape, consistency, and mobility of various fetal structures.
Before beginning the examination, the examiner should ensure that:
The patient is comfortable and relaxed.
The bladder has been emptied.
The abdomen is adequately exposed.
Proper positioning has been established.
The purpose of the procedure has been explained.
Once preparation is complete, the examiner proceeds through the four steps of the Leopold Maneuver.
First Leopold Maneuver: Assessing the Fundal Pole
The first maneuver focuses on identifying the fetal structure occupying the fundus, or upper part of the uterus. This step helps determine which fetal part is located at the top of the uterus and provides important clues regarding fetal lie and presentation.
Purpose of the First Maneuver
The objectives of the first maneuver include:
Identifying the fetal part occupying the fundal region.
Determining whether the fetal head or buttocks are located in the fundus.
Gathering preliminary information about fetal lie.
Establishing the orientation of the fetus within the uterus.
Because the fetal head and buttocks have different physical characteristics, this assessment often provides the first indication of whether the fetus is likely in a cephalic or breech presentation.
Technique
To perform the first maneuver:
The examiner stands facing the pregnant patient.
Both hands are placed on the top of the uterus.
The fingers of both hands gently encircle the fundal region.
The examiner carefully palpates the contents of the fundus.
During this assessment, the examiner evaluates:
Shape
Consistency
Mobility
Size of the structure being palpated
Interpreting Findings
The structure occupying the fundus may be:
Fetal Head
If the fetal head occupies the fundus:
It feels hard and round.
It is smooth and well-defined.
It can often move independently from the trunk.
A fetal head in the fundus often suggests a breech presentation.
Buttocks
If the buttock occupies the fundus:
It feels softer.
It is broader and less defined.
It lacks the firm, spherical characteristics of the head.
When the buttocks are identified in the fundal region, the fetus is often in a cephalic presentation.
Example
Consider a patient at 38 weeks of gestation.
During the first maneuver:
A soft, irregular mass is palpated within the fundus.
The structure lacks the firmness associated with the fetal head.
These findings suggest that the buttocks occupy the fundal region, indicating a likely cephalic presentation.
The first maneuver therefore establishes an important foundation for subsequent assessment steps.
Second Leopold Maneuver: Locating the Fetal Back
After identifying the fundal structure, the examiner proceeds to the second Leopold Maneuver, which focuses on identifying the location of the fetal back.
This step is one of the most important aspects of the examination because the fetal back serves as a key landmark for determining fetal position.
Purpose of the Second Maneuver
The objectives include:
Locating the fetal back.
Identifying small fetal parts.
Confirming fetal lie.
Assisting in assessment of fetal position.
Helping identify the optimal location for fetal heart tone auscultation.
Technique
To perform the second maneuver:
The examiner places both hands on the sides of the uterus.
The palms rest against the maternal abdomen.
Gentle but firm palpation is performed alternately on each side.
The examiner uses deep pressure to distinguish smooth and irregular structures.
This assessment requires careful examination of the side of the abdomen while maintaining consistent pressure.
The examiner evaluates:
Smoothness
Firmness
Continuity of structures
Presence of small protruding parts
Interpreting Findings
Fetal Back
The fetal back typically feels:
Smooth
Firm
Continuous
Slightly convex
Because of its broad surface, the back is usually easier to identify than the extremities.
Small Fetal Parts
The arms and legs feel:
Irregular
Mobile
Nodular
Less continuous
Movement of these structures may occasionally be felt during examination.
Example
Suppose the examiner identifies:
A smooth, firm structure on the mother’s left side.
Multiple small irregular parts on the right side.
These findings suggest that the fetal back is positioned on the left side of the uterus and the extremities are located opposite the side as the back.
The second maneuver provides critical information for determining fetal position and guiding fetal heart rate assessment.
Third Leopold Maneuver: Identifying the Presenting Part
The third maneuver evaluates the lower portion of the uterus to determine which fetal structure is approaching or occupying the pelvic inlet.
This assessment is commonly referred to as the pelvic grip.
Purpose of the Third Maneuver
The objectives include:
Identifying the presenting part.
Confirming fetal presentation.
Assessing mobility of the presenting structure.
Evaluating whether engagement has begun.
Technique
To perform the third maneuver:
The examiner places a hand just above the pubic symphysis.
The thumb and fingers of one hand are positioned around the lower uterine segment.
Using the thumb and fingers, the examiner gently grasps the presenting structure.
The examiner evaluates its consistency and mobility.
Many clinicians perform this step by using the thumb and fingers of the dominant hand while stabilizing the uterus with the opposite hand.
The examination often involves the fingers of one hand carefully encircling the presenting structure immediately above the pelvic inlet.
Interpreting Findings
Fetal Head
When the fetal head is the presenting part:
It feels firm and round.
The fetal head is hard compared with other fetal structures.
It may move independently if not yet engaged.
Breech Presentation
When a breech presentation is present:
The structure feels softer.
It is less spherical.
The presenting mass may be broader and less mobile.
Example
A clinician performing the third maneuver identifies:
A hard, rounded structure in the lower uterus.
The structure moves when pressure is applied.
These findings suggest that the fetal head is presenting but may not yet be fully engaged within the pelvis.
The third maneuver therefore helps determine what fetal part is approaching the birth canal.
Fourth Leopold Maneuver: Determining Fetal Descent and Engagement
The fourth Leopold Maneuver assesses the relationship between the presenting part and the maternal pelvis. It is specifically designed to evaluate fetal descent and engagement.
This step is often the most technically challenging component of the examination.
Purpose of the Fourth Maneuver
The objectives include:
Determining the degree of fetal descent.
Assessing engagement of the presenting part.
Evaluating the relationship between the presenting structure and the pelvic inlet.
Confirming findings obtained during previous maneuvers.
Technique
To perform the fourth maneuver:
The examiner turns and faces the patient’s feet.
Both hands are placed on the lower portion of the abdomen.
The fingertips are directed toward the pubis.
The examiner carefully applies pressure downward and inward.
During this step, the tips of the fingers assess how deeply the presenting part has entered the maternal pelvis.
Some clinicians specifically evaluate engagement by advancing the fingers of the right hand and left hand toward the pelvic inlet simultaneously.
Interpreting Findings
Engaged Presenting Part
When engagement has occurred:
The presenting part lies deeper within the pelvis.
Less of the structure can be palpated above the pelvic inlet.
The head demonstrates reduced mobility.
These findings suggest that the presenting structure has descended into the maternal pelvis.
Unengaged Presenting Part
When engagement has not occurred:
A larger portion of the presenting structure remains palpable.
The structure may move more freely.
Descent into the pelvis is incomplete.
Example
Consider a patient at 39 weeks of gestation.
During the fourth maneuver:
Only a small portion of the fetal head remains palpable above the pelvic inlet.
The head exhibits minimal mobility.
These findings indicate significant fetal descent and likely engagement within the maternal pelvis.
Integrating Findings From All Four Steps
The true value of the Leopold Maneuver emerges when all four steps are interpreted together.
For example:
The first maneuver identifies buttocks within the fundus.
The second maneuver locates the fetal back on the left side.
The third maneuver confirms the fetal head as the presenting part.
The fourth maneuver demonstrates engagement of the head within the pelvis.
Collectively, these findings indicate a fetus in a longitudinal lie, cephalic presentation, left-sided fetal back position, and engaged fetal head—an arrangement generally considered favorable for vaginal delivery.
By systematically performing the four steps and accurately interpreting their findings, healthcare professionals can obtain a detailed understanding of fetal orientation, labor readiness, and the relationship between the fetus and the maternal birth canal. This information forms the foundation for effective obstetric assessment and supports informed clinical decision-making throughout late pregnancy and labor.
Interpreting Leopold Maneuver Findings
Successfully performing the Leopold Maneuver is only one part of the assessment process. Equally important is the ability to accurately interpret the findings obtained during examination. The information gathered from the four maneuvers must be analyzed collectively rather than viewed as isolated observations. When interpreted correctly, the findings provide valuable insight into fetal lie, fetal presentation, fetal position, fetal engagement, and the overall relationship between the fetus and the maternal pelvis.
Interpretation requires an understanding of normal and abnormal fetal orientations. A healthcare provider must evaluate the location of the fetal head, fetal back, and presenting part while considering how these structures relate to the uterus and birth canal. The findings obtained through the Leopold Maneuver help clinicians determine whether labor is likely to progress normally or whether additional assessment and intervention may be necessary.
Several key questions guide interpretation:
Is the fetus in a longitudinal, transverse, or oblique lie?
What structure is presenting at the pelvic inlet?
Has the presenting part engaged in the pelvis?
Is the fetal position favorable for vaginal birth?
Are there findings that may increase obstetric risk?
The answers to these questions influence prenatal monitoring, labor management, and delivery planning.
Identifying Cephalic Presentation
A cephalic presentation occurs when the fetal head occupies the lower segment of the uterus and serves as the presenting part during labor. This is the most common and generally the most favorable fetal presentation because the fetal head is anatomically suited to navigate the maternal birth canal.
In most term pregnancies, healthcare providers expect to identify a cephalic presentation during the Leopold Maneuver.
Characteristics of Cephalic Presentation
Several examination findings typically suggest cephalic presentation:
First Maneuver Findings
During the first maneuver, the examiner palpates the fundal region.
Findings may include:
A softer and broader mass within the fundus.
The buttock occupying the upper part of the uterus.
Absence of a hard, round structure in the fundal area.
These observations suggest that the fetal head is not located at the top of the uterus.
Third Maneuver Findings
During the third maneuver, the examiner evaluates the presenting part above the pubic symphysis.
Typical findings include:
A firm, round structure.
A smooth contour.
Mobility if engagement has not occurred.
Because the fetal head is hard, it can often be distinguished from other fetal structures through palpation.
Second Maneuver Findings
The second maneuver helps locate the fetal back.
A smooth, firm surface is usually identified on one side of the abdomen, while smaller fetal parts are detected on the opposite side.
The location of the fetal back assists in determining fetal position and identifying the orientation of the occiput.
Clinical Example
A patient at 38 weeks of gestation undergoes abdominal assessment.
The examiner identifies:
A broad, soft structure in the fundus.
A smooth fetal back along the mother’s left side.
A firm, round presenting structure above the pelvic inlet.
These findings strongly suggest a longitudinal lie with cephalic presentation.
Clinical Significance of Cephalic Presentation
Cephalic presentation is generally associated with:
More efficient labor progression.
Lower rates of delivery complications.
Greater likelihood of spontaneous vaginal birth.
Reduced need for operative intervention.
Although cephalic presentation is considered favorable, the exact fetal position remains important. For example, an occiput anterior position often facilitates labor more effectively than an occiput posterior position.
Recognizing Breech Presentation
A breech presentation occurs when the buttocks, feet, or lower extremities occupy the lower uterine segment and become the presenting part.
Recognition of breech presentation is one of the most important objectives of the Leopold Maneuver because breech births carry increased maternal and fetal risks compared with cephalic births.
Characteristics of Breech Presentation
Several findings suggest breech presentation.
First Maneuver Findings
During fundal assessment, the examiner may identify:
A hard, round structure within the fundus.
A mobile fetal head.
Distinct spherical contours.
These findings indicate that the fetal head occupies the upper portion of the uterus.
Third Maneuver Findings
During assessment of the lower uterus:
The presenting structure feels softer.
The mass appears broader and less defined.
The presenting structure lacks the firmness of the fetal head.
The examiner may identify a buttock rather than a cephalic presenting part.
Types of Breech Presentation
Breech presentations can occur in several forms:
Frank Breech
Characteristics include:
Buttocks presenting first.
Legs flexed upward toward the head.
Complete Breech
Characteristics include:
Buttocks presenting first.
Hips and knees flexed.
Footling Breech
Characteristics include:
One or both feet presenting below the buttocks.
Each type has unique implications for labor and delivery management.
Clinical Example
A woman at 37 weeks undergoes examination.
The healthcare provider palpates:
A firm fetal head in the fundus.
A softer presenting structure above the pelvic inlet.
A longitudinal fetal lie.
These findings suggest breech presentation and warrant further evaluation.
Clinical Significance of Breech Presentation
Recognition of breech presentation is important because it may increase the risk of:
Cord prolapse.
Birth trauma.
Labor complications.
Emergency delivery interventions.
When breech presentation is suspected, ultrasound may be utilized to confirm findings and assist with delivery planning.
Detecting Transverse and Oblique Lies
One of the most important functions of the Leopold Maneuver is identifying abnormal fetal lie. While a longitudinal lie is expected in most term pregnancies, some fetuses assume transverse or oblique orientations.
These positions can significantly affect labor progression and delivery outcomes.
Detecting a Transverse Lie
A transverse lie occurs when the long axis of the fetus is perpendicular to the long axis of the uterus.
During examination, several findings may indicate a transverse lie:
First Maneuver Findings
The examiner may have difficulty identifying either the fetal head or buttocks in the fundus.
Second Maneuver Findings
The fetal head may be palpated on one side of the abdomen, while the buttocks are felt on the opposite side.
For example:
The fetal head may be located in the right lower quadrant.
The buttocks may be located in the left upper quadrant.
This side-to-side orientation strongly suggests a transverse lie.
Third Maneuver Findings
No clear presenting part may be identified above the pelvic inlet.
Clinical Significance of Transverse Lie
A transverse lie is associated with:
Failure of normal labor progression.
Increased risk of cord prolapse.
Inability to achieve vaginal delivery in most cases.
Need for additional obstetric evaluation.
Because of these risks, identification of a transverse lie is clinically significant.
Detecting an Oblique Lie
An oblique lie occurs when the fetus occupies a diagonal orientation between longitudinal and transverse positions.
Characteristics may include:
Difficulty identifying a clear presenting part.
Fetal head and buttocks located in opposite diagonal regions.
Unstable fetal orientation.
Unlike a fixed transverse lie, an oblique lie may spontaneously convert to a longitudinal lie before labor begins.
Clinical Example
A patient at 36 weeks presents for routine prenatal assessment.
The examiner finds:
The fetal head in the right upper abdomen.
The buttocks in the left lower abdomen.
No distinct presenting part at the pelvic inlet.
These findings suggest an oblique lie and indicate the need for follow-up assessment.
Implications of Findings for Labor and Delivery
The findings obtained through the Leopold Maneuver have important implications for labor management and delivery planning. Understanding fetal orientation allows healthcare providers to anticipate potential complications and make informed clinical decisions.
Implications of Cephalic Presentation
When cephalic presentation is identified:
Vaginal delivery is generally feasible.
Labor progression is more predictable.
Obstetric interventions may be minimized.
Maternal and neonatal outcomes are often favorable.
However, fetal position must also be considered because malposition can still complicate labor.
Implications of Breech Presentation
When breech presentation is identified:
Additional assessment is often required.
Delivery planning becomes more complex.
Risks associated with vaginal breech birth must be evaluated.
Consultation with an obstetrician may be necessary.
The decision regarding mode of delivery depends on multiple maternal and fetal factors.
Implications of Transverse and Oblique Lies
When transverse or oblique lie is identified:
Vaginal delivery may not be possible.
Fetal repositioning strategies may be considered.
Ultrasound confirmation is typically recommended.
Ongoing monitoring becomes important.
These abnormal lies often require careful obstetric management as term approaches.
Role in Predicting Labor Progression
The Leopold Maneuver also provides information about fetal descent and engagement.
For example:
An engaged fetal head suggests that labor may be approaching.
Lack of engagement near term may warrant additional evaluation.
The relationship between the presenting part and the maternal pelvis may influence delivery planning.
Contribution to Fetal Health Evaluation
Interpretation of Leopold Maneuver findings contributes to broader fetal health assessment by identifying conditions that may affect labor and delivery outcomes.
Abnormal findings may prompt:
Additional fetal surveillance.
Ultrasound confirmation.
Specialist consultation.
Revised birth planning.
Closer monitoring during labor.
Ultimately, the ability to accurately interpret findings obtained through the Leopold Maneuver transforms simple abdominal palpation into a powerful clinical assessment tool. By distinguishing cephalic presentation, recognizing breech presentation, detecting transverse and oblique lies, and understanding their implications for labor and delivery, healthcare providers can make informed decisions that support safe maternal and fetal outcomes throughout the childbirth process.
Clinical Applications and Limitations of the Leopold Maneuver
The Leopold Maneuver has remained a fundamental component of obstetric assessment for more than a century because it provides valuable clinical information about the fetus through direct physical examination. Although advances in diagnostic imaging have transformed prenatal care, the maneuver continues to play an important role in evaluating fetal orientation, monitoring pregnancy progression, and supporting labor planning. Its enduring relevance stems from its simplicity, accessibility, and ability to provide immediate bedside information without the need for specialized equipment.
At the same time, healthcare professionals must recognize that the Leopold Maneuver has limitations. While skilled examiners can obtain highly useful information through abdominal palpation, the technique is influenced by numerous maternal, fetal, and examiner-related factors. Therefore, findings obtained through the maneuver should always be interpreted within the broader clinical context and, when necessary, supplemented with additional diagnostic methods.
Understanding both the strengths and limitations of the Leopold Maneuver enables healthcare providers to use the technique effectively while avoiding overreliance on physical examination findings alone.
Role in Fetal Health Assessment
One of the most important clinical applications of the Leopold Maneuver is its contribution to ongoing fetal health assessment. Although the maneuver does not directly measure fetal oxygenation, growth, or physiologic function, it provides essential information about fetal orientation and positioning that can significantly influence pregnancy outcomes.
The assessment serves as a valuable screening tool that helps clinicians identify conditions requiring closer observation or further evaluation.
Assessing Normal Fetal Orientation
A major objective of the Leopold Maneuver is determining whether the fetus occupies a position that supports normal labor and delivery.
Through systematic abdominal palpation used to assess the fetus, healthcare providers can determine:
Fetal lie
Fetal presentation
Fetal position
Fetal engagement
Location of the fetal back
When assessment findings indicate a longitudinal lie with cephalic presentation and progressive engagement of the fetal head, clinicians are generally reassured that the pregnancy is progressing appropriately from an obstetric standpoint.
For example, a patient at 39 weeks of gestation may demonstrate:
Cephalic presentation
Anterior fetal position
Engaged presenting part
Well-defined fetal back
These findings suggest favorable conditions for labor and delivery.
Identifying Conditions That May Affect Fetal Well-Being
The Leopold Maneuver is also useful for identifying abnormal findings that may influence fetal outcomes.
Examples include:
Breech presentation
Transverse lie
Persistent oblique lie
Failure of fetal engagement
Unusual fetal positioning
Such findings may increase the risk of:
Prolonged labor
Obstructed labor
Cord prolapse
Operative delivery
Birth complications
Early recognition allows healthcare providers to initiate appropriate monitoring and management strategies.
Supporting Prenatal and Intrapartum Assessment
The maneuver can be incorporated into routine prenatal visits and labor evaluations.
During prenatal care, the examination may be used to:
Monitor fetal orientation throughout the third trimester.
The location of the fetal back identified during the second Leopold Maneuver can help determine the optimal location for fetal heart tone assessment.
Because fetal heart sounds are usually heard most clearly over the fetal back, locating this structure allows clinicians to position monitoring equipment more effectively.
For example:
If the fetal back is located along the left side of the abdomen, heart tones are often best auscultated on that side.
If the back is positioned on the right side, the point of maximal intensity may shift accordingly.
This practical application demonstrates how physical examination findings can improve other components of fetal assessment.
Contributing to Clinical Decision-Making
The information obtained through the Leopold Maneuver frequently influences obstetric decision-making.
Assessment findings may guide:
Labor planning
Delivery preparation
Need for specialist referral
Selection of additional diagnostic tests
Timing of further evaluations
Thus, the maneuver functions as an important bridge between physical examination and evidence-based clinical management.
Factors Affecting Accuracy
Despite its clinical value, the accuracy of the Leopold Maneuver can vary considerably depending on several factors. Even experienced examiners may encounter situations in which fetal structures are difficult to identify through palpation alone.
Understanding these limitations is essential for appropriate interpretation of examination findings.
Maternal Body Habitus
Maternal body composition is one of the most significant factors affecting examination accuracy.
In patients with increased abdominal adipose tissue:
Fetal structures may be more difficult to palpate.
Identification of the fetal back may be challenging.
Determination of fetal position may be less precise.
The additional tissue between the examiner’s hands and the uterus can reduce the ability to distinguish specific fetal structures.
Abdominal Muscle Tension
Successful assessment requires relaxation of the abdominal wall.
Excessive muscle tension may result from:
Anxiety
Discomfort
Fear of examination
Voluntary guarding
When abdominal muscles contract, palpation becomes more difficult and findings may be less reliable.
This is one reason healthcare providers emphasize patient comfort and relaxation before performing the maneuver.
Polyhydramnios
Polyhydramnios, or excessive amniotic fluid, can reduce the effectiveness of abdominal palpation.
Excess fluid may:
Increase fetal mobility.
Obscure fetal landmarks.
Make fetal parts more difficult to distinguish.
As a result, assessment findings may be less accurate.
Oligohydramnios
Conversely, oligohydramnios may alter palpation findings by reducing the cushioning effect of amniotic fluid.
Although fetal structures may sometimes be easier to feel, abnormal fluid volumes can complicate interpretation and may indicate underlying pregnancy concerns.
Multiple Gestation
In twin or higher-order pregnancies, determining fetal orientation becomes substantially more complex.
In such cases, ultrasound evaluation often provides more reliable information.
Placental Location
An anterior placenta can affect examination findings because the placenta lies between the fetal structures and the examiner’s hands.
This may:
Reduce palpation sensitivity.
Obscure the fetal back.
Make assessment of fetal position more difficult.
Gestational Age
The reliability of the Leopold Maneuver generally increases as pregnancy advances.
Earlier in pregnancy:
Fetal structures are smaller.
Fetal movement is greater.
Orientation may change frequently.
During the later weeks of gestation, fetal position tends to stabilize, making examination findings more meaningful.
Examiner Experience
Perhaps one of the most important factors affecting accuracy is examiner skill.
Experienced healthcare professionals are generally better able to:
Differentiate fetal structures.
Interpret subtle findings.
Recognize abnormal presentations.
Integrate examination results into clinical assessment.
In contrast, less experienced clinicians may have difficulty distinguishing between the fetal head, buttocks, and other fetal parts.
This highlights the importance of continued practice and clinical training.
When Ultrasound Confirmation Is Needed
Although the Leopold Maneuver provides valuable clinical information, there are circumstances in which physical examination alone is insufficient. In these situations, ultrasound serves as an important complementary tool that can confirm findings and provide additional diagnostic information.
Suspected Breech Presentation
When examination findings suggest a breech presentation, ultrasound confirmation is frequently recommended.
For example, if:
The fetal head is palpated in the fundus.
A softer presenting structure occupies the lower uterus.
Breech presentation is suspected.
Ultrasound may be used to confirm fetal orientation and determine the specific type of breech presentation.
Suspected Transverse or Oblique Lie
When a transverse or oblique lie is identified, ultrasound confirmation is often necessary because these positions can significantly affect delivery planning.
Imaging can help:
Verify fetal orientation.
Assess fetal movement.
Determine whether spontaneous repositioning has occurred.
Accurate diagnosis is essential because persistent transverse lie generally precludes vaginal delivery.
Difficulty Obtaining Reliable Findings
In some situations, palpation findings may be inconclusive.
Examples include:
Maternal obesity.
Polyhydramnios.
Multiple gestation.
Excessive fetal movement.
Significant maternal discomfort.
When reliable assessment cannot be achieved through abdominal examination, ultrasound provides a more definitive evaluation.
Evaluation of Fetal Growth and Fetal Weight
Although experienced clinicians may assist in predicting fetal weight through abdominal examination, the Leopold Maneuver cannot accurately quantify fetal size.
When concerns arise regarding:
Fetal growth restriction
Macrosomia
Abnormal growth patterns
ultrasound evaluation is typically required.
Imaging provides more accurate information when clinicians need to estimate term fetal weight or assess fetal growth trends.
Assessment of High-Risk Pregnancies
Ultrasound confirmation is often indicated in high-risk pregnancies involving:
Hypertensive disorders
Diabetes mellitus
Placental abnormalities
Multiple gestation
Suspected fetal anomalies
In these situations, physical examination findings should be integrated with imaging studies and other clinical data.
Confirmation Before Obstetric Interventions
Before certain obstetric procedures, ultrasound may be necessary to confirm fetal orientation.
Examples include:
External cephalic version
Induction planning
Operative delivery preparation
Accurate identification of fetal presentation and position is critical before such interventions are undertaken.
Integrating Physical Examination and Ultrasound Findings
Modern obstetric practice does not view the Leopold Maneuver and ultrasound as competing methods. Rather, they function as complementary assessment tools.
The Leopold Maneuver provides:
Immediate bedside information.
Real-time physical assessment.
Valuable clinical context.
Ongoing monitoring capabilities.
Ultrasound provides:
Detailed visualization of fetal anatomy.
Objective confirmation of findings.
Precise assessment of fetal growth and position.
Additional diagnostic information.
When used together, these approaches create a comprehensive framework for fetal evaluation. The Leopold Maneuver remains an essential component of obstetric assessment because it allows healthcare providers to gather meaningful information through skilled physical examination, while ultrasound serves as a powerful adjunct when greater diagnostic precision is required. Together, they support informed clinical decision-making and contribute to safe, effective maternal and fetal care throughout pregnancy.
Practical Tips for Nursing Students Performing the Maneuvers
Developing proficiency in the Leopold Maneuver requires more than simply memorizing the four steps of the examination. The ability to accurately identify fetal structures, interpret findings, and communicate results effectively develops through repeated practice, critical observation, and an understanding of maternal-fetal anatomy. While the principles of the maneuver are straightforward, many individuals initially find it challenging to distinguish between various fetal parts or confidently determine fetal lie and presentation.
For nursing students, learning the Leopold Maneuver is an important step toward building strong assessment skills in maternal and newborn care. The technique encourages the integration of theoretical knowledge with hands-on clinical practice and helps develop confidence in obstetric assessment. With experience, students become more skilled at recognizing fetal landmarks, evaluating fetal orientation, and understanding the clinical significance of their findings.
Several practical strategies can improve accuracy and confidence when performing the maneuvers.
Techniques for Effective Abdominal Palpation
Effective palpation is the foundation of a successful Leopold Maneuver. The quality of information obtained during the examination depends largely on the examiner’s ability to identify fetal structures through touch and correctly interpret what is felt beneath the abdominal wall.
Develop a Strong Understanding of Maternal-Fetal Anatomy
Before attempting the examination, it is essential to understand:
The structure of the uterus.
The location of the fundus.
The anatomy of the maternal pelvis.
Major fetal landmarks.
Typical fetal positions near term.
Students who understand where fetal structures are expected to be located are more likely to recognize them during palpation.
For example:
The fetal head is usually hard, round, and mobile.
The fetal back typically feels smooth and firm.
The extremities often feel irregular and mobile.
The buttocks feel softer and less defined than the head.
Knowledge of these characteristics improves examination accuracy.
Use a Systematic Approach
One of the most common causes of inaccurate assessment is performing the examination inconsistently.
The Leopold Maneuver should always be performed in the same sequence:
Assess the fundal pole.
Locate the fetal back.
Identify the presenting part.
Evaluate descent and engagement.
Following the same sequence each time helps ensure that important findings are not overlooked.
A systematic approach also allows each maneuver to confirm information obtained during previous steps.
Relax the Hands Before Examination
Excessively rigid hands can make palpation less effective.
Instead:
Keep the hands relaxed.
Use the palms and fingers rather than fingertips alone.
Apply pressure gradually.
Maintain consistent contact with the abdomen.
Relaxed hands are often more sensitive to subtle differences in tissue consistency.
Apply Appropriate Pressure
The examination requires enough pressure to identify fetal structures but not so much that it causes discomfort.
Healthcare providers should use:
Controlled pressure.
Smooth movements.
Deliberate palpation techniques.
The goal is to apply gentle but deep pressure that allows identification of structures beneath the abdominal wall.
Applying too little pressure may make fetal structures difficult to identify, whereas excessive pressure may cause discomfort and increase abdominal muscle tension.
Fetal structures become more difficult to palpate.
Assessment accuracy may decrease.
Helpful strategies include:
Explaining each step before beginning.
Encouraging slow breathing.
Maintaining privacy.
Reassuring the patient throughout the examination.
A relaxed patient generally facilitates more accurate palpation findings.
Compare Findings From Both Sides of the Abdomen
During the second Leopold Maneuver, students should carefully compare both sides of the abdomen.
The examiner should assess:
Which side feels smooth and firm.
Which side contains small irregular structures.
Whether fetal movement is present.
This comparison helps identify the location of the fetal back and supports accurate assessment of fetal position.
Practice Correlating Findings With Ultrasound Results
One of the most effective learning strategies is comparing palpation findings with ultrasound findings.
For example:
A student may identify a suspected cephalic presentation during abdominal examination.
Ultrasound can then confirm whether the interpretation was correct.
Repeated comparison improves confidence and strengthens clinical judgment.
Interpreting Leopold Maneuver
Common Mistakes and How to Avoid Them
Learning the Leopold Maneuver involves developing both technical and interpretive skills. Many mistakes occur during early clinical experiences, but understanding common errors can help students improve more quickly.
Mistake 1: Performing the Examination Too Quickly
Rushing through the assessment is one of the most common errors.
When the examination is performed too quickly:
Important landmarks may be missed.
Findings may be misinterpreted.
Fetal structures may be confused.
How to Avoid It
Students should:
Proceed slowly.
Evaluate each structure carefully.
Confirm findings before moving to the next step.
Deliberate examination generally produces more reliable results.
Mistake 2: Confusing the Fetal Head and Buttocks
Distinguishing between the fetal head and buttocks can be difficult for beginners.
The structures may appear similar unless the examiner carefully evaluates:
Shape
Firmness
Mobility
Definition of borders
How to Avoid It
Remember:
The fetal head is hard, round, and well defined.
The buttocks are softer, broader, and less distinct.
Repeated practice improves the ability to differentiate these structures.
Mistake 3: Applying Excessive Pressure
Some students believe that stronger pressure produces better findings.
In reality, excessive force may:
Cause discomfort.
Increase muscle tension.
Reduce examination accuracy.
How to Avoid It
Use gradual pressure and allow the hands to identify structures through controlled palpation rather than force.
Mistake 4: Ignoring Maternal Positioning
Improper positioning can significantly affect findings.
For example:
Tense abdominal muscles may obscure fetal landmarks.
A full bladder may alter abdominal contours.
Patient discomfort may interfere with assessment.
How to Avoid It
Always ensure:
Appropriate positioning.
Bladder emptying before examination.
Patient comfort throughout the assessment.
Mistake 5: Focusing on One Maneuver Instead of the Entire Assessment
Some students place too much emphasis on a single finding.
However, accurate interpretation requires integrating information from all four steps.
How to Avoid It
Always analyze findings collectively.
For example:
Fundal findings
Location of the fetal back
Presenting part
Degree of engagement
should be interpreted together rather than independently.
Mistake 6: Failing to Verify Uncertain Findings
Students occasionally assume that uncertain findings are correct without seeking clarification.
How to Avoid It
When uncertainty exists:
Repeat the assessment.
Consult an experienced clinician.
Compare findings with ultrasound when available.
Seeking confirmation is an important aspect of safe clinical practice.
Documentation and Communication of Findings
Accurate documentation and effective communication are essential components of obstetric assessment. Even when examination findings are correct, they provide little clinical value if they are not properly recorded and communicated to other healthcare professionals.
Importance of Accurate Documentation
Documentation creates a permanent record of assessment findings and supports continuity of care.
Proper documentation helps:
Monitor changes over time.
Facilitate communication among healthcare providers.
Support clinical decision-making.
Improve patient safety.
In obstetric settings, documentation may also be used to evaluate labor progression and pregnancy outcomes.
What Should Be Documented?
Following completion of the Leopold Maneuver, the healthcare provider should document:
Fetal lie.
Fetal presentation.
Fetal position.
Fetal engagement.
Location of the fetal back.
Maternal tolerance of the examination.
Any difficulties encountered during assessment.
Relevant observations should be recorded clearly and objectively.
Example of Documentation
A clinical note might state:
Leopold Maneuver performed. Fetus in longitudinal lie with cephalic presentation. Fetal back palpated along the left side of the abdomen. Presenting part identified as the fetal head. Head partially engaged within the maternal pelvis. Patient tolerated procedure well.
This type of documentation provides concise yet clinically meaningful information.
Communicating Findings to the Healthcare Team
Communication is equally important because assessment findings often influence clinical decisions.
Information obtained through the Leopold Maneuver may need to be communicated to:
Registered nurses.
Midwives.
Obstetricians.
Labor and delivery staff.
Other members of the maternal care team.
Effective communication ensures that all providers share a common understanding of fetal status.
Reporting Abnormal Findings
Certain findings require prompt communication.
Examples include:
Breech presentation near term.
Transverse lie.
Failure of engagement at term.
Difficulty identifying the presenting part.
Significant changes from previous assessments.
Timely reporting allows appropriate follow-up and intervention when necessary.
Using Standardized Terminology
Clear communication requires consistent terminology.
When discussing findings, healthcare providers should use accepted obstetric terms such as:
Cephalic presentation
Breech presentation
Longitudinal lie
Transverse lie
Occiput anterior
Occiput posterior
Engagement
Standardized language reduces misunderstandings and improves interdisciplinary collaboration.
Building Confidence Through Practice
Mastering the Leopold Maneuver is a gradual process that develops through repeated clinical experience. The most successful practitioners combine strong anatomical knowledge, careful palpation techniques, critical thinking, accurate documentation, and effective communication. By refining these skills, healthcare professionals can improve their ability to assess fetal orientation, contribute to informed obstetric decision-making, and support safe, high-quality maternal care throughout pregnancy and labor.
Feeling stressed about writing a detailed nursing paper?
The Leopold Maneuver remains one of the most valuable and enduring clinical assessment techniques in obstetric care. Despite significant advancements in prenatal imaging and diagnostic technology, this method of abdominal palpation continues to provide healthcare professionals with essential information about fetal lie, fetal presentation, fetal position, and fetal engagement. By systematically evaluating the relationship between the fetus and the maternal pelvis, clinicians can gain important insights that support pregnancy monitoring, labor preparation, and delivery planning.
Beyond its practical applications, the Leopold Maneuver exemplifies the importance of strong physical assessment skills in healthcare. It demonstrates how careful observation, anatomical knowledge, and skilled palpation can yield meaningful clinical information without the immediate need for specialized equipment. When performed correctly, the maneuver helps identify whether the fetal head, buttocks, or another fetal part occupies the lower uterus, assists in locating the fetal back, and contributes to an overall assessment of fetal health and readiness for birth.
For nursing professionals and other maternal health practitioners, mastering Leopold’s maneuvers is an important step toward developing confidence in obstetric assessment. The technique encourages critical thinking, reinforces understanding of maternal-fetal anatomy, and enhances the ability to interpret clinical findings in real-world settings. While experience improves accuracy, a systematic approach combined with ongoing practice allows clinicians to refine their skills and make more informed assessments.
It is equally important to recognize that the Leopold Maneuver has limitations. Factors such as maternal body habitus, fetal position, amniotic fluid volume, multiple gestation, and examiner experience can influence the reliability of findings. Consequently, the maneuver should be viewed as one component of a comprehensive obstetric evaluation rather than a standalone diagnostic tool. When uncertainty exists, ultrasound and other diagnostic methods provide valuable confirmation and additional clinical detail.
Ultimately, the Leopold Maneuver serves as a bridge between foundational assessment skills and modern obstetric practice. Its continued relevance reflects its effectiveness as a safe, noninvasive, and informative examination technique. By understanding the principles behind the maneuver, applying the four steps correctly, and accurately interpreting findings, healthcare providers can contribute to improved maternal care, informed clinical decision-making, and positive pregnancy outcomes. As both a teaching tool and a practical bedside assessment method, the Leopold Maneuver continues to play a significant role in supporting quality obstetric and fetal health evaluation.
Frequently Asked Questions
What is the step-by-step procedure of Leopold’s maneuver?
The Leopold Maneuver consists of four systematic abdominal palpation steps:
First Maneuver (Fundal Grip): Palpate the fundus to identify which fetal part occupies the upper uterus (head or buttocks).
Second Maneuver (Umbilical/Lateral Grip): Palpate both sides of the abdomen to locate the fetal back and small fetal parts.
Third Maneuver (Pawlik’s Grip): Palpate just above the pubic symphysis to identify the presenting part and assess its mobility.
Fourth Maneuver (Pelvic Grip): Face the mother’s feet and palpate the lower abdomen to determine fetal descent and engagement in the maternal pelvis.
What is the 4th step of the Leopold’s maneuver?
The fourth Leopold maneuver assesses the degree of fetal descent and engagement. The examiner faces the mother’s feet and places both hands on the lower abdomen, pressing inward toward the pelvic inlet to determine how far the presenting part has descended into the pelvis.
What is the first maneuver to determine fetal position using Leopold’s maneuvers?
The first maneuver, also called the fundal grip, involves palpating the fundus (top of the uterus) to identify whether the fetal head or buttocks occupy the upper uterus. This helps determine fetal lie and provides initial clues about fetal presentation.
What is the third step of the Leopold’s maneuver?
The third maneuver, often called Pawlik’s grip, is performed by placing the thumb and fingers just above the pubic symphysis to grasp the presenting part. This step helps identify whether the fetal head or buttocks are presenting and assesses whether the presenting part is mobile or engaged in the pelvis.
MPV Blood Test: Understanding Mean Platelet Volume, Platelet Size, Blood Test Results, and What Your Test Result Means
The MPV Blood Test is a commonly performed laboratory assessment that provides important information about platelet characteristics and overall hematologic function. Although many healthcare professionals and patients focus primarily on the platelet count reported in a laboratory report, the size of platelets can be equally significant. The measurement of mean platelet volume (MPV) offers insight into platelet production, platelet activity, and the body’s response to various physiological and pathological processes. When interpreted correctly, MPV can contribute valuable information to the assessment of bleeding disorders, inflammatory conditions, cardiovascular diseases, and other health concerns.
Platelets are small, anucleate cell fragments produced in the bone marrow from megakaryocytes. Their primary role is to maintain hemostasis by helping form a blood clot when blood vessels are damaged. However, platelets are not all identical. Some are larger and younger, while others are smaller and older. These differences in platelet size often reflect underlying changes in platelet production, platelet turnover, and platelet function. The MPV Blood Test was developed to evaluate these variations, making it a useful complement to traditional platelet measurements.
One reason the MPV Blood Test has gained increasing clinical attention is that it provides information that a platelet count alone cannot reveal. Two individuals may have identical platelet counts yet possess markedly different platelet characteristics. For example:
One patient may have a normal platelet count with predominantly large, newly produced platelets.
Another patient may have the same platelet count but mostly smaller, older platelets.
Despite having similar platelet numbers, these patients may have very different underlying physiological processes occurring within the bone marrow and circulatory system. This demonstrates why evaluating both platelet quantity and platelet quality is important when interpreting laboratory findings.
The significance of MPV becomes even clearer when considering how the body regulates platelet production. The bone marrow continuously produces platelets to replace those removed from circulation. Under normal circumstances, there is a balance between platelet destruction and replacement. However, this balance can be disrupted by numerous conditions, including:
Acute and chronic inflammation
Infections
Autoimmune diseases
Cardiovascular disorders
Bone marrow abnormalities
Certain medications
Hematologic malignancies
When these conditions affect platelet production or destruction, changes in MPV often occur before other abnormalities become apparent. As a result, the MPV Blood Test may provide early clues regarding underlying disease processes.
Modern research has demonstrated that MPV is more than simply a measurement of platelet size. Numerous studies have shown that larger platelets tend to be more metabolically active and may exhibit greater prothrombotic potential. Consequently, an increased MPV has been investigated as a possible marker of platelet activation and cardiovascular risk. Conversely, lower MPV values may be associated with impaired platelet production or reduced bone marrow activity. While these relationships continue to be explored, the growing body of evidence highlights the expanding clinical relevance of mean platelet volume in patient assessment.
The MPV Blood Testis most commonly performed as part of a complete blood count (CBC), one of the most frequently ordered laboratory tests in healthcare. Because the test is routinely included in many laboratory panels, clinicians often have access to MPV data without ordering additional investigations. Nevertheless, MPV is frequently underutilized or misunderstood. Many individuals receive laboratory reports showing abnormal MPV values without understanding what the findings may indicate or how they relate to other blood parameters.
Understanding MPV requires an appreciation of how it interacts with several other laboratory measurements. Interpretation often involves evaluating:
Platelet count – the total number of circulating platelets.
Platelet indices – measurements that provide information about platelet characteristics.
Red blood cells – which may reveal concurrent hematologic abnormalities.
White blood cells – which may indicate infection, inflammation, or immune responses.
Whole blood findings – which provide a broader clinical context for interpretation.
Because these laboratory parameters are interconnected, MPV should never be viewed as an isolated value. Rather, it serves as one component of a comprehensive assessment of hematologic health.
Another important consideration is that MPV values can vary due to factors unrelated to disease. Laboratory techniques, specimen handling, timing of analysis, and differences among testing equipment can all influence results. This means that a single abnormal value does not necessarily indicate a serious medical condition. Instead, trends over time, accompanying symptoms, and other laboratory findings must be considered when determining the clinical significance of a particular result.
Several key concepts help explain why the MPV Blood Test is valuable in clinical practice:
It evaluates the average size of circulating platelets.
It provides indirect information about platelet production in the bone marrow.
It may reflect platelet turnover and platelet activation.
It helps clinicians interpret abnormal platelet counts more effectively.
It contributes to the evaluation of inflammatory, cardiovascular, and hematologic conditions.
It supports a more comprehensive interpretation of complete blood count findings.
As laboratory medicine continues to evolve, the role of MPV in patient evaluation has become increasingly recognized. Researchers continue to investigate the relationship between MPV and various disease states, while clinicians use MPV alongside other laboratory markers to support diagnostic reasoning and patient monitoring. Although MPV alone cannot establish a diagnosis, it often provides valuable contextual information that can guide further investigation.
This article provides a comprehensive examination of the MPV Blood Test, beginning with the fundamental concepts of mean platelet volume and platelet biology. It explores how MPV is measured, why platelet size matters, how MPV relates to platelet count, and what high or low values may indicate. The discussion also examines the interpretation of MPV alongside other blood test results, additional tests used to investigate abnormal findings, clinical applications in patient care, and the limitations that must be considered when evaluating MPV. By understanding the significance of mean platelet volume within the broader context of hematologic assessment, healthcare professionals can develop a more informed approach to interpreting laboratory data and supporting evidence-based clinical decision-making.
Struggling to integrate patient care examples in your paper?
We’ll include accurate, practical illustrations for clarity.
The MPV Blood Test is an important laboratory assessment that evaluates the average size of circulating platelets in the bloodstream. MPV, which stands for mean platelet volume, is one of several platelet indices reported as part of a complete blood count and provides valuable information about platelet characteristics, platelet production, and overall hematologic function. Although healthcare providers often focus on the number of platelets present in circulation, platelet size can offer additional insight into how actively the bone marrow is producing platelets and how these cells are functioning within the body.
To understand why MPV matters, it is helpful to first appreciate that platelets are not static structures. They are continuously produced, released into circulation, utilized, and removed from the bloodstream. As a result, platelets vary in age, size, and activity. The MPV Blood Test measures these variations by calculating the average platelet size within a blood sample. This information can help clinicians better understand whether changes in platelet count are related to increased platelet destruction, increased platelet production, decreased platelet production, or other underlying physiological processes.
In many clinical situations, MPV provides information that cannot be obtained from a platelet count alone. For example, two patients may present with a similar low platelet count, yet their MPV values may differ significantly:
Patient A has a low platelet count and a high MPV.
Patient B has a low platelet count and a low MPV.
Although both patients have thrombocytopenia, the underlying causes may be very different. Patient A may be experiencing accelerated platelet destruction, prompting the bone marrow to release larger, younger platelets into circulation. Patient B may have impaired platelet production in the bone marrow, resulting in fewer and smaller platelets entering the bloodstream. In this way, MPV helps provide context that enhances interpretation of laboratory findings.
The clinical importance of MPV has expanded considerably over the past several decades. Research has demonstrated that MPV may be associated with inflammatory disorders, cardiovascular diseases, metabolic conditions, and various hematologic abnormalities. While the MPV Blood Test is not used independently to diagnose disease, it serves as a useful adjunct when evaluating platelet-related conditions and interpreting broader blood test results.
Several reasons explain why MPV is considered clinically significant:
It provides an assessment of plateletcharacteristics beyond simple platelet quantity.
It offers insight into platelet production in the bone marrow.
It helps evaluate platelet turnover and platelet activation.
It assists in distinguishing between different causes of abnormal platelet counts.
It contributes to the interpretation of a patient’s overall hematologic status.
It may support risk assessment in certain inflammatory and cardiovascular conditions.
For these reasons, the MPV Blood Test has become an increasingly valuable component of modern laboratory medicine.
Mean Platelet Volume Explained
Mean platelet volume refers to the average size of platelets circulating within the bloodstream. It is typically reported in femtoliters (fL), a unit used to measure extremely small cellular volumes. In simple terms, MPV reflects whether the platelets in circulation are generally larger, smaller, or within the expected normal range.
The concept of MPV is closely related to platelet maturation. Newly released platelets are often larger than older platelets because they contain more cellular material and metabolic components. As platelets age, they gradually become smaller before eventually being removed from circulation by the spleen and other components of the reticuloendothelial system.
Because platelet size changes throughout a platelet’s lifespan, the mean platelet volume measurement can provide indirect information about platelet age and production dynamics. Larger platelets often indicate active bone marrow compensation, while smaller platelets may suggest reduced platelet generation.
Several important principles help explain the role of mean platelet volume:
1. MPV Reflects Average Platelet Size
The primary purpose of MPV is the evaluation of platelet size within a blood sample. Rather than measuring individual platelets, laboratory analyzers calculate the average platelet volume present in circulation.
2. MPV and Platelet Count Are Closely Related
Researchers have long observed that MPV is inversely proportional to platelet count in many physiological situations. In other words, when platelet numbers decrease, the bone marrow may compensate by releasing larger platelets into circulation.
This relationship is often described as being inversely proportional to the platelet count because the body attempts to maintain an appropriate total platelet mass despite fluctuations in platelet numbers.
3. Larger Platelets Tend to Be More Active
Studies suggest that larger platelets may contain more granules and demonstrate greater biologic activity. As a result, an increase in mean platelet volume may sometimes reflect heightened platelet activity and an increased tendency toward blood clot formation.
4. MPV Provides Insight Into Platelet Turnover
When platelets are destroyed more rapidly than normal, the bone marrow often responds by increasing production. This accelerated platelet turnover frequently results in the release of larger platelets, leading to increased MPV values.
For example:
Immune thrombocytopenia may produce a low platelet count with elevated MPV.
Bone marrow suppression may produce a low platelet count with low MPV.
Acute inflammatory conditions may lead to changes in MPV levels due to altered platelet dynamics.
These examples demonstrate why clinicians frequently evaluate mean platelet volume and platelet count together when assessing hematologic abnormalities.
The Role of Platelets in Whole Blood
To understand the significance of the MPV Blood Test, it is essential to understand the function of platelets within whole blood.
Whole blood consists of several major components:
Plasma
Red blood cells
White blood cells
Platelets
Each component performs unique functions that contribute to maintaining normal physiological processes.
Platelets play a critical role in hemostasis, the process by which the body prevents excessive bleeding following vascular injury. When blood vessel damage occurs, platelets rapidly respond by adhering to the injured site, aggregating together, and initiating the formation of a temporary hemostatic plug.
The process typically involves several stages:
Vascular Injury
Damage to a blood vessel exposes underlying collagen and other substances that trigger platelet activation.
Platelet Adhesion
Platelets attach to the damaged vessel wall and begin accumulating at the site of injury.
Platelet Activation
Activated platelets release chemical mediators that recruit additional platelets and amplify the clotting response.
Platelet Aggregation
Multiple platelets bind together to create a platelet plug.
Blood Clot Stabilization
Coagulation factors strengthen the platelet plug and form a stable blood clot capable of preventing excessive blood loss.
Because platelets are directly involved in determining how well your blood clots, abnormalities in platelet size or function can significantly affect hemostasis.
Platelets also participate in processes beyond clotting. Emerging research has demonstrated their involvement in:
Inflammation
Immune regulation
Tissue repair
Wound healing
Vascular health
These expanded roles help explain why alterations in MPV have been linked to numerous disease processes.
An abnormal platelet population may influence both clotting and inflammatory pathways. Consequently, evaluation of platelet characteristics through the MPV Blood Test can provide clinically meaningful information about overall health status.
Why MPV Is Included in a Blood Test
The MPV Blood Test is commonly included in a complete blood count because it provides information that complements platelet count measurements and contributes to a more complete hematologic assessment.
A healthcare provider may order an MPV evaluation whenever a patient undergoes a CBC, particularly when investigating:
Bleeding disorders
Easy bruising
Thrombotic disorders
Suspected bone marrow disease
Inflammatory conditions
Cardiovascular disease risk factors
Unexplained abnormalities in platelet count
The test is typically performed using a simple blood draw, making it a convenient and cost-effective source of clinical information.
Several reasons explain why MPV remains a valuable component of routine blood work:
Identifying Changes in Platelet Production
The MPV Blood Test can help determine whether the bone marrow is actively responding to platelet loss or whether platelet production is impaired.
Supporting Evaluation of Blood Disorders
MPV may assist in distinguishing between different causes of thrombocytopenia and other hematologic conditions.
Providing Additional Context for Platelet Counts
A platelet count may identify whether platelet numbers are high or low, but MPV provides insight into platelet characteristics that influence interpretation.
Assessing Platelet Activation
An indicator of platelet activation, MPV may offer information regarding inflammatory and thrombotic processes occurring within the body.
Enhancing Clinical Decision-Making
Although the MPV test alone can’t diagnose a disease, combining MPV with other laboratory findings often improves clinical assessment.
Importantly, healthcare providers do not interpret MPV in isolation. Instead, the value is evaluated alongside:
Platelet count
Other platelet indices
Red blood cell parameters
White blood cell findings
Clinical symptoms
Medical history
This integrated approach helps ensure accurate interpretation of MPV blood test results.
Ultimately, the inclusion of MPV in a blood test reflects its value as a marker of platelet biology and hematologic function. By providing insight into platelet size, platelet turnover, and platelet production, the MPV Blood Test contributes to a more complete understanding of patient health and supports informed clinical evaluation.
How the MPV Blood Test Works
The MPV Blood Test is a laboratory measurement used to determine the average size of platelets circulating in the bloodstream. While many people are familiar with laboratory values that measure the number of cells present in blood, MPV focuses on a different characteristic: platelet volume. By evaluating the average platelet size, healthcare providers gain insight into platelet production, platelet turnover, and overall platelet health.
The MPV Blood Test is performed using a blood sample obtained through a simple blood draw. Once collected, the sample is sent to a laboratory where automated hematology analyzers evaluate the cellular components of whole blood. These analyzers calculate numerous parameters simultaneously, including red blood cell counts, white blood cells, platelet counts, and various platelet measurements.
Unlike a test that directly assesses platelet function, the MPV Blood Test focuses on platelet morphology, specifically the average volume of platelets circulating in the bloodstream. Because younger platelets are generally larger and older platelets are typically smaller, MPV can provide indirect information about how actively the bone marrow is producing and releasing platelets.
The process behind the test is based on an important biological principle: platelet size often reflects platelet age and activity. When platelet destruction increases, the body frequently compensates by accelerating platelet production in the bone marrow. This leads to the release of larger, younger platelets into circulation, potentially causing an increase in MPV. Conversely, conditions associated with impaired platelet production may result in smaller platelets and lower MPV values.
This relationship is one reason the MPV Blood Test is frequently used to complement platelet count measurements. Two patients may have similar platelet counts but very different MPV values, suggesting different underlying mechanisms affecting platelet production and survival.
For example:
Clinical Scenario
Platelet Count
MPV Finding
Possible Interpretation
Increased platelet destruction
Low
High
Bone marrow compensating with larger young platelets
Bone marrow suppression
Low
Low
Reduced platelet production
Reactive platelet response
Normal
Elevated
Increased platelet turnover or activation
Stable platelet production
Normal
Normal
Balanced platelet production and destruction
These examples illustrate how the MPV Blood Test can help clinicians better understand what is happening behind an abnormal platelet count.
Another important point is that MPV values are influenced by dynamic biological processes rather than remaining fixed over time. Platelet production, inflammation, medications, infections, and certain chronic diseases may all influence MPV levels. Therefore, healthcare providers often evaluate trends rather than relying solely on a single test value.
Because the MPV Blood Test is relatively inexpensive, readily available, and included in routine laboratory panels, it serves as a practical tool for assessing platelet characteristics and supporting clinical decision-making.
MPV as Part of a Complete Blood Count
The MPV Blood Test is most commonly performed as part of a complete blood count (CBC), one of the most frequently ordered laboratory investigations in healthcare. The CBC provides a broad overview of hematologic health by measuring multiple components of blood, including:
Red blood cells
Hemoglobin
Hematocrit
White blood cells
Platelets
Various cellular indices
Within this panel, MPV is categorized as one of the platelet indices, a group of measurements designed to provide additional information about platelet characteristics beyond simple platelet quantity.
The CBC allows clinicians to assess multiple blood components simultaneously because abnormalities in one cell line often affect the interpretation of another. This is why MPV is rarely interpreted alone. Instead, it is evaluated alongside other CBC findings to provide a more complete understanding of a patient’s hematologic status.
Several platelet-related measurements may appear within a CBC report:
Platelet Count
Measures the total number of platelets circulating in the bloodstream.
Mean Platelet Volume
Measures average platelet size.
Platelet Distribution Width
Evaluates variability in platelet size.
Other Platelet Indices
Provide additional information regarding platelet morphology and volume distribution.
Together, these measurements contribute to a more comprehensive assessment of platelet health.
For instance, a clinician evaluating a patient with unexplained bruising may review:
Platelet count
MPV
Platelet distribution width
White blood cell count
Red blood cell parameters
This integrated approach often provides more useful information than evaluating a single value independently.
The CBC also helps identify relationships between MPV and other blood components. Changes in platelet measurements may occur alongside abnormalities involving:
For this reason, the MPV Blood Test serves as one component of a broader diagnostic framework rather than a standalone assessment.
How Laboratories Measure Platelet Size
Modern laboratories use sophisticated automated analyzers to perform the mean platelet volume measurement. These instruments rapidly evaluate thousands of blood cells within seconds, generating highly detailed information about cellular characteristics.
The process begins after blood is collected in a specialized tube containing an anticoagulant. This prevents clot formation and preserves cellular integrity until analysis occurs.
The sample then passes through the analyzer, which uses one or more technologies to evaluate platelets:
Electrical Impedance Method
One of the most common approaches involves electrical impedance. As individual platelets pass through a tiny aperture, they create electrical changes proportional to their size. The analyzer records these changes and calculates the mean value of MPV.
Optical Light Scatter Technology
Some analyzers use laser-based systems that evaluate how platelets scatter light. Larger platelets scatter light differently than smaller platelets, allowing accurate estimation of platelet volume.
Combined Analytical Techniques
Many modern instruments combine multiple technologies to improve measurement accuracy and reduce potential errors.
After thousands of platelets have been analyzed, the instrument calculates:
Average platelet size
Platelet count
Platelet distribution width
Other platelet indices
This information becomes part of the patient’s laboratory report.
The laboratory’s evaluation of platelet size depends on analyzing a large number of platelets rather than examining individual cells. This helps produce a representative estimate of platelet characteristics throughout the bloodstream.
However, several factors can also affect MPV measurements:
Specimen Storage Time
Platelets may swell after prolonged storage, potentially influencing results.
Type of Anticoagulant Used
Different collection tubes may affect platelet volume measurements.
Analyzer Technology
Different manufacturers may use varying methodologies, producing slight differences in reported values.
Sample Quality
Clotted or improperly collected specimens may affect accuracy.
Because of these factors, clinicians must consider laboratory context when interpreting MPV values.
Understanding Normal MPV Ranges
One of the most common questions regarding the MPV Blood Test is what constitutes a normal result. Although exact values vary among laboratories, most reference ranges fall between approximately 7.5 and 12.0 femtoliters (fL).
This range represents the expected average platelet size in healthy individuals. Values within this range generally suggest balanced platelet production and turnover, although interpretation always depends on the broader clinical picture.
Several important points should be understood regarding the normal range for MPV:
Normal Does Not Always Mean Healthy
A patient may have a normal MPV yet still have an underlying disorder affecting platelet function or platelet count.
Abnormal Does Not Always Mean Disease
An isolated abnormal value does not automatically indicate a serious medical condition.
Reference Ranges Differ
Laboratories may establish slightly different reference intervals based on equipment and testing methodology.
Trends Are Often More Important Than Single Values
Repeated measurements may provide more useful information than a single result obtained at one point in time.
MPV findings are commonly categorized into three general groups:
Normal MPV
A normal MPV suggests that platelet production and platelet destruction are relatively balanced.
High MPV
A high MPV indicates that circulating platelets are larger than average. This may occur because of:
Increased platelet turnover
Increased platelet production
Platelet activation
Certain inflammatory conditions
Some cardiovascular disorders
In these situations, MPV is high because younger platelets entering circulation tend to be larger.
Low MPV
A low MPV indicates smaller-than-average platelets. Potential explanations include:
Reduced platelet production
Bone marrow suppression
Certain chronic illnesses
Some medication effects
In these cases, low results may reflect decreased production of new platelets.
It is important to remember that high or low MPV values must always be interpreted alongside platelet count and other laboratory findings. An isolated value rarely provides sufficient information for diagnosis.
For example:
A low platelet count with elevated MPV may suggest increased platelet destruction.
A low platelet count with low MPV may suggest decreased platelet production.
A normal platelet count with abnormal MPV may indicate subtle changes in platelet dynamics that require further evaluation.
Ultimately, the purpose of understanding MPV ranges is not simply to determine whether a value falls inside or outside a reference interval. Rather, it is to place the result within the broader context of platelet biology, overall blood cell health, and the patient’s clinical condition. When interpreted appropriately, the MPV Blood Testcan help healthcare providers better understand platelet behavior, support diagnostic investigations, and contribute to more informed patient care decisions.
Platelet Count and MPV: Understanding the Relationship
The MPV Blood Test provides valuable information about platelet characteristics, but its greatest clinical usefulness often emerges when it is interpreted alongside the platelet count. While the platelet count measures the number of platelets circulating in the bloodstream, MPV evaluates their average size. Together, these two measurements offer a more complete picture of platelet health, platelet production, and the body’s ability to maintain normal hemostatic function.
A common misconception is that platelet count alone is sufficient to assess platelet status. In reality, platelet quantity and platelet size often provide different types of information. A patient may have a normal platelet count but abnormal platelet characteristics, or conversely, an abnormal platelet count with platelets that appear structurally normal. Evaluating both values together helps clinicians understand whether changes are occurring because of altered platelet production, increased platelet destruction, accelerated platelet turnover, or other underlying conditions.
One important concept in hematology is that MPV and platelet count frequently demonstrate an inverse relationship. In many physiological and pathological states, MPV is inversely proportional to platelet count. This occurs because the body attempts to maintain a relatively stable total platelet mass. When platelet numbers decrease, the bone marrow often compensates by releasing larger, younger platelets into circulation. Conversely, when platelet numbers increase, platelets may be smaller on average.
This relationship explains why healthcare providers rarely interpret MPV independently. Instead, they examine both measurements together to gain insight into what may be happening within the bone marrow and throughout the circulatory system.
For example:
A low platelet count accompanied by large platelets may suggest active platelet destruction and compensatory bone marrow activity.
A low platelet count accompanied by small platelets may indicate impaired platelet production.
An elevated platelet count with smaller platelets may reflect certain reactive conditions.
A normal platelet count with abnormal MPV may point toward early changes in platelet dynamics that warrant monitoring.
Understanding this relationship is essential because it allows clinicians to move beyond simply identifying abnormal laboratory values and begin exploring the physiological processes responsible for those abnormalities.
Another reason this relationship matters is that platelets play a critical role in maintaining normal clotting function. Changes in platelet number and size can influence how effectively platelets participate in blood clot formation and vascular repair. Consequently, evaluating platelet count together with MPV can provide important information regarding bleeding risk, thrombotic risk, and overall hematologic health.
Differences Between Platelet Count and Mean Platelet Volume
Although platelet count and mean platelet volume are closely related, they measure entirely different aspects of platelet biology.
Platelet Count: Measuring Quantity
The platelet count represents the total number of platelets present in a specified volume of blood. It answers the question:
“How many platelets are circulating in the bloodstream?”
This measurement helps determine whether platelet numbers are:
Within the expected range
Elevated
Reduced
A normal platelet count generally indicates that an adequate number of platelets are available to support normal clotting processes. However, platelet count alone provides little information about platelet maturity, platelet size, or platelet function.
Mean Platelet Volume: Measuring Size
The mean platelet volume component of the MPV Blood Test answers a different question:
“How large are the platelets circulating in the bloodstream?”
Rather than measuring quantity, MPV evaluates the average platelet size of circulating platelets.
Because newly produced platelets are generally larger than older platelets, MPV often reflects the rate of platelet production and turnover occurring within the bone marrow.
In simple terms:
Measurement
What It Evaluates
Clinical Significance
Platelet Count
Number of platelets
Assesses platelet quantity
MPV
Average platelet size
Assesses platelet characteristics and production patterns
Why Both Measurements Are Needed
A platelet count may reveal that platelet numbers are abnormal, but it does not explain why. MPV helps provide that additional context.
For example:
Scenario 1: Low Platelet Count With High MPV
The bone marrow may be responding appropriately by increasing production and releasing larger platelets.
Scenario 2: Low Platelet Count With Low MPV
The bone marrow may not be producing sufficient platelets, suggesting possible production failure.
Scenario 3: Normal Platelet Count With Elevated MPV
The patient may have increased platelet activity despite maintaining a normal number of circulating platelets.
These examples demonstrate why the MPV Blood Test measures an important aspect of platelet biology that cannot be determined through platelet count alone.
Another useful concept is that platelet count evaluates quantity, whereas MPV contributes to the evaluation of platelet size and production dynamics. Together, these measurements provide a more complete assessment of platelet health.
Importance of MPV in Blood Test
Common Platelet Count and MPV Patterns
When interpreting MPV blood test results, clinicians often recognize recurring patterns that can provide clues regarding underlying physiological or pathological processes.
Although laboratory values must always be interpreted in clinical context, several common combinations are frequently encountered.
Normal Platelet Count and Normal MPV
This pattern typically suggests balanced platelet production and destruction.
Characteristics include:
Adequate platelet production
Normal platelet turnover
Stable bone marrow activity
No obvious platelet-related abnormality
In many healthy individuals, both values remain within the expected normal range.
Low Platelet Count and High MPV
This pattern often indicates increased peripheral platelet destruction with compensatory bone marrow activity.
In these situations:
Platelets are being destroyed or consumed rapidly.
The bone marrow responds by increasing production.
Larger, younger platelets enter circulation.
MPV rises as platelet size increases.
Examples include:
Immune thrombocytopenia
Recovery following acute blood loss
Certain inflammatory conditions
Here, the increase in mean platelet volume reflects the body’s attempt to replace lost platelets.
Low Platelet Count and Low MPV
This combination often suggests impaired platelet production.
Possible mechanisms include:
Bone marrow suppression
Bone marrow infiltration
Certain chemotherapy treatments
Aplastic anemia
Advanced marrow disorders
In such cases, mean your bone marrow may not be producing sufficient new platelets, resulting in both reduced platelet numbers and smaller average platelet size.
A low MPV test result in conjunction with thrombocytopenia often warrants further investigation into bone marrow function.
High Platelet Count and Low MPV
This pattern may occur when platelet production increases but the newly produced platelets remain relatively small.
Possible causes include:
Chronic inflammatory conditions
Iron deficiency
Certain reactive thrombocytosis states
The clinical significance varies depending on accompanying symptoms and laboratory findings.
High Platelet Count and High MPV
This pattern may indicate substantial platelet activation or accelerated platelet production.
Potential explanations include:
Myeloproliferative disorders
Active inflammatory conditions
Increased platelet turnover
Certain cardiovascular disorders
An elevated mean platelet volume combined with an elevated platelet count often requires careful clinical assessment because larger platelets may possess greater prothrombotic potential.
Normal Platelet Count With Abnormal MPV
Sometimes platelet numbers remain normal despite changes in platelet size.
This pattern can occur when:
Bone marrow compensation is occurring.
Early disease processes are developing.
Platelet activation is increased.
Underlying inflammatory conditions are present.
In such situations, MPV may provide an early clue that additional evaluation is warranted.
What These Results Mean Clinically
The interpretation of platelet count and MPV extends beyond laboratory analysis. These measurements provide meaningful clinical information that can help guide diagnosis, monitoring, and patient management.
One of the most important clinical applications involves distinguishing between increased platelet destruction and decreased platelet production. Both conditions may present with thrombocytopenia, but the MPV often differs significantly.
For example:
Increased Platelet Destruction
When platelets are destroyed prematurely:
The bone marrow compensates.
Increased platelet production occurs.
Larger platelets enter circulation.
MPV rises.
This results in a low platelet count with elevated MPV.
Decreased Platelet Production
When bone marrow activity is impaired:
Fewer platelets are produced.
Smaller platelets may predominate.
MPV decreases.
This results in a low platelet count with low MPV.
The ability to distinguish between these mechanisms can significantly influence diagnostic decision-making and treatment planning.
Another important clinical consideration involves thrombotic risk. Studies have suggested that larger platelets may demonstrate greater metabolic and functional activity. Consequently, some research has reported that mean platelet volume is associated with cardiovascular events and other conditions involving abnormal clot formation.
Because larger platelets contain more granules and biochemical mediators, an increased mean platelet volume may sometimes indicate a higher risk of blood clot-related complications. However, MPV should never be used independently to predict risk.
Clinicians must also remember that abnormal MPV values do not automatically indicate disease. Numerous factors can influence MPV, including:
Age
Medications
Acute illness
Chronic inflammation
Laboratory methodology
Timing of specimen analysis
For this reason, interpretation always requires correlation with:
Clinical history
Physical examination findings
Additional laboratory data
Imaging studies when appropriate
The most important principle is that platelet count and MPV complement one another. Neither measurement provides a complete picture independently, but together they offer valuable insight into platelet biology, bone marrow function, and hematologic health. By evaluating both parameters simultaneously, healthcare providers can better understand the mechanisms driving abnormal findings and make more informed clinical decisions regarding patient assessment and management.
High MPV: Causes and Clinical Significance
A high MPV Blood Test result indicates that the circulating platelets in the bloodstream are, on average, larger than expected. This finding is clinically significant because platelet size is closely linked to platelet production, platelet turnover, and platelet activity. Larger platelets are typically younger, more metabolically active, and contain more intracellular granules compared to smaller, older platelets. As a result, an increase in MPV is often interpreted as a reflection of increased platelet production or increased platelet activation within the body.
In clinical practice, high MPV is not interpreted in isolation. Instead, it is evaluated alongside platelet count, other platelet indices, and the patient’s overall clinical picture. This is because elevated mean platelet volume can arise from a variety of physiological and pathological processes, and the underlying cause determines its clinical significance.
What High MPV Indicates
A high MPV Blood Test generally indicates one or more of the following underlying mechanisms:
1. Increased Platelet Production
When platelets are being destroyed or consumed at an accelerated rate, the bone marrow responds by increasing platelet production. As new platelets are released into circulation, they tend to be larger in size, leading to an elevated MPV.
This is often seen in conditions where the body is attempting to compensate for platelet loss.
2. Increased Platelet Turnover
Platelet turnover refers to the rate at which platelets are produced and removed from circulation. A high turnover rate means that older platelets are being replaced more rapidly than normal. This process results in a higher proportion of young, large platelets, which increases the mean platelet volume.
3. Enhanced Platelet Activity
Larger platelets are generally more reactive and contain more dense granules and procoagulant substances. Therefore, a high MPV may also indicate increased platelet activation and a heightened tendency toward blood clot formation.
4. Compensatory Bone Marrow Response
When the body detects a reduced platelet lifespan, the bone marrow increases production to maintain adequate hemostasis. This compensatory response results in the release of larger platelets into circulation, contributing to elevated MPV levels.
Conditions Associated With Elevated Mean Platelet Volume
A variety of clinical conditions may be associated with elevated mean platelet volume, although MPV alone cannot confirm any diagnosis. Instead, it serves as a supportive marker that must be interpreted in context.
1. Immune-Mediated Platelet Destruction
Conditions such as immune thrombocytopenia involve the immune system attacking and destroying platelets. In response:
Platelet count decreases
Bone marrow increases production
Larger platelets are released
MPV becomes elevated
This pattern is a classic example of high MPV associated with increased platelet turnover.
2. Inflammatory Conditions
Chronic and acute inflammatory states can influence platelet activation and production. Inflammation stimulates cytokines that affect the bone marrow, leading to changes in mean platelet volume levels.
Examples include:
Rheumatoid arthritis
Inflammatory bowel disease
Systemic infections
In these conditions, increased MPV may reflect heightened platelet activation and systemic inflammatory activity.
3. Cardiovascular Disease
Research has demonstrated that mean platelet volume is associated with cardiovascular conditions such as:
Coronary artery disease
Myocardial infarction
Stroke risk
Larger platelets are more active and may contribute to thrombosis. Therefore, a high MPV may be considered a marker of increased platelet reactivity in cardiovascular pathology.
4. Metabolic Disorders
Conditions such as diabetes mellitus and metabolic syndrome have been linked to elevated MPV values. In these disorders:
Chronic inflammation is present
Platelet activation increases
Increase in mean platelet volume may occur over time
This relationship highlights the connection between metabolic health and platelet function.
5. Post-Bleeding or Recovery States
Following acute blood loss or platelet destruction, the bone marrow responds by increasing production. This leads to:
Release of younger, larger platelets
Temporary elevation in MPV
Gradual normalization as balance is restored
High MPV and Platelet Production
The relationship between high MPV and platelet production is one of the most important concepts in understanding platelet biology. Platelets are produced in the bone marrow from large precursor cells called megakaryocytes. When platelet demand increases, these cells accelerate production and release platelets into circulation more rapidly.
Bone Marrow Response and Platelet Size
When the bone marrow is stimulated to increase production:
Platelets are released earlier in their maturation process
These platelets are larger in size
They contain more cytoplasmic material and granules
MPV increases as a result
This is why platelet production in the bone marrow is closely linked to MPV values.
Example of Compensatory Production
Consider a patient with immune-mediated platelet destruction:
Platelet count: Low
MPV: High
This pattern suggests that the bone marrow is actively compensating for peripheral platelet loss by producing and releasing larger, immature platelets. In this case, the MPV Blood Test measures an important adaptive response rather than a primary bone marrow failure.
Increased Platelet Production and Clinical Interpretation
When interpreting a high MPV Blood Test, clinicians often assess whether the elevated value reflects:
A physiological compensatory response
A reactive inflammatory process
A cardiovascular risk marker
A hematologic disorder
The context is essential because high or low MPV values do not function as standalone diagnostic indicators.
MPV as an Indicator of Platelet Activation
In addition to production, a high MPV may also serve as an indicator of platelet activation. Activated platelets are more likely to participate in clot formation and vascular repair processes. Therefore, elevated MPV values may reflect a state of increased hemostatic activity within the circulatory system.
Clinical Example for Better Understanding
A patient presents with unexplained bruising and a low platelet count. Laboratory results show:
Platelet count: 85,000/µL (low)
MPV: Elevated
White blood cells: Normal
Red blood cells: Normal
Interpretation:
The low platelet count suggests thrombocytopenia.
The elevated MPV suggests that the bone marrow is producing larger, younger platelets.
The most likely explanation is increased peripheral platelet destruction rather than decreased production.
This example demonstrates how the MPV Blood Test results help differentiate between underlying causes of thrombocytopenia and guide further evaluation.
Low MPV: Causes and Clinical Significance
A low MPV Blood Test result indicates that the circulating platelets are, on average, smaller than expected. This finding is clinically important because platelet size reflects underlying processes occurring in the bone marrow, particularly platelet production, maturation, and release into the bloodstream. When mean platelet volume is reduced, it often suggests that the bone marrow is producing fewer new platelets or that platelet formation is impaired.
Unlike high MPV, which is often associated with increased platelet turnover or compensatory production, a low MPV is more commonly linked to reduced platelet output or abnormal megakaryocyte activity. However, as with all platelet indices, interpretation must be made in conjunction with platelet count, clinical findings, and other blood test results.
A key concept in understanding low MPV is that smaller platelets are typically older or less active platelets. This may reflect decreased release of young platelets from the bone marrow or a disruption in normal platelet maturation.
What Low MPV Indicates
A low MPV Blood Test generally suggests one or more of the following physiological or pathological processes:
1. Decreased Platelet Production
The most clinically significant interpretation of low MPV is reduced platelet production in the bone marrow. When the bone marrow is not producing sufficient platelets, fewer new (and larger) platelets enter circulation. As a result, the circulating population becomes dominated by older, smaller platelets, leading to reduced mean platelet volume.
2. Impaired Megakaryocyte Function
Platelets are produced by megakaryocytes in the bone marrow. If these precursor cells are damaged or dysfunctional, platelet production may be inefficient. This leads to the release of smaller platelets and a lower MPV.
3. Reduced Platelet Turnover
When platelet destruction and replacement are both reduced, the circulating platelet population may become older on average. This decreases the proportion of young, large platelets, contributing to a lower MPV.
4. Bone Marrow Suppression
Conditions that suppress bone marrow activity can lead to both decreased platelet count and low MPV. In these cases, the bone marrow is unable to maintain normal platelet production, resulting in fewer and smaller platelets.
Conditions Associated With Reduced Mean Platelet Volume
A low MPV Blood Test may be associated with several clinical conditions. It is important to emphasize that MPV alone does not diagnose these conditions but may provide supportive information when interpreted alongside other findings such as low platelet count, anemia, or abnormal white blood cell counts.
1. Bone Marrow Failure Syndromes
Disorders that affect bone marrow function are among the most important causes of low MPV. These include:
Aplastic anemia
Myelodysplastic syndromes
Bone marrow infiltration (e.g., malignancy)
In these conditions, impaired marrow function leads to reduced platelet production, resulting in both low platelet count and decreased MPV.
2. Chemotherapy or Radiation Therapy Effects
Cancer treatments such as chemotherapy and radiation can suppress bone marrow activity. This suppression affects all blood cell lines, including:
Red blood cells
White blood cells
Platelets
As a result, patients may present with:
Low platelet count
Low MPV
Other cytopenias
This pattern reflects generalized bone marrow suppression rather than isolated platelet dysfunction.
3. Chronic Systemic Illness
Long-standing systemic diseases may also affect platelet production. These conditions can alter hematopoietic activity and reduce the release of young platelets into circulation. In such cases, low MPV test result may be part of a broader pattern of hematologic changes.
4. Nutritional Deficiencies
Deficiencies in essential nutrients required for hematopoiesis may also contribute to reduced MPV. These include deficiencies affecting bone marrow function and overall blood cell production. When platelet synthesis is impaired, fewer large platelets are released into circulation.
Low MPV and Decreased Platelet Production
The relationship between low MPV and decreased platelet production is central to interpreting this laboratory finding. Platelet production begins in the bone marrow, where megakaryocytes undergo fragmentation to release platelets into the bloodstream. Under normal conditions, this process produces a mixture of platelet sizes, including newly formed larger platelets.
When platelet production in the bone marrow is reduced, several changes occur:
1. Reduced Release of Young Platelets
With decreased marrow activity, fewer young platelets enter circulation. Since younger platelets are typically larger, their reduction results in a lower average platelet size.
2. Predominance of Older Platelets
The circulating platelet population becomes dominated by older, smaller platelets that remain in the bloodstream longer. This shifts the average downward, resulting in a low MPV.
3. Impaired Hematologic Balance
Normal hemostasis depends on a balance between platelet production and destruction. When production is impaired, the body may struggle to maintain adequate blood clot formation, especially if platelet count is also reduced.
Example Clinical Scenario
A patient undergoing chemotherapy presents with fatigue and easy bruising. Laboratory findings show:
Platelet count: Low
MPV: Low
White blood cells: Low
Red blood cells: Low
Interpretation:
The combination of low MPV and low platelet count suggests reduced platelet production rather than increased destruction.
The involvement of multiple blood cell lines indicates generalized bone marrow suppression.
The findings are consistent with chemotherapy-induced myelosuppression.
This example highlights how a low MPV Blood Test provides important diagnostic clues when interpreted alongside other hematologic parameters.
Interpreting MPV Alongside Other Blood Test Results
The interpretation of the MPV Blood Test becomes most clinically meaningful when it is evaluated in combination with other parameters in a complete blood count. Although mean platelet volume provides insight into platelet size and platelet production, it does not exist in isolation. Instead, it interacts with multiple components of whole blood, including red blood cells, white blood cells, and other platelet indices.
A key principle in hematology is that blood cell lines often respond together to physiological stress, disease processes, or bone marrow dysfunction. Therefore, interpreting MPV alongside other blood test results allows clinicians to identify patterns that would otherwise be missed if each parameter were considered separately.
For example, a patient with abnormal MPV may have:
Normal platelet count but elevated MPV
Low MPV with anemia
Elevated MPV with increased white blood cells
Each pattern provides different clues about underlying disease mechanisms, such as inflammation, bone marrow activity, or systemic illness.
Because of this complexity, the MPV Blood Test measures are best understood as part of an integrated hematologic assessment rather than a standalone value.
MPV and Red Blood Cells
The relationship between MPV and red blood cells is important because both cell lines originate from the bone marrow. Changes in one cell line may provide indirect clues about the health of the marrow environment and overall hematopoietic activity.
1. Shared Bone Marrow Origin
Both platelets and red blood cells are produced in the bone marrow. When bone marrow function is disrupted, multiple cell lines may be affected simultaneously. For example:
Reduced platelet production may result in low MPV
Reduced red blood cell production may lead to anemia
When these changes occur together, they may indicate a broader problem affecting blood cell production.
2. MPV and Anemia
In certain types of anemia, MPV may change depending on the underlying cause:
Iron deficiency anemia may be associated with increased platelet production and sometimes elevated MPV
Bone marrow suppression-related anemia may present with low MPV due to reduced production of all blood cells
This demonstrates how mean platelet volume and platelet behavior can vary depending on the hematologic environment.
3. Clinical Example
A patient presents with fatigue and pallor. Laboratory findings show:
Low hemoglobin (anemia)
Low MPV
Low platelet count
Interpretation:
The combination suggests reduced bone marrow activity
Both red blood cell and platelet production are impaired
Further evaluation for bone marrow disorders may be needed
This example highlights how MPV and red blood cell findings together can reveal systemic hematopoietic dysfunction.
MPV and Other Blood Cell Findings
The interpretation of the MPV Blood Test also requires consideration of white blood cells and broader hematologic patterns. White blood cells play a central role in immune response, inflammation, and infection, and their relationship with MPV can provide valuable diagnostic clues.
1. MPV and White Blood Cell Counts
Changes in white blood cells alongside MPV may suggest:
Infection or inflammation affecting platelet activation
Elevated white blood cells with increased MPV may indicate an inflammatory or infectious process where platelet activation is enhanced
Low white blood cells with low MPV may suggest bone marrow suppression affecting multiple blood cell lines
2. Inflammatory Response Patterns
Inflammation can affect both platelet production and activation. In such cases:
MPV may increase due to enhanced platelet turnover
White blood cell counts may also rise
Platelet function may become more active
This pattern reflects the body’s coordinated response to injury or infection.
3. Bone Marrow Disorders
In more serious conditions such as bone marrow disorders:
MPV may be low due to reduced platelet production
White blood cells may also be abnormal (either low or high depending on the disorder)
Red blood cells may be affected simultaneously
These multi-line abnormalities strongly suggest a central hematopoietic issue rather than isolated platelet dysfunction.
The Importance of Evaluating Whole Blood Results
A central principle in interpreting the MPV Blood Test is that no single blood parameter should be interpreted in isolation. Instead, clinicians rely on the assessment of whole blood to understand the full picture of hematologic health.
1. Integrated Hematologic Assessment
A complete blood count provides a comprehensive overview of:
Platelets (count, MPV, and indices)
Red blood cells (hemoglobin, hematocrit, indices)
White blood cells (total count and differential)
Together, these values allow for a more accurate interpretation of disease processes affecting the blood.
2. Identifying Patterns Rather Than Isolated Abnormalities
One of the most important clinical skills in hematology is pattern recognition. For example:
Isolated high MPV with normal other values may suggest early platelet activation
Low MPV with pancytopenia suggests bone marrow suppression
High MPV with normal platelet count may reflect reactive or inflammatory changes
These patterns are more meaningful than a single abnormal result.
3. Clinical Decision-Making and Patient Management
Evaluating whole blood results helps clinicians:
Determine whether abnormalities are isolated or systemic
Decide if further diagnostic testing is required
Monitor disease progression or treatment response
Assess risk of bleeding or thrombosis
For instance, a patient with abnormal MPV and abnormal white blood cells may require further investigation for infection, inflammation, or hematologic disease, whereas isolated MPV changes may only require monitoring.
4. Example of Whole Blood Interpretation
A patient presents with fever and fatigue. Laboratory results show:
Elevated white blood cells
Increased MPV
Normal red blood cells
Slightly reduced platelet count
Interpretation:
The elevated white blood cells suggest infection or inflammation
Increased MPV indicates platelet activation and increased turnover
The mild platelet reduction may reflect consumption during inflammatory response
This integrated interpretation of whole blood results provides a clearer clinical picture than analyzing MPV alone.
Additional Tests Used to Evaluate Abnormal MPV
When the MPV Blood Test shows abnormal results, it is rarely used as the final step in evaluation. Instead, abnormal mean platelet volume findings often prompt further diagnostic investigations to better understand platelet morphology, platelet production, and overall hematologic status. Because MPV reflects platelet size rather than platelet function directly, additional tests are essential to confirm whether changes in MPV represent a benign variation or an underlying blood disorder.
In clinical practice, abnormal MPV is typically interpreted alongside the platelet count, other platelet indices, and the patient’s full blood test results. When inconsistencies or unexplained findings are present, clinicians may order more specialized hematologic tests to further evaluate platelet size, platelet function, and bone marrow activity.
These additional tests help answer important clinical questions such as:
Are the platelets morphologically normal?
Is there evidence of abnormal platelet production?
Is there platelet destruction occurring in circulation?
Are other blood cell lines affected?
Peripheral Blood Smear Examination
One of the most important follow-up tests for abnormal MPV is the blood smear MPV blood test, more formally known as a peripheral blood smear examination. This test involves placing a drop of blood on a glass slide, staining it, and examining it under a microscope.
1. Direct Visualization of Platelets
Unlike automated analyzers used in the MPV Blood Test, a peripheral smear allows for direct visual assessment of platelets. This helps clinicians evaluate:
Platelet size and shape
Platelet distribution
Presence of giant or unusually small platelets
Platelet clumping or aggregation
This visual assessment provides confirmation of whether abnormal MPV values reflect true biological changes or potential laboratory artifacts.
2. Confirmation of Automated MPV Results
Automated analyzers can sometimes produce misleading MPV values due to:
Platelet swelling after blood collection
Sample handling delays
Instrument variability
A peripheral smear helps validate whether the reported mean platelet volume measurement accurately reflects true platelet morphology.
Small hypoplastic platelets (suggesting reduced production)
Platelet fragmentation (suggesting destruction)
These findings help determine whether high MPV or low MPV is related to production, destruction, or bone marrow dysfunction.
4. Evaluation of Other Blood Cells
A peripheral smear also allows simultaneous assessment of:
Red blood cells (shape, size, and hemoglobin content)
White blood cells (morphology and maturity)
This makes it an important tool for evaluating whole blood abnormalities beyond just platelets.
Platelet Distribution Width and Other Platelet Indices
Another important group of tests used to evaluate abnormal MPV includes platelet distribution width (PDW) and related platelet indices. These measurements provide additional detail about platelet variability and production dynamics.
1. Platelet Distribution Width (PDW)
PDW measures the variability in platelet size within a blood sample. While MPV reflects the average size, PDW evaluates how much variation exists among individual platelets.
A high PDW indicates significant variation in platelet size
A low PDW indicates more uniform platelet size
2. Relationship Between MPV and PDW
When interpreted together, MPV and PDW provide a more detailed understanding of platelet biology:
High MPV + High PDW → Suggests active platelet production and turnover, often seen in conditions with increased platelet destruction or activation
Low MPV + Low PDW → Suggests reduced and uniform platelet production, often associated with bone marrow suppression
Normal MPV + High PDW → May indicate early or mild platelet activation changes
This combined interpretation helps clinicians understand whether changes in platelet characteristics are uniform or heterogeneous.
3. Other Platelet Indices
Additional platelet-related measurements may include:
Platelet large cell ratio (P-LCR)
Total platelet mass indicators
Platelet volume distribution metrics
These indices collectively provide deeper insight into platelet production, maturation, and release into circulation.
When Further Testing Is Needed
Further investigation beyond the MPV Blood Test is typically required when results are abnormal, inconsistent, or clinically unexplained. The decision to pursue additional testing depends on several factors, including severity of abnormalities, associated symptoms, and other laboratory findings.
1. Persistently Abnormal MPV Results
Repeated abnormal MPV values may indicate an underlying condition rather than a transient variation. For example:
Persistently high MPV may suggest ongoing platelet activation or chronic inflammatory disease
Persistently low MPV may suggest bone marrow suppression or impaired platelet production
2. Abnormal Platelet Count with MPV Changes
Further testing is especially important when MPV abnormalities are accompanied by:
Low platelet count (thrombocytopenia)
Increased platelet count (thrombocytosis)
Unexpected changes in platelet production
These combinations may indicate disorders such as immune-mediated platelet destruction, myeloproliferative conditions, or bone marrow dysfunction.
3. Presence of Abnormal Blood Cell Findings
When MPV abnormalities occur alongside changes in other blood cell lines, such as:
Anemia (red blood cell abnormalities)
Leukocytosis or leukopenia (white blood cell changes)
this may suggest a systemic hematologic disorder affecting the bone marrow.
4. Clinical Symptoms Suggestive of Blood Disorders
Additional testing is often warranted when laboratory abnormalities are accompanied by clinical signs such as:
Unexplained bruising or bleeding
Fatigue or pallor
Frequent infections
Signs of thrombosis or abnormal clotting
These symptoms may indicate that abnormal MPV reflects more than a laboratory variation.
5. Suspected Bone Marrow Disorders
When both MPV and other blood indices suggest abnormal platelet production in the bone, further diagnostic evaluation may include:
Bone marrow aspiration or biopsy
Advanced hematology testing
Flow cytometry or genetic studies in certain cases
These tests help determine whether the underlying issue is production failure, infiltration, or dysregulated hematopoiesis.
Clinical Example
A patient presents with easy bruising and fatigue. Laboratory findings show:
Low platelet count
Elevated MPV
Increased PDW
Mild anemia
Interpretation:
The combination of high MPV and increased PDW suggests increased platelet turnover
Anemia indicates possible broader hematologic involvement
Further testing such as peripheral smear and bone marrow evaluation may be required
This example illustrates how multiple tests work together to clarify the meaning of abnormal MPV blood test results.
Clinical Applications of MPV in Patient Care
The MPV Blood Test has become an increasingly useful component of hematologic evaluation in modern clinical practice. While mean platelet volume does not diagnose specific diseases on its own, it provides important supportive information about platelet production, platelet size, and platelet function. When interpreted alongside the platelet count, other platelet indices, and full blood test results, MPV contributes to a more complete understanding of a patient’s hematologic and systemic health.
In patient care, MPV is particularly valuable because it reflects dynamic changes in whole blood that may occur in response to inflammation, infection, bone marrow activity, or cardiovascular stress. Clinicians use MPV as a complementary marker that helps interpret abnormal findings, monitor disease progression, and evaluate treatment response.
How MPV Supports Diagnosis and Monitoring
One of the most important clinical roles of the MPV Blood Test is its ability to support diagnostic reasoning. Although it is not a standalone diagnostic tool, it helps clinicians interpret patterns within the complete blood count and identify possible underlying conditions affecting platelets.
1. Differentiating Causes of Thrombocytopenia
MPV is especially useful when evaluating a low platelet count. It helps distinguish between:
Increased platelet destruction (often associated with high MPV)
Decreased platelet production (often associated with low MPV)
For example:
A patient with low platelet count and increased MPV may have immune-mediated platelet destruction, where the bone marrow compensates by releasing larger, younger platelets.
A patient with low platelet count and low MPV may have bone marrow suppression, indicating reduced platelet production.
This distinction is clinically important because it influences further testing and treatment strategies.
2. Monitoring Inflammatory and Cardiovascular Conditions
Research suggests that mean platelet volume is associated with inflammatory and cardiovascular conditions. In such cases, MPV may serve as a marker of platelet activation and systemic stress.
Examples include:
Coronary artery disease
Acute infections
Chronic inflammatory disorders
In these conditions, an increase in MPV may reflect increased platelet reactivity and a higher tendency toward blood clot formation. Clinicians may use MPV trends over time to monitor disease activity or response to treatment.
3. Assessing Bone Marrow Function
Because platelets originate from the bone marrow, MPV indirectly reflects marrow activity. A mean platelet volume measurement may help indicate whether the bone marrow is:
Actively producing and releasing platelets (often high MPV)
Suppressed or failing to produce adequate platelets (often low MPV)
This is particularly useful in patients undergoing chemotherapy or those with suspected hematologic disorders affecting platelet production in the bone.
4. Monitoring Treatment Response
MPV can also be used to monitor how patients respond to therapy. For instance:
In patients treated for immune thrombocytopenia, normalization of MPV may indicate improved platelet balance
In patients recovering from bone marrow suppression, gradual changes in MPV may reflect restoration of normal hematopoiesis
In this way, the MPV Blood Test measures changes over time rather than providing a single diagnostic snapshot.
Nursing Considerations for Abnormal MPV Results
Nurses play a critical role in the interpretation, monitoring, and communication of abnormal MPV blood test results. Because MPV is often included in routine laboratory panels, nurses are frequently among the first healthcare professionals to identify abnormal findings.
1. Understanding Clinical Context
When reviewing MPV results, nurses must consider:
Platelet count
Other blood cell parameters (red blood cells and white blood cells)
A high or low MPV should never be interpreted in isolation. Clinical correlation is essential.
2. Recognizing Important Patterns
Nurses should be able to recognize key patterns such as:
Low platelet count + high MPV → possible increased platelet destruction
Low platelet count + low MPV → possible decreased platelet production
Normal platelet count + abnormal MPV → early or subtle platelet changes
These patterns help guide timely communication with the healthcare provider.
3. Monitoring for Clinical Symptoms
Abnormal MPV values may be associated with changes in platelet function that affect bleeding or clotting risk. Nurses should monitor for:
Petechiae or unexplained bruising
Prolonged bleeding from minor injuries
Signs of thrombosis (swelling, pain, shortness of breath)
Fatigue or pallor suggesting broader hematologic involvement
These symptoms may indicate clinically significant changes in platelet production or activity.
4. Reporting and Escalation
Nurses are responsible for promptly reporting significant abnormalities, especially when MPV changes are accompanied by:
Severe thrombocytopenia (low platelet count)
Rapid changes in laboratory trends
Signs of active bleeding or clotting disorders
Timely escalation ensures further evaluation and reduces risk of complications.
Patient Education and Follow-Up
Patient education is an essential component of care when discussing the MPV Blood Test, especially because abnormal results can cause confusion or anxiety.
1. Explaining MPV in Simple Terms
Patients should be informed that:
MPV measures the average platelet size in the blood
It does not diagnose a disease on its own
It must be interpreted alongside other blood test results
Clear explanations help patients understand that an abnormal MPV is part of a broader clinical picture.
2. Helping Patients Understand Abnormal Results
When explaining results, healthcare providers may clarify:
A high MPV may mean the body is producing larger, younger platelets
A low MPV may suggest reduced platelet production in the bone marrow
Changes in MPV may reflect inflammation, recovery, or bone marrow activity
For example: A patient with infection-related inflammation may have increased MPV, which reflects increased platelet activity rather than a primary blood disorder.
3. Encouraging Follow-Up Testing
Patients should be advised that abnormal MPV often requires follow-up, especially when associated with:
Abnormal platelet count
Symptoms such as bleeding or fatigue
Other abnormal blood cell findings
Follow-up testing may include repeat complete blood count, platelet distribution width, or peripheral smear analysis.
4. Promoting Adherence and Monitoring
Patients undergoing treatment for hematologic conditions should be encouraged to:
Attend scheduled laboratory testing
Report new symptoms promptly
Understand trends in MPV levels over time rather than focusing on a single value
This improves long-term monitoring of platelet production, treatment response, and disease progression.
Limitations of the MPV Blood Test
Although the MPV Blood Test provides valuable insight into platelet size, platelet production, and overall platelet dynamics, it is important to recognize that it has significant limitations. Like many hematologic parameters, mean platelet volume is best interpreted as part of a broader diagnostic framework rather than as an isolated marker. Understanding these limitations is essential for avoiding misinterpretation of blood test results and ensuring accurate clinical decision-making.
One of the most important principles in hematology is that MPV reflects a biological trend rather than a definitive diagnosis. While changes in MPV may suggest alterations in platelet production in the bone, platelet turnover, or platelet activation, they do not identify a specific disease on their own.
In clinical practice, MPV must always be evaluated alongside the platelet count, other platelet indices, and full complete blood count findings to provide meaningful interpretation.
Measuring Platelet Size
Why MPV Alone Cannot Diagnose Disease
A key limitation of the MPV Blood Test measures is that it lacks diagnostic specificity. This means that although MPV can indicate that something is affecting platelets, it cannot determine the exact cause.
1. Overlapping Causes of Abnormal MPV
Both high MPV and low MPV can be associated with a wide range of conditions. For example:
High MPV may be seen in:
Inflammatory conditions
Immune-mediated platelet destruction
Cardiovascular disease
Recovery from acute blood loss
Low MPV may be seen in:
Bone marrow suppression
Chemotherapy effects
Chronic systemic illness
Reduced platelet production
Because multiple conditions can produce similar MPV changes, the test lacks disease specificity.
2. Dependence on Platelet Count and Other Parameters
MPV must always be interpreted alongside platelet count. Without this context, interpretation may be misleading.
For example:
A high MPV with normal platelet count may indicate platelet activation without disease
A high MPV with low platelet count may suggest increased platelet destruction
A low MPV with low platelet count may suggest bone marrow failure
This demonstrates that MPV alone cannot explain whether platelet abnormalities are due to production issues, destruction, or reactive changes.
3. Lack of Functional Information
The MPV Blood Test measures platelet size but does not directly assess platelet function. Larger platelets are often assumed to be more active, but MPV does not measure:
Clotting efficiency
Adhesion ability
Aggregation capacity
Actual contribution to blood clot formation
Therefore, a normal or abnormal MPV does not guarantee normal or abnormal hemostatic function.
4. Biological Variability
MPV values can fluctuate due to normal physiological variation. Factors such as hydration status, stress, and transient infections may influence results without indicating disease. This variability reduces its reliability as a standalone diagnostic marker.
Factors That Can Affect Test Accuracy
The accuracy of the MPV Blood Test can be influenced by several pre-analytical, analytical, and biological factors. These variables may lead to misleading interpretations if not properly considered.
1. Pre-Analytical Factors
These are factors that occur before laboratory analysis and can significantly affect mean platelet volume values.
a. Sample Handling and Timing
Platelets are sensitive cells that can change shape after blood collection. Delays in analysis may cause platelets to swell, leading to artificially increased MPV.
b. Anticoagulant Effects
The type of anticoagulant used in blood collection tubes can affect platelet morphology. Some anticoagulants may cause platelets to change size over time, influencing MPV results.
c. Temperature and Storage Conditions
Improper storage conditions can alter platelet structure. Exposure to temperature changes may affect the reliability of platelet size measurements.
2. Analytical Factors
These relate to the laboratory equipment and methodology used to measure MPV.
a. Variation Between Analyzers
Different hematology analyzers may use different technologies to calculate MPV, such as:
Electrical impedance methods
Optical light scatter techniques
These differences can result in variability in reported mean platelet volume measurement between laboratories.
b. Calibration Differences
Inconsistent calibration standards between laboratories may lead to variation in what is considered a normal range, affecting interpretation.
3. Biological Factors
Several physiological and pathological conditions can influence MPV independent of disease severity.
a. Age and Physiological State
MPV may vary with age, pregnancy, and hormonal changes. For example, platelet volume in women may fluctuate during pregnancy or menstrual cycles.
b. Inflammatory and Acute Conditions
Inflammation can temporarily increase MPV due to platelet activation, even in the absence of chronic disease. This reflects a physiological response rather than pathology.
c. Platelet Turnover Rates
Conditions that alter platelet turnover can significantly affect MPV. Increased turnover leads to larger platelets, while decreased turnover results in smaller ones.
4. Interpretation-Related Limitations
Even when laboratory values are accurate, interpretation itself can be limited if clinical context is not considered.
For example:
A mildly elevated MPV may be clinically insignificant in a healthy individual
The same value may be highly relevant in a patient with thrombocytopenia
This highlights the importance of integrating MPV with other clinical and laboratory findings.
Clinical Example
A patient presents for routine testing with the following results:
MPV: Slightly elevated
Platelet count: Normal
White blood cells: Normal
No symptoms
Interpretation:
The isolated increase in MPV may reflect transient platelet activation or biological variation
No evidence of active disease is present
No further immediate testing may be required
This example demonstrates how MPV blood test results can be misleading if interpreted without context.
Struggling to integrate patient care examples in your paper?
We’ll include accurate, practical illustrations for clarity.
The MPV Blood Test provides a valuable window into platelet biology by measuring mean platelet volume, an indicator of platelet size, production dynamics, and overall platelet behavior in circulation. When interpreted correctly, MPV adds depth to routine hematologic evaluation, offering insight into how the bone marrow responds to physiological demand, injury, inflammation, or disease.
Throughout clinical interpretation, MPV demonstrates its greatest value when assessed alongside the platelet count, other platelet indices, and the broader complete blood count. This combined approach allows clinicians to distinguish between conditions involving increased platelet destruction, reduced platelet production, or reactive changes affecting whole blood components such as red blood cells and white blood cells. In this way, MPV contributes to a more complete understanding of hematologic balance and blood cell activity.
A key takeaway is that abnormal MPV values—whether high MPV or low MPV—do not represent standalone diagnoses. Instead, they reflect underlying physiological processes such as altered platelet turnover, changes in bone marrow activity, or systemic influences like inflammation and cardiovascular stress. For example, an elevated MPV may suggest increased platelet activation and production, while a reduced MPV may point toward impaired marrow function or decreased platelet output.
However, despite its usefulness, the MPV Blood Test measures have important limitations. Variability in laboratory techniques, biological fluctuations, and pre-analytical factors can all influence results. Additionally, MPV does not directly assess platelet function or clotting efficiency, meaning it must always be interpreted within a broader clinical and laboratory context.
From a clinical and nursing perspective, understanding MPV enhances the ability to recognize meaningful patterns in blood test results, support early identification of hematologic abnormalities, and contribute to more informed patient monitoring and education. It reinforces the importance of looking beyond single values and instead evaluating trends, relationships, and the overall picture of whole blood health.
Ultimately, the MPV Blood Test serves as a supportive but powerful tool in modern hematology. When used appropriately, it helps bridge laboratory data with clinical reasoning, improving the understanding of platelet physiology and supporting more accurate, holistic patient care.
Frequently Asked Questions
When should I worry about high MPV?
You should be more concerned about a high MPV when it appears alongside abnormal findings such as a low platelet count, unexplained bruising or bleeding, or symptoms suggesting clotting problems (e.g., chest pain, limb swelling, or sudden shortness of breath). High MPV alone, especially with a normal platelet count and no symptoms, is often not clinically significant and may reflect temporary platelet activation or recovery after illness.
How to interpret MPV test results?
MPV should always be interpreted together with the platelet count and the full complete blood count.
High MPV + low platelets may suggest increased platelet destruction with bone marrow compensation.
Low MPV + low platelets may suggest reduced platelet production in the bone marrow.
Normal MPV + normal platelets usually indicates balanced platelet production and turnover. Context, symptoms, and other blood cell findings are essential for accurate interpretation.
What diseases are linked to high MPV?
High MPV can be associated with several conditions, including:
Recovery states after bleeding or acute platelet loss
However, MPV is not disease-specific and cannot confirm any diagnosis on its own.
What is a normal MPV level?
A typical normal MPV range is approximately 7.5 to 12.0 femtoliters (fL), though this may vary slightly depending on the laboratory and analyzer used. Values within this range generally suggest normal platelet size and balanced platelet production and destruction.
BUN Normal Range: Understanding Blood Urea Nitrogen, Kidney Function, and Blood Test Results
Blood urea nitrogen (BUN) is one of the most commonly evaluated laboratory values in healthcare and serves as an important indicator of the body’s ability to eliminate metabolic waste. As part of many routine and diagnostic blood tests, BUN provides valuable information about kidney function, hydration status, protein metabolism, and overall physiological balance. Because abnormalities in BUN levels can occur in a wide range of medical conditions, understanding the BUN normal range is essential for accurately interpreting laboratory findings and assessing patient health.
The human body continuously breaks down proteins obtained from food and normal tissue metabolism. This process produces ammonia, a potentially toxic substance that is converted by the liver into urea. Urea then enters the bloodstream and is transported to the kidneys, where it is filtered and ultimately removed from the body through urine. The amount of urea nitrogen present in the blood can therefore provide important clues about how effectively these processes are functioning. When abnormalities occur in urea production, kidney filtration, or waste elimination, BUN values may rise or fall outside the expected normal range.
The blood urea nitrogen test is widely used because it offers healthcare providers a relatively simple and cost-effective method of evaluating renal health and identifying potential abnormalities. However, BUN should never be viewed as an isolated laboratory value. Numerous factors can influence the concentration of urea nitrogen in the blood, including:
Kidney disease
Dehydration
Liver dysfunction
High-protein diets
Malnutrition
Certain medications
Gastrointestinal bleeding
Acute and chronic illnesses
As a result, interpretation of BUN requires careful consideration of the patient’s overall clinical condition, symptoms, medical history, and other laboratory findings.
One of the reasons the BUN test remains so important in clinical practice is its role in the evaluation of kidney function. The kidneys are responsible for filtering waste products from the bloodstream while maintaining fluid, electrolyte, and acid-base balance. When kidney function becomes impaired, waste products may accumulate in the blood, causing measurable changes in laboratory values. Because of this relationship, BUN is frequently included among routine kidney function tests and is often assessed alongside creatinine, estimated glomerular filtration rate (eGFR), and urinalysis findings.
Understanding the BUN normal range involves more than simply memorizing a reference value. Accurate interpretation requires an appreciation of several important concepts, including:
How urea is formed and transported within the body.
How healthy kidneys regulate waste removal.
Factors that influence normal and abnormal BUN levels.
The clinical significance of elevated and decreased results.
The relationship between BUN, creatinine, and other markers of renal function.
Appropriate nursing and clinical responses to abnormal findings.
A BUN result that falls outside the expected reference range does not automatically indicate kidney disease. For example, dehydration can temporarily increase BUN levels even when the kidneys themselves are functioning normally. Conversely, some individuals with significant kidney impairment may require additional laboratory testing before the full extent of renal dysfunction becomes apparent. This illustrates why BUN must always be interpreted within the broader context of patient assessment and diagnostic evaluation.
Healthcare professionals frequently use BUN measurements to monitor patients with chronic illnesses, evaluate acute changes in health status, assess treatment effectiveness, and identify potential complications before they become severe. In emergency departments, outpatient clinics, medical-surgical units, intensive care settings, and long-term care facilities, BUN remains a fundamental component of laboratory assessment and clinical decision-making.
This guide provides a comprehensive examination of the BUN normal range and its significance in healthcare. It explores the physiology of blood urea nitrogen, the purpose and procedure of BUN testing, normal reference values, factors that influence results, causes of high and low BUN levels, and the relationship between BUN and kidney function. It also examines the interpretation of BUN test results, the role of creatinine and other kidney function tests, approaches to managing abnormal values, and important nursing considerations for patient assessment and education. Through a thorough understanding of these concepts, readers can develop greater confidence in interpreting laboratory data and applying BUN findings in clinical practice.
Confused about formatting or citations?
We’ll ensure your nursing assignment meets academic standards.
Blood urea nitrogen (BUN) is a laboratory measurement that reflects the amount of urea nitrogen present in the bloodstream. Urea is a normal waste product produced when the body breaks down proteins from dietary sources and normal tissue metabolism. Because proteins contain nitrogen, the body must safely process and eliminate excess nitrogen to prevent toxic accumulation.
The term blood urea nitrogen specifically refers to the nitrogen component of urea circulating in the blood rather than the entire urea molecule itself. The BUN test is designed to measure the amount of urea nitrogen in your blood, providing valuable information about waste elimination, hydration status, and overall kidney function. It is one of the most commonly ordered laboratory tests and is frequently included in a basic metabolic panel and a comprehensive metabolic panel.
Understanding BUN begins with understanding how the body handles protein metabolism and how the kidneys remove waste products from circulation. When these processes function normally, BUN remains within the expected normal range. However, abnormalities in urea production, filtration, or excretion can cause BUN levels to rise or fall, providing important clinical clues about a patient’s health status.
Several important facts help explain the significance of BUN:
It is a marker of nitrogen-containing waste in the bloodstream.
It reflects the balance between urea production and urea elimination.
It is commonly used to assess kidney function.
It can help identify dehydration, kidney disease, and other medical conditions.
It is often interpreted together with creatinine and other kidney function tests.
Although BUN is closely associated with renal health, it is not exclusively a kidney marker. Factors such as diet, liver function, medications, fluid status, and acute illness can all influence BUN values. For this reason, healthcare providers interpret BUN within the broader clinical context rather than relying on it as a standalone diagnostic measurement.
Formation of Urea Nitrogen in the Body
To understand blood urea nitrogen, it is important to first understand how urea is produced.
The body constantly breaks down proteins obtained from food and from the normal turnover of tissues. During this process, amino acids are metabolized and their nitrogen-containing components are removed. This breakdown generates ammonia, a highly toxic substance that cannot safely remain in the bloodstream. The liver therefore converts ammonia into urea through a series of biochemical reactions known as the urea cycle.
The process can be summarized in the following steps:
Proteins are broken down into amino acids.
Amino acids release nitrogen during metabolism.
Nitrogen is converted into ammonia.
The liver transforms ammonia into urea.
Urea enters the bloodstream.
The kidneys filter urea and remove it from the body through urine.
This process is essential because ammonia is toxic to cells, particularly the brain. By converting ammonia into urea, the body creates a safer compound that can be transported in the blood and eliminated efficiently. The urea cycle therefore serves as a critical detoxification mechanism.
For example, after consuming a high-protein meal such as chicken, fish, eggs, or beef, the body metabolizes the excess protein. As protein metabolism increases, more urea is produced, which may temporarily increase urea nitrogen levels in the bloodstream. Similarly, conditions associated with increased tissue breakdown, such as severe infections, burns, or trauma, can increase urea production and influence BUN values.
A key point to remember is that the liver produces urea, but the kidneys are responsible for removing it. Therefore, abnormalities in either organ system can affect BUN levels. Liver dysfunction may reduce urea production, while impaired kidney filtration may prevent adequate elimination of urea from the body.
The Role of BUN in Waste Elimination
The primary purpose of BUN is to reflect the body’s ability to eliminate nitrogen-containing waste products.
Every day, the body generates metabolic waste through:
Protein metabolism
Cellular turnover
Tissue repair
Breakdown of aging cells
Without efficient waste removal, these byproducts would accumulate and disrupt normal physiological function. Urea serves as one of the body’s major mechanisms for safely transporting excess nitrogen to the kidneys for excretion.
Under normal circumstances:
Healthy kidneys filter urea from the blood.
Filtered urea enters the renal tubules.
Most excess urea leaves the body through urine.
Only a relatively stable concentration remains in circulation.
This continuous filtration process helps maintain normal levels of nitrogen-containing waste products in the bloodstream. When healthy kidneys filter urea effectively, BUN remains within the expected reference range.
Consider the following example:
A healthy adult consumes a protein-rich meal. The liver converts excess nitrogen into urea, which enters the bloodstream. The kidneys then filter the urea and remove it from the body through urine. Because waste elimination is functioning normally, BUN remains within the expected range despite increased protein metabolism.
In contrast, if an individual develops severe dehydration, less blood reaches the kidneys for filtration. As a result, more urea remains in circulation and BUN may rise even when there is no underlying kidney disease. This illustrates why BUN is influenced by both kidney and non-kidney factors.
Because urea is a waste product, monitoring its concentration provides insight into how effectively the body is eliminating metabolic waste and maintaining internal balance.
Why Blood Urea Nitrogen Matters in Healthcare
Blood urea nitrogen remains one of the most widely utilized laboratory measurements in modern healthcare because it provides valuable information about multiple physiological systems.
Healthcare providers frequently order a blood urea nitrogen test when evaluating:
Kidney disease
Acute kidney injury
Dehydration
Fluid imbalances
Chronic illnesses
Critical care patients
Medication effects
Overall renal function
The test is particularly valuable because it is inexpensive, readily available, and can be performed quickly using a small blood sample obtained from a vein in your arm. Once the blood sample to a lab is analyzed, clinicians can use the results to help determine whether additional testing or intervention may be necessary.
BUN is especially useful when interpreted alongside other laboratory measurements such as:
Creatinine
Estimated glomerular filtration rate (GFR)
Electrolyte levels
Urinalysis findings
Other kidney function tests
For example, a patient presenting with dehydration may demonstrate elevated BUN while creatinine remains relatively stable. Conversely, a patient with significant kidney damage may exhibit elevations in both BUN and creatinine, suggesting impaired filtration capacity. These patterns help clinicians distinguish among different causes of abnormal laboratory findings.
Blood urea nitrogen also plays an important role in:
Early Detection of Kidney Problems
Changes in BUN may be among the earliest laboratory signs that well your kidneys are working has been affected. While BUN alone cannot diagnose kidney disease, it can alert healthcare providers to potential problems requiring further investigation.
Monitoring Disease Progression
Patients with chronic kidney disease often undergo regular laboratory monitoring. Tracking BUN trends over time helps clinicians evaluate disease progression and treatment effectiveness.
Evaluating Treatment Response
BUN measurements can help determine whether interventions such as fluid replacement, medication adjustments, or dialysis are improving renal function and waste elimination.
Assessing Overall Clinical Status
Because BUN is influenced by hydration, nutrition, and metabolic activity, it often provides valuable information about a patient’s general physiological condition beyond kidney health alone.
Ultimately, blood urea nitrogen serves as far more than a simple laboratory value. It represents an important link between protein metabolism, liver function, waste elimination, and kidney health. Understanding how BUN is formed, how it participates in waste removal, and why it is used in clinical practice provides the foundation for interpreting BUN test results and appreciating their significance in patient care.
Understanding the BUN Blood Test
The BUN blood test is one of the most frequently performed laboratory investigations in healthcare and serves as an important tool for evaluating waste metabolism, hydration status, and kidney function. Although the test itself is relatively simple, the information it provides can help clinicians identify a wide range of medical conditions, monitor disease progression, and guide treatment decisions.
The term BUN stands for blood urea nitrogen, which refers to the nitrogen component of urea circulating in the bloodstream. Because urea is produced as a result of normal protein metabolism and is removed primarily by the kidneys, measuring blood urea nitrogen provides valuable insight into how effectively the body is producing and eliminating metabolic waste.
The blood urea nitrogen test is commonly included in routine health evaluations, hospital admissions, emergency department assessments, and chronic disease monitoring programs. In many cases, the test is ordered as part of a basic metabolic panel or a comprehensive metabolic panel, allowing healthcare providers to evaluate multiple aspects of a patient’s physiological status simultaneously.
One reason the BUN test remains so widely used is that it is:
Simple to perform
Relatively inexpensive
Widely available
Minimally invasive
Useful in a variety of clinical settings
However, interpreting BUN values requires an understanding of what the test measures, how the specimen is collected and analyzed, and the clinical situations in which the test is most useful. A BUN value does not provide a diagnosis by itself; instead, it serves as one piece of a larger clinical picture that must be interpreted alongside patient history, physical examination findings, symptoms, and other laboratory data.
What the BUN Test Measures
At its core, the BUN test measures the concentration of nitrogen contained within urea circulating in the bloodstream. More specifically, the test is designed to measure the amount of urea and determine the amount of urea nitrogen present in a patient’s blood.
To understand this measurement, it is important to recognize that urea is a byproduct of protein metabolism. When proteins are broken down, nitrogen-containing compounds are produced. Because ammonia generated during this process is toxic, the liver converts it into urea, which can be safely transported through the bloodstream and eliminated by the kidneys.
As a result, urea nitrogen in your blood reflects the balance between:
Urea production by the liver.
Urea transport through the bloodstream.
Urea filtration by the kidneys.
Urea excretion through urine.
Under normal circumstances, there is always a small amount of urea nitrogen present in the blood because protein metabolism occurs continuously. This small amount of urea represents a normal waste-removal process and is not harmful. Problems arise when the concentration becomes significantly elevated or reduced.
The test therefore evaluates whether the concentration of urea nitrogen in the blood falls within an expected normal range or whether abnormalities may be present.
For example:
A healthy individual with normal protein intake and healthy renal function will typically have a BUN value within the established reference range.
A patient experiencing severe dehydration may develop an elevated BUN because reduced fluid volume limits the kidneys’ ability to eliminate waste efficiently.
A patient with advanced kidney disease may have a significant rise in BUN because the kidneys can no longer adequately remove urea from circulation.
Because urea nitrogen is a waste product, measuring its concentration helps clinicians determine whether waste elimination mechanisms are functioning properly.
Importantly, BUN does not directly measure kidney performance. Rather, it measures the concentration of a waste product that depends on healthy kidney filtration for removal. This distinction helps explain why conditions unrelated to the kidneys can sometimes affect BUN values.
How the Blood Urea Nitrogen Test Is Performed
The blood urea nitrogen test is a straightforward laboratory procedure that requires only a small sample of blood.
In most healthcare settings, the testing process follows several basic steps:
Step 1: Patient Preparation
For many patients, no special preparation is required before getting a BUN test. However, depending on the reason for testing and the other laboratory studies being ordered simultaneously, some individuals may need to fast for several hours.
If fasting is required:
Patients are usually instructed not to eat for several hours before the test.
Water is often permitted unless otherwise specified.
Medication instructions may vary depending on the clinical situation.
Healthcare providers will explain whether a patient needs to fast before testing.
Step 2: Blood Collection
The next step involves obtaining a sample of blood.
A healthcare professional will typically:
Select a suitable vein in your arm.
Clean the area with an antiseptic solution.
Insert a sterile needle into the vein.
Collect a small amount of blood into a collection tube.
In most cases, blood is drawn from veins located in the antecubital region of the arm. Patients may feel a brief pinch during needle insertion, but the procedure generally takes only a few minutes.
The process is often described as obtaining blood from a vein, and it is one of the most common procedures performed in healthcare settings.
Step 3: Laboratory Analysis
Once collected, the blood sample is labeled and transported to the laboratory.
The blood sample to a lab undergoes chemical analysis using automated equipment capable of measuring the concentration of blood urea nitrogen with a high degree of accuracy.
Laboratory instruments calculate the amount of nitrogen derived from urea present in the sample and generate a numerical result that can be compared to the laboratory’s established reference range.
Step 4: Interpretation of Results
After analysis, healthcare providers review the patient’s test results.
Interpretation typically includes:
Comparison with normal values
Evaluation of trends over time
Correlation with symptoms
Assessment of hydration status
Review of other laboratory findings
Because normal ranges may vary slightly among laboratories due to differences in testing methods and equipment, clinicians always interpret BUN values using the reference range provided by the performing laboratory.
When Healthcare Providers Order a BUN Blood Test
Healthcare providers may order a blood urea nitrogen test for many different reasons. Although the test is closely associated with kidney evaluation, its clinical applications extend beyond renal disease alone.
One of the most common reasons for ordering the test is to assess kidney function. Since healthy kidneys filter urea and remove it from the bloodstream, abnormal BUN values may indicate that the kidneys are not functioning properly.
Common situations in which providers order a BUN blood test include:
Evaluation of Kidney Disease
Patients with suspected or confirmed kidney disease frequently undergo BUN testing.
Examples include:
Chronic kidney disease
Glomerular disorders
Diabetic nephropathy
Hypertensive kidney damage
Polycystic kidney disease
In these situations, BUN helps evaluate overall renal function and monitor disease progression.
Investigation of Acute Kidney Injury
A sudden decline in kidney performance, known as acute kidney injury, can result in a rapid increase in blood urea nitrogen levels.
Common causes include:
Severe dehydration
Sepsis
Major surgery
Medication toxicity
Reduced blood flow to the kidneys
Monitoring BUN helps clinicians assess the severity of the condition and evaluate treatment response.
Assessment of Hydration Status
Because fluid balance affects urea concentration, dehydration often produces a noticeable rise in BUN.
For example, an elderly patient admitted with vomiting and diarrhea may develop elevated BUN values due to fluid loss. In such cases, the test helps identify dehydration and monitor recovery after fluid replacement.
Monitoring Chronic Medical Conditions
Patients with chronic illnesses may undergo regular BUN testing as part of routine monitoring.
Examples include:
Diabetes mellitus
Hypertension
Heart failure
Liver disease
Chronic kidney disease
These conditions can influence kidney health and waste elimination over time.
Medication Monitoring
Certain medications can affect kidney function or alter BUN values.
Examples include:
Diuretics
Nonsteroidal anti-inflammatory drugs (NSAIDs)
Certain antibiotics
Chemotherapy agents
Healthcare providers may order periodic testing to ensure these medications are not adversely affecting the kidneys.
Part of Routine Laboratory Evaluation
The BUN test is often included in:
Hospital admission laboratory work
Annual physical examinations
Preoperative assessments
Emergency department evaluations
Critical care monitoring
Because it is a common blood test, BUN frequently provides important baseline information about a patient’s overall physiological status.
Evaluation of Abnormal Symptoms
Providers may also order BUN testing when patients present with symptoms that could indicate a kidney problem or impaired waste elimination.
Examples include:
Swelling of the legs or face
Changes in urine output
Persistent fatigue
Confusion
Nausea and vomiting
Signs and symptoms of later-stage kidney disease
In these situations, BUN is typically interpreted alongside creatinine, glomerular filtration rate (GFR) estimates, electrolyte levels, and other kidney function tests.
Ultimately, the blood urea nitrogen test remains one of the most valuable tools for evaluating waste metabolism and renal health. By measuring the concentration of urea nitrogen in circulation, the test provides important information about how well the body is eliminating waste products, maintaining fluid balance, and supporting normal physiological function. Understanding what the BUN test measures, how it is performed, and when it is ordered forms an essential foundation for accurate laboratory interpretation and clinical decision-making.
BUN Normal Range and Reference Values
Understanding the BUN Normal Range is essential for accurately interpreting laboratory findings and evaluating overall health. While many people focus on whether a laboratory value is “normal” or “abnormal,” healthcare professionals recognize that laboratory interpretation is far more nuanced. A BUN result must always be interpreted in relation to the patient’s age, hydration status, dietary habits, medical history, medications, and other laboratory findings.
The BUN Normal Range refers to the expected concentration of blood urea nitrogen found in the bloodstream of healthy individuals. Because blood urea nitrogen reflects the balance between urea production and urea elimination, values outside the expected range may indicate physiological changes, underlying disease processes, or temporary factors affecting metabolism and kidney function.
It is important to recognize that the reference range for BUN is not a fixed number. Instead, laboratories provide a range of values considered normal for a specific population. Results that fall slightly outside this range do not automatically indicate disease, just as results within the range do not guarantee the absence of medical problems.
Several factors influence whether a BUN value is considered normal, including:
Age
Sex
Hydration status
Protein intake
Pregnancy
Liver function
Kidney function
Laboratory testing methods
For this reason, clinicians rarely interpret BUN in isolation. Instead, they compare the result with other indicators such as creatinine, estimated glomerular filtration rate (GFR), and additional kidney function tests to obtain a more complete picture of a patient’s health.
Standard BUN Reference Range
The standardBUN Normal Range for healthy adults generally falls between 7 and 20 mg/dL, although slight variations exist among laboratories. Some facilities may report a slightly broader range based on their testing methods and patient populations.
In practical terms:
BUN Value
General Interpretation
Below reference range
May indicate low BUN
Within reference range
Generally considered normal
Above reference range
May indicate elevated BUN
Most healthcare providers consider a result within the laboratory’s established range to be considered normal, but interpretation does not stop there. Clinical context remains critically important.
For example:
A BUN value of 18 mg/dL would generally be viewed as normal in a healthy adult.
A value of 22 mg/dL may be only slightly elevated and could result from mild dehydration rather than kidney disease.
A value of 60 mg/dL would typically require prompt clinical investigation because it suggests significant disruption in waste elimination or fluid balance.
The concept of the BUN Normal Range becomes even more important when monitoring patients over time. A patient whose BUN rises steadily from 10 mg/dL to 18 mg/dL to 25 mg/dL may warrant further evaluation even if earlier values were technically within the reference range.
Healthcare professionals therefore focus on:
The absolute BUN value.
Trends over time.
Associated symptoms.
Other laboratory findings.
The patient’s overall clinical condition.
Another important consideration is that normal ranges may vary among laboratories. Different testing equipment, calibration standards, and reference populations can produce slight differences in reported ranges. Therefore, clinicians should always review the laboratory-specific reference values accompanying the test report.
Normal BUN Levels by Age and Population
Although the adult BUN Normal Range is widely used, BUN values naturally vary across different age groups and populations.
Newborns and Infants
Newborns often have different BUN values than older children and adults because their kidneys and metabolic systems are still developing. Reference values in newborns may be lower or more variable depending on age and nutritional status.
Children and Adolescents
Children generally have lower BUN values than adults because they possess different metabolic demands and protein turnover rates. As children grow and kidney maturation occurs, BUN values gradually approach adult levels.
Adults
For most healthy adults, the standard adult BUN Normal Range applies. During adulthood, BUN values typically remain relatively stable when hydration, nutrition, and renal function remain normal.
Older Adults
BUN values often increase with age, even in the absence of significant disease. Research shows that BUN levels tend to increase with age because of physiological changes that occur over time. These changes may include:
Gradual reductions in renal reserve
Changes in body composition
Alterations in hydration status
Age-related changes in filtration efficiency
As a result, mildly higher BUN values may be observed in older adults without necessarily indicating serious kidney pathology.
Pregnancy
Pregnancy represents another special population. Physiological increases in blood volume and changes in kidney filtration often result in lower BUN values than those typically seen in nonpregnant adults. Consequently, a value that appears low according to a standard reference range may actually be expected during pregnancy.
Population Differences
Normal values may also differ slightly among populations due to variations in:
Dietary protein intake
Lifestyle factors
Muscle mass
Hydration habits
Underlying health conditions
For example, individuals who consume high-protein diets may have BUN values toward the upper end of the normal range because increased protein metabolism generates more urea. Conversely, individuals following low-protein diets may naturally have lower values.
Factors That Influence Normal BUN Ranges
One of the most important concepts in laboratory interpretation is that BUN is influenced by many variables beyond kidney health alone. Understanding these factors helps explain why a result may deviate from the expected BUN Normal Range without necessarily indicating disease.
Hydration Status
Hydration is one of the strongest influences on BUN values.
When a person becomes dehydrated:
Blood volume decreases.
Blood flow to the kidneys may decline.
Less urea is removed from circulation.
BUN concentrations rise.
Even temporary dehydration caused by exercise, vomiting, diarrhea, or inadequate fluid intake can affect BUN measurements.
Protein Intake
Because urea is produced during protein metabolism, dietary habits significantly influence blood urea nitrogen values.
Examples include:
High-protein diets may increase BUN.
Protein supplements may raise BUN values.
Low-protein diets may contribute to lower BUN levels.
A physically active individual consuming large amounts of protein may therefore have a higher BUN value than someone consuming a low-protein diet, even when both individuals have healthy kidneys.
Liver Function
The liver plays a central role in converting ammonia into urea.
If liver function becomes impaired:
Less urea may be produced.
Blood urea nitrogen values may decrease.
BUN may appear lower than expected.
This relationship highlights the fact that blood urea nitrogen reflects both liver and kidney physiology.
Kidney Function
Because healthy kidneys filter urea from the bloodstream, changes in kidney performance can significantly affect BUN values.
As filtration efficiency declines:
Urea accumulates in the bloodstream.
BUN levels rise.
Waste elimination becomes less effective.
However, BUN alone cannot determine the exact cause of impaired filtration, which is why clinicians evaluate it together with creatinine levels and GFR measurements.
Medications
Numerous medications can affect BUN values.
Examples include:
Diuretics
Corticosteroids
Certain antibiotics
Chemotherapy agents
These medications may alter hydration status, protein metabolism, or kidney function, resulting in measurable changes in BUN concentrations.
Acute Illness and Stress
Serious illness, infection, trauma, burns, and surgery can increase protein breakdown within the body.
As protein catabolism increases:
More urea is produced.
Blood urea nitrogen values may rise.
BUN levels may temporarily exceed the normal range.
This is one reason hospitalized patients often undergo serial BUN monitoring during acute illness.
Ultimately, understanding the BUN Normal Range requires more than memorizing laboratory numbers. A normal value reflects the balance between protein metabolism, liver function, kidney filtration, and waste elimination. Age, hydration status, nutrition, medications, and underlying medical conditions all influence blood urea nitrogen concentrations. For this reason, healthcare providers interpret BUN values within the broader clinical context and alongside other markers of renal health to obtain the most accurate assessment of a patient’s condition.
The Relationship Between BUN and Kidney Function
Among the many laboratory measurements used to evaluate renal health, blood urea nitrogen (BUN) remains one of the most widely recognized indicators of how well your kidneys are working. Because the kidneys are primarily responsible for removing urea from the bloodstream, changes in BUN levels often provide important clues about kidney function, fluid balance, and the body’s ability to eliminate waste products.
However, the relationship between BUN and the kidneys is more complex than many people realize. While elevated or reduced BUN values can reflect changes in renal function, they can also be influenced by numerous non-kidney factors. Understanding this relationship is essential for accurate interpretation of laboratory data and appropriate clinical decision-making.
At its most basic level, BUN reflects the balance between:
Production of urea in the liver
Transport of urea through the bloodstream
Filtration of urea by the kidneys
Excretion of urea through urine
When these processes function normally, BUN remains within the expected BUN Normal Range. When one or more of these mechanisms become disrupted, BUN levels may increase or decrease accordingly.
This close relationship explains why BUN is routinely included among kidney function tests and why it is often interpreted alongside creatinine, estimated glomerular filtration rate (GFR), and urinalysis findings.
How the Kidneys Regulate BUN Levels
The kidneys play a central role in regulating the concentration of urea nitrogen in the blood. Every day, approximately 180 liters of blood-derived fluid pass through the kidneys, where waste products, excess water, and toxins are filtered from circulation.
The process begins when blood to your kidneys enters microscopic filtering units called nephrons. Each kidney contains approximately one million nephrons, which work continuously to cleanse the bloodstream and maintain homeostasis.
The regulation of BUN occurs through several key steps:
1. Filtration of Urea
As blood enters the glomeruli within the nephrons, urea is filtered from circulation.
Under normal circumstances:
Healthy kidneys filter urea efficiently.
Urea passes from the blood into the filtrate.
Waste products are separated from substances the body needs to retain.
Because urea is small and water-soluble, it moves relatively easily through the filtration membrane.
2. Tubular Processing
After filtration, the filtrate travels through the renal tubules.
Within these structures:
Water is reabsorbed as needed.
Electrolytes are regulated.
Some urea may be reabsorbed back into circulation.
The degree of urea reabsorption depends partly on hydration status. During dehydration, the kidneys conserve water more aggressively, which may result in greater urea reabsorption and higher BUN levels.
3. Excretion Through Urine
The remaining urea ultimately leaves the body through urine.
When kidney function is normal:
Waste products are effectively eliminated.
BUN remains within the expected range.
Internal chemical balance is maintained.
This continuous filtration and excretion process explains why the kidneys are critical regulators of blood urea nitrogen concentrations.
Example: Normal Kidney Regulation
Consider a healthy adult who consumes a protein-rich meal.
The following sequence occurs:
Protein is metabolized.
Urea is produced by the liver.
Urea enters the bloodstream.
The kidneys filter the excess urea.
Waste is excreted in urine.
Because healthy kidneys filter waste efficiently, the person’s BUN remains within the normal reference range despite increased protein metabolism.
Example: Impaired Filtration
Now consider a patient experiencing acute kidney injury.
As kidney filtration declines:
Less urea is removed from circulation.
Urea accumulates in the bloodstream.
A rise in BUN occurs.
In this situation, elevated BUN serves as a warning sign that waste elimination is no longer functioning effectively.
BUN as an Indicator of Kidney Function
Because the kidneys are responsible for eliminating urea, BUN has long been used as an indirect marker to assess kidney function.
When evaluating a patient’s laboratory findings, healthcare providers often examine BUN as part of the broader evaluation of renal function.
BUN can provide valuable information about:
Renal perfusion
Waste elimination
Hydration status
Disease progression
Treatment effectiveness
In many cases, BUN levels may change before symptoms become obvious, making laboratory monitoring an important tool for early detection of abnormalities.
Elevated BUN and Kidney Dysfunction
One of the most common reasons for increased BUN is reduced kidney filtration.
As renal function declines:
Waste products accumulate.
Urea nitrogen levels increase.
The concentration of urea in circulation rises.
This is why high BUN values are frequently associated with:
Chronic kidney disease
Acute kidney injury
Severe kidney damage
Advanced renal disorders
Kidney failure
For example, a patient with progressive diabetic nephropathy may develop increasing BUN values over time as kidney function deteriorates.
Similarly, an individual with severe dehydration may exhibit elevated BUN levels because reduced blood flow decreases filtration efficiency.
Relationship Between BUN and Glomerular Filtration Rate
The glomerular filtration rate (GFR) is widely regarded as one of the most important indicators of kidney health.
GFR estimates how much blood the kidneys filter each minute.
In general:
Higher GFR indicates better kidney function.
Lower GFR suggests impaired filtration.
Declining GFR is often associated with rising BUN.
As GFR decreases:
Waste removal becomes less efficient.
Urea accumulates in circulation.
BUN values often increase.
For this reason, clinicians frequently evaluate BUN and GFR together when assessing renal health.
BUN and Creatinine
Although BUN provides useful information, it is rarely interpreted alone.
Healthcare providers commonly evaluate:
BUN and creatinine
Estimated GFR
Urinalysis findings
Electrolyte levels
This approach improves diagnostic accuracy because creatinine is another waste product removed by the kidneys.
Unlike BUN, creatinine is produced primarily through muscle metabolism and is generally less influenced by dietary protein intake and hydration status.
When both BUN and creatinine levels rise simultaneously, clinicians become more concerned about impaired kidney function.
For example:
Finding
Possible Interpretation
Elevated BUN, normal creatinine
Dehydration or increased protein breakdown
Elevated BUN and elevated creatinine
Possible kidney dysfunction
Rising BUN with falling GFR
Declining renal function
Normal BUN and creatinine
Generally consistent with normal filtration
This relationship makes BUN and creatinine among the most important laboratory measurements used to evaluate renal health.
Limitations of Using BUN Alone
Despite its clinical usefulness, BUN has important limitations that must be understood.
A common misconception is that an abnormal BUN value automatically indicates kidney disease. In reality, numerous factors can influence BUN concentrations independently of renal function.
Because of these limitations, healthcare providers do not rely on BUN alone to diagnose kidney disorders.
BUN Is Influenced by Hydration Status
One of the most significant limitations is the effect of hydration.
Even healthy individuals may develop elevated BUN when:
They become dehydrated.
They experience vomiting or diarrhea.
They have reduced fluid intake.
They lose excessive fluids through sweating.
In these situations, the kidneys may be functioning normally despite abnormal laboratory findings.
Protein Intake Can Affect BUN
Protein consumption directly influences urea production.
Examples include:
High-protein diets may raise BUN.
Protein supplements may increase urea production.
Catabolic illness may increase nitrogen waste.
As a result, dietary habits can significantly affect laboratory results.
Liver Disease May Lower BUN
Because the liver produces urea, liver dysfunction may result in:
Reduced urea formation.
Lower BUN values.
Misleading laboratory interpretations.
A patient with severe liver disease may therefore have a low BUN despite significant illness.
Medications Can Alter Results
Several medications can affect BUN, including:
Corticosteroids
Diuretics
Certain antibiotics
Chemotherapy agents
Medication-related changes must always be considered when interpreting test results.
BUN Cannot Determine the Cause of Kidney Dysfunction
Even when BUN is elevated, the test cannot identify the underlying cause.
For example, increased BUN may result from:
Dehydration
Kidney disease
Heart failure
Gastrointestinal bleeding
Shock
Severe infection
Additional testing is required to determine the precise cause.
Why BUN Must Be Interpreted With Other Tests
Because of these limitations, clinicians typically interpret BUN alongside:
Creatinine in your blood
Estimated GFR
Urinalysis
Electrolyte studies
Imaging studies when necessary
Organizations such as the National Kidney Foundation emphasize that no single laboratory value should be used in isolation when evaluating kidney health. Comprehensive assessment provides a far more accurate picture of renal function than any individual test result alone.
Ultimately, the relationship between BUN and kidney function is rooted in the kidneys’ essential role in filtering and eliminating urea from the bloodstream. Because healthy kidneys filter urea and maintain normal waste removal, BUN serves as a useful indicator of renal health. However, BUN is influenced by numerous physiological and pathological factors, making it an indirect rather than definitive marker of kidney function. For this reason, healthcare providers interpret BUN alongside creatinine, glomerular filtration rate, patient history, physical assessment findings, and other diagnostic data to obtain the most accurate evaluation of renal status.
Causes and Significance of High BUN Levels
An elevated blood urea nitrogen value is one of the most common abnormal findings encountered during laboratory testing. While a result above the BUN Normal Range may initially raise concerns about kidney health, high BUN levels do not always indicate a primary kidney disorder. Instead, they often reflect an imbalance between the production of urea and the body’s ability to eliminate it efficiently.
To understand why elevated BUN occurs, it is important to remember that blood urea nitrogen represents the concentration of nitrogen derived from urea circulating in the bloodstream. Urea is continuously produced during protein metabolism and normally removed by the kidneys. When production increases, filtration decreases, or excretion becomes impaired, BUN levels can rise above the expected reference range.
A variety of conditions can cause a high BUN value, ranging from temporary dehydration to severe kidney failure. Consequently, healthcare providers must interpret elevated results within the broader context of a patient’s medical history, symptoms, physical examination findings, and other laboratory measurements such as creatinine, glomerular filtration rate (GFR), and urinalysis results.
In many cases, a single mildly elevated BUN value may not be clinically significant. However, persistent or progressively increasing values often warrant further investigation because they may indicate impaired waste removal, declining renal function, or an underlying disease process requiring treatment.
Broadly speaking, the causes of elevated BUN can be divided into two categories:
Kidney-related causes.
Non-kidney causes.
Understanding the distinction between these categories is essential for accurate diagnosis and management.
Kidney-Related Causes of Elevated BUN
One of the most important reasons for elevated BUN levels is impaired kidney function. Because the kidneys are responsible for filtering urea from the bloodstream and removing it through urine, any condition that interferes with this process can cause blood urea nitrogen to accumulate.
Chronic Kidney Disease
Kidney disease is among the most common causes of persistently elevated BUN values.
In chronic kidney disease (CKD), progressive damage to kidney tissue reduces the organ’s ability to filter waste products effectively. As functioning nephrons are lost over time:
Filtration efficiency decreases.
Waste products accumulate in circulation.
BUN concentrations rise.
Renal function gradually declines.
For example, a patient with long-standing diabetes mellitus may develop diabetic nephropathy, leading to progressive kidney damage. As the disease advances, BUN and creatinine values often increase together, reflecting declining filtration capacity.
Because CKD often develops gradually, serial monitoring of BUN can help clinicians track disease progression and assess treatment effectiveness.
Acute Kidney Injury
Unlike chronic kidney disease, acute kidney injury (AKI) develops suddenly and may occur over hours or days.
Common causes include:
Severe infection
Major surgery
Shock
Medication toxicity
Significant blood loss
Reduced blood flow to the kidneys
When AKI occurs:
The kidneys suddenly lose filtering capacity.
Waste products accumulate rapidly.
A significant rise in BUN may develop.
For instance, a patient hospitalized with severe sepsis may experience acute kidney injury due to decreased blood flow and inflammatory damage to the kidneys. In such situations, BUN levels may increase dramatically within a short period.
Glomerular Disorders
The glomeruli serve as the kidneys’ primary filtration units.
Diseases affecting these structures can impair filtration and cause elevated BUN levels.
Examples include:
Glomerulonephritis
Lupus nephritis
IgA nephropathy
Post-infectious kidney disorders
Because the glomeruli are responsible for filtering waste products from the bloodstream, damage to these structures can significantly affect kidney function and contribute to abnormal laboratory findings.
Obstructive Uropathy
Urinary tract obstruction can also cause elevated BUN values.
Examples include:
Kidney stones
Enlarged prostate
Ureteral obstruction
Tumors affecting urinary drainage
When urine flow becomes blocked:
Waste products cannot be eliminated normally.
Pressure builds within the urinary system.
Renal filtration becomes impaired.
Blood urea nitrogen concentrations increase.
Prompt identification and treatment of obstruction are essential to prevent permanent kidney damage.
Kidney Failure
Among the most serious causes of elevated BUN is kidney failure.
In advanced renal failure:
Waste removal becomes severely impaired.
Urea accumulates in the bloodstream.
BUN may reach extremely high levels.
Multiple organ systems may be affected.
Patients with advanced kidney failure often require specialized interventions such as dialysis to remove accumulated waste products and maintain physiological stability.
Non-Kidney Causes of High BUN
Although elevated BUN is commonly associated with renal disorders, numerous non-kidney factors can also increase blood urea nitrogen levels.
These causes are particularly important because they demonstrate why BUN should never be interpreted as a standalone indicator of kidney disease.
Dehydration
Dehydration is one of the most common non-renal causes of elevated BUN.
When fluid volume decreases:
Less blood reaches the kidneys.
Filtration efficiency declines temporarily.
More urea is reabsorbed into circulation.
BUN levels increase.
Examples include:
Vomiting
Diarrhea
Excessive sweating
Inadequate fluid intake
Severe burns
A patient presenting to the emergency department after several days of severe gastroenteritis may have significantly elevated BUN despite having structurally normal kidneys.
Once hydration is restored, BUN values often return toward normal.
High-Protein Diets
Because urea is produced during protein metabolism, increased protein consumption can raise blood urea nitrogen concentrations.
Individuals consuming:
High-protein diets
Protein supplements
Large quantities of meat
Specialized athletic nutrition plans
may develop mildly elevated BUN values even when kidney function remains normal.
For example, a bodybuilder consuming large amounts of dietary protein may have a BUN value near or slightly above the upper limit of the normal range due to increased urea production.
Gastrointestinal Bleeding
Upper gastrointestinal bleeding can substantially increase BUN levels.
When blood enters the digestive tract:
Proteins contained within the blood are digested.
Additional nitrogen becomes available.
Urea production increases.
Blood urea nitrogen rises.
This phenomenon is one reason elevated BUN can sometimes help clinicians identify occult gastrointestinal bleeding.
Increased Tissue Breakdown
Conditions associated with accelerated protein catabolism can increase urea production.
Examples include:
Severe trauma
Major burns
Fever
Infection
Cancer
Hyperthyroidism
In these situations, increased tissue breakdown produces additional nitrogen-containing waste, contributing to elevated BUN concentrations.
Medications
Several medications can contribute to elevated BUN levels.
Examples include:
Corticosteroids
Tetracycline antibiotics
Certain chemotherapy agents
Diuretics
Some medications increase protein breakdown, while others alter hydration status or renal blood flow.
Consequently, medication history is an important component of BUN interpretation.
Heart Failure and Reduced Blood Flow
Conditions that reduce blood flow to the kidneys may also increase BUN.
Examples include:
Congestive heart failure
Shock
Severe hypotension
Although the kidneys themselves may initially remain structurally intact, inadequate perfusion limits filtration efficiency and contributes to waste accumulation.
Why BUN Matters in Healthcare
Clinical Implications of Elevated BUN Levels
The significance of high BUN levels depends on the degree of elevation, the underlying cause, associated symptoms, and accompanying laboratory findings.
An elevated BUN value should not be viewed as a diagnosis. Rather, it serves as a clinical indicator that additional evaluation may be necessary.
Indicator of Impaired Waste Removal
One of the most important implications of elevated BUN is the possibility that waste products are not being removed effectively.
the likelihood of significant kidney dysfunction increases substantially.
In such situations, healthcare providers may perform additional testing to determine the extent of renal impairment.
Assessment of Disease Severity
BUN can also provide information about disease severity.
For example:
Mild elevations may reflect temporary dehydration.
Moderate elevations may indicate developing renal dysfunction.
Severe elevations may suggest advanced kidney disease or kidney failure.
Trend analysis is particularly important because progressively rising values often indicate worsening physiological function.
Monitoring Treatment Response
Healthcare providers frequently use BUN to evaluate treatment effectiveness.
Examples include monitoring:
Fluid replacement therapy
Dialysis treatments
Medication adjustments
Chronic kidney disease management
Declining BUN values following treatment often suggest improvement in waste elimination and overall physiological status.
Association With Symptoms
Markedly elevated BUN levels may eventually contribute to clinical symptoms, particularly when associated with severe kidney dysfunction.
Potential manifestations include:
Fatigue
Nausea
Loss of appetite
Mental confusion
Weakness
Fluid retention
In advanced cases, these findings may overlap with the symptoms of later-stage kidney disease, emphasizing the importance of timely evaluation and management.
Need for Comprehensive Evaluation
Because elevated BUN can result from numerous renal and non-renal causes, healthcare providers typically interpret results alongside:
Creatinine measurements
Estimated GFR
Electrolyte levels
Urinalysis findings
Clinical assessment
Imaging studies when indicated
Organizations such as the National Kidney Foundation emphasize that abnormal laboratory values should always be evaluated within the context of the patient’s overall clinical picture rather than viewed in isolation.
Ultimately, high BUN levels represent an important clinical finding that may reflect impaired waste elimination, reduced kidney function, dehydration, increased protein metabolism, or other underlying conditions. Distinguishing between kidney-related and non-kidney causes is essential for accurate diagnosis and effective treatment. By understanding the mechanisms responsible for elevated blood urea nitrogen, healthcare professionals can better interpret laboratory results, identify potential health concerns, and develop appropriate management strategies.
Causes and Significance of Low BUN Levels
While healthcare providers often focus on elevated blood urea nitrogen values, low BUN results can also provide important clinical information. Although reduced BUN levels are generally less common and often less concerning than elevated values, they may sometimes indicate underlying nutritional, hepatic, metabolic, or physiological abnormalities that warrant further evaluation.
To understand why a low BUN occurs, it is helpful to review how blood urea nitrogen is produced. Urea is formed in the liver as a result of protein metabolism and is subsequently transported through the bloodstream to the kidneys for elimination. Because BUN reflects the balance between urea production and urea excretion, reduced values may occur when:
The body produces less urea than normal.
The liver cannot effectively synthesize urea.
Excess fluid dilutes the concentration of urea in the blood.
Certain physiological or pathological conditions alter nitrogen metabolism.
In many cases, a mildly reduced BUN value may not indicate disease and may simply reflect normal biological variation. However, persistent or significantly reduced blood urea nitrogen levels should always be interpreted in conjunction with patient history, symptoms, physical examination findings, and other laboratory data.
Importantly, just as an elevated BUN does not automatically indicate kidney disease, a low BUN does not necessarily signify impaired kidney function. In fact, many causes of low BUN originate outside the kidneys and are related to protein intake, liver function, fluid balance, or metabolic processes.
Common Causes of Low BUN
Several physiological and clinical factors can lead to reduced blood urea nitrogen levels. Understanding these causes helps healthcare professionals determine whether a low value is expected, benign, or potentially significant.
Low Protein Intake
One of the most common causes of low BUN is inadequate dietary protein consumption.
Because urea is produced during protein metabolism:
Reduced protein intake results in less nitrogen being metabolized.
Less urea is produced by the liver.
Blood urea nitrogen levels decrease.
Examples include:
Strict low-protein diets
Severe dietary restriction
Malnutrition
Eating disorders
Prolonged inadequate nutritional intake
For example, an older adult experiencing poor appetite and inadequate dietary intake over several months may develop reduced BUN values due to decreased protein consumption rather than kidney dysfunction.
This illustrates an important concept: BUN reflects not only waste elimination but also the amount of nitrogen entering metabolic pathways.
Overhydration
Excessive fluid intake or fluid retention can dilute substances circulating in the bloodstream, including urea.
In these situations:
Blood volume increases.
Urea becomes more diluted.
Measured BUN concentrations decrease.
Examples include:
Excessive intravenous fluid administration
Certain endocrine disorders
Water intoxication
Conditions causing fluid overload
A hospitalized patient receiving large volumes of intravenous fluids may therefore develop a lower BUN value even though urea production and kidney function remain normal.
Pregnancy
Pregnancy is a well-recognized physiological cause of reduced blood urea nitrogen levels.
Several normal adaptations occur during pregnancy:
Blood volume expands significantly.
Kidney filtration increases.
Urea is cleared more efficiently.
BUN concentrations often decrease.
As a result, values that appear slightly low compared with standard adult reference ranges may be entirely normal during pregnancy.
Increased Anabolic Activity
Periods of rapid tissue growth or increased protein utilization may reduce circulating urea concentrations.
Examples include:
Childhood growth
Pregnancy
Recovery from severe illness
Tissue healing after injury
During these periods, amino acids may be utilized for tissue synthesis rather than being broken down into nitrogen-containing waste products.
Certain Medications
Some medications may contribute to lower BUN values through effects on protein metabolism, fluid balance, or liver function.
Examples include:
Certain anabolic agents
Medications that increase fluid retention
Drugs affecting hepatic metabolism
Medication history should therefore always be reviewed when evaluating abnormal laboratory findings.
Conditions Associated With Reduced Blood Urea Nitrogen
Although many cases of low BUN are benign, certain medical conditions may also contribute to reduced blood urea nitrogen levels.
Liver Disease
One of the most important pathological causes of low BUN is significant liver dysfunction.
The liver is responsible for converting ammonia into urea through the urea cycle. When liver function becomes impaired:
Urea production decreases.
Less nitrogen is converted into urea.
Blood urea nitrogen levels fall.
Examples include:
Cirrhosis
Severe hepatitis
Advanced liver failure
Fulminant hepatic injury
In these situations, a low BUN may reflect impaired hepatic synthetic function rather than a kidney problem.
For example, a patient with advanced cirrhosis may demonstrate a low BUN because the liver is unable to efficiently convert ammonia into urea. This finding may occur even when kidney function remains relatively preserved.
Severe Malnutrition
Malnutrition affects multiple aspects of metabolism and can significantly reduce urea production.
When protein intake remains inadequate for prolonged periods:
Fewer amino acids are available for metabolism.
Nitrogen production declines.
Urea formation decreases.
BUN levels become reduced.
Patients at risk include:
Older adults with poor nutritional intake
Individuals with chronic illness
Patients with cancer-related cachexia
Individuals experiencing food insecurity
In these cases, low BUN may serve as an indirect indicator of nutritional deficiency.
Syndrome of Inappropriate Antidiuretic Hormone (SIADH)
SIADH causes excessive water retention and dilution of blood components.
As fluid accumulates:
Blood becomes diluted.
Urea concentrations decrease.
BUN levels may appear abnormally low.
Although the kidneys themselves may function normally, the dilutional effect contributes to reduced laboratory values.
Protein-Losing Conditions
Certain disorders result in excessive protein loss from the body.
Examples include:
Nephrotic syndrome
Protein-losing enteropathy
Severe gastrointestinal disorders
Reduced protein availability may contribute to lower urea production and subsequently lower blood urea nitrogen concentrations.
Genetic and Metabolic Disorders
Rare metabolic disorders affecting the urea cycle can impair normal nitrogen processing.
In these conditions:
Ammonia metabolism becomes disrupted.
Urea production decreases.
BUN values may be significantly reduced.
Although uncommon, these disorders highlight the central role of urea synthesis in maintaining normal nitrogen balance.
Clinical Importance of Low BUN Results
Compared with elevated values,low BUN results are often less likely to indicate an urgent medical problem. Nevertheless, they can provide valuable diagnostic information when interpreted appropriately.
The clinical significance of low blood urea nitrogen depends on:
The degree of reduction
Associated symptoms
Underlying medical conditions
Other laboratory findings
Overall clinical context
Identifying Nutritional Deficiencies
One of the most important uses of low BUN values is the identification of possible nutritional concerns.
When reduced BUN occurs alongside:
Weight loss
Muscle wasting
Poor dietary intake
Low serum protein levels
healthcare providers may investigate potential malnutrition or inadequate protein consumption.
This is particularly important in older adults, hospitalized patients, and individuals with chronic illness.
Assessing Liver Function
Because the liver produces urea, low BUN may provide clues regarding hepatic health.
When low BUN is accompanied by:
Elevated liver enzymes
Abnormal bilirubin levels
Low albumin concentrations
Clinical signs of liver disease
further evaluation of hepatic function may be warranted.
In some cases, low BUN may be one of several laboratory findings indicating significant liver dysfunction.
Understanding Fluid Balance
Reduced blood urea nitrogen may also reflect alterations in fluid status.
For example:
Excess intravenous fluids
Water retention disorders
Dilutional states
can lower measured BUN concentrations without affecting actual urea production.
Recognition of these patterns helps prevent misinterpretation of laboratory results.
Interpreting Results Alongside Other Tests
Just as elevated BUN should not be interpreted in isolation, low BUN values must be evaluated alongside other laboratory measurements.
Important accompanying tests include:
Creatinine
Electrolytes
Liver function studies
Albumin
Estimated GFR
Additional kidney function tests
For example:
Laboratory Pattern
Possible Interpretation
Low BUN, normal creatinine
Low protein intake or dilutional effect
Low BUN, abnormal liver tests
Possible liver dysfunction
Low BUN, low albumin
Potential malnutrition
Low BUN, fluid overload
Dilutional decrease
These combinations often provide far more clinically useful information than a single laboratory value alone.
When Is Low BUN Clinically Significant?
A mildly reduced BUN level in an otherwise healthy individual may have little clinical significance. However, further evaluation may be appropriate when low values occur alongside:
Signs of liver disease
Evidence of malnutrition
Significant weight loss
Chronic illness
Persistent laboratory abnormalities
Symptoms suggestive of metabolic dysfunction
The goal is not merely to identify a low laboratory value but to determine whether it reflects an underlying condition requiring intervention.
Ultimately, low BUN levels are less common than elevated values but remain an important component of laboratory interpretation. Reduced blood urea nitrogen may result from low protein intake, overhydration, pregnancy, liver disease, malnutrition, or other physiological and pathological processes. While many cases are benign, persistent or unexplained reductions should be evaluated within the broader clinical context. By understanding the causes and significance of low BUN results, healthcare professionals can better assess patient health, identify underlying conditions, and develop appropriate diagnostic and treatment strategies.
Interpreting BUN Test Results
Interpreting BUN test results is one of the most important aspects of evaluating kidney health and overall physiological function. While obtaining a laboratory value is relatively straightforward, understanding what that value means requires careful analysis of the patient’s clinical condition, medical history, symptoms, medications, hydration status, and other laboratory findings.
A common mistake is assuming that a BUN value alone can diagnose a specific disease. In reality, blood urea nitrogen is only one component of a broader diagnostic picture. Because numerous factors can influence BUN levels, healthcare providers must evaluate results within the context of the patient’s overall health.
When interpreting a BUN result, clinicians typically consider several questions:
Is the value within the expected BUN Normal Range?
Is the result higher or lower than previous measurements?
Are there symptoms suggesting a kidney problem?
What do the patient’s creatinine levels show?
Is the estimated glomerular filtration rate (GFR) normal?
Are there signs of dehydration, malnutrition, or liver disease?
Do other kidney function tests support the findings?
The answers to these questions help determine whether a BUN result is clinically significant and whether further investigation is needed.
It is also important to recognize that laboratory interpretation often focuses on trends rather than isolated values. A patient whose BUN rises gradually over several months may warrant further evaluation even if the value remains close to the upper limit of the normal range.
Understanding High or Low Test Results
One of the first steps in interpreting BUN test results is determining whether the value is normal, elevated, or decreased.
Interpreting High BUN Results
A high BUN result indicates that the concentration of urea nitrogen in your blood exceeds the laboratory’s established reference range.
This occurs when:
Urea production increases.
Kidney filtration decreases.
Waste elimination becomes impaired.
Blood flow to the kidneys is reduced.
Common causes of elevated BUN include:
Dehydration
Chronic kidney disease
Acute kidney injury
Gastrointestinal bleeding
High-protein diets
Heart failure
Certain medications
For example, consider a patient admitted to the hospital with severe vomiting and diarrhea. The patient may have a high BUN level because fluid loss reduces blood flow to the kidneys, causing more urea to remain in circulation. In this situation, the abnormal result may improve after adequate fluid replacement.
In contrast, a patient with progressive kidney disease may demonstrate persistently increasing BUN values because the kidneys are no longer able to eliminate waste efficiently.
The severity of elevation also matters:
BUN Finding
Possible Interpretation
Mild elevation
Dehydration, dietary factors, medication effects
Moderate elevation
Possible renal impairment or significant fluid imbalance
Severe elevation
Advanced kidney dysfunction or kidney failure
A single elevated value should always be interpreted alongside additional clinical information before conclusions are drawn.
Interpreting Low BUN Results
A low BUN result occurs when blood urea nitrogen falls below the expected reference range.
Although less common than elevated values, reduced BUN levels may occur in several situations, including:
Low protein intake
Malnutrition
Pregnancy
Severe liver disease
Overhydration
Certain metabolic disorders
For example, a patient with advanced liver cirrhosis may have reduced BUN because the liver cannot efficiently convert ammonia into urea.
Similarly, an individual receiving large amounts of intravenous fluids may develop a dilutional reduction in BUN despite normal kidney function.
In many cases, mildly reduced values are not clinically concerning. However, persistent reductions may warrant evaluation of nutritional status, liver function, and overall health.
The Importance of Clinical Context
Perhaps the most important principle in interpreting high or low BUN values is understanding that abnormal results do not automatically indicate kidney disease.
For example:
Dehydration may increase BUN despite normal kidneys.
Liver disease may decrease BUN despite normal kidneys.
High-protein diets may raise BUN without renal impairment.
Pregnancy may lower BUN without indicating pathology.
This is why healthcare providers rarely rely on blood urea nitrogen alone when assessing kidney function.
The BUN-to-Creatinine Ratio
One of the most useful tools for interpreting abnormal BUN values is the BUN-to-creatinine ratio.
Because creatinine is another waste product filtered by the kidneys, comparing BUN and creatinine provides additional insight into the underlying cause of abnormal laboratory findings. The ratio helps clinicians distinguish between different physiological and pathological processes affecting renal function.
What Is Creatinine?
Before understanding the ratio, it is important to understand creatinine itself.
Creatinine is produced during normal muscle metabolism and enters the bloodstream at a relatively steady rate. Like urea, it is removed primarily through the kidneys. Because creatinine in your blood is less influenced by diet and hydration than BUN, it is often considered a more specific marker of kidney filtration.
Normal BUN-to-Creatinine Ratio
In most adults, the normal BUN and creatinine ratio is approximately:
10:1 to 20:1
Although exact values may vary slightly among laboratories, ratios within this range are generally considered expected.
High BUN-to-Creatinine Ratio
A ratio greater than approximately 20:1 may indicate that BUN is increasing disproportionately compared with creatinine.
Common causes include:
Dehydration
Reduced blood flow to the kidneys
Gastrointestinal bleeding
Heart failure
Increased protein breakdown
Example:
A patient with severe dehydration may have:
Elevated BUN
Mildly increased creatinine
High BUN-to-creatinine ratio
Because dehydration increases urea reabsorption, BUN often rises more dramatically than creatinine in these situations.
Low BUN-to-Creatinine Ratio
A lower-than-expected ratio may occur in conditions such as:
Liver disease
Malnutrition
Low protein intake
Reduced urea production
For example, a patient with severe liver dysfunction may produce less urea, resulting in a lower ratio despite relatively stable creatinine values.
Why the Ratio Matters
The BUN-to-creatinine ratio provides information that neither test can offer independently.
It helps clinicians:
Differentiate dehydration from intrinsic kidney disease.
Evaluate possible gastrointestinal bleeding.
Assess nutritional status.
Investigate abnormal laboratory findings.
Guide additional diagnostic testing.
However, the ratio should never be interpreted in isolation. Both the absolute BUN and creatinine values remain critically important.
BUN and Other Kidney Function Tests
Although blood urea nitrogen is valuable, modern evaluation of renal health relies on multiple laboratory and diagnostic measurements rather than a single test.
Organizations such as the National Kidney Foundation emphasize that BUN is most useful when interpreted alongside other markers of kidney health. The foundation notes that BUN by itself is often not sufficient for a complete assessment of renal function.
Creatinine
Among all renal laboratory measurements, creatinine is one of the most important.
When the kidneys become less efficient at filtering waste:
High levels of creatinine develop.
Waste accumulates in the bloodstream.
Renal impairment becomes more apparent.
Because creatinine is less affected by dietary protein intake and hydration than BUN, it often provides a more specific indicator of kidney filtration.
Estimated Glomerular Filtration Rate (eGFR)
The glomerular filtration rate (GFR) is considered one of the best overall indicators of kidney function.
The estimated GFR:
Measures how efficiently the kidneys filter blood.
Helps stage chronic kidney disease.
Detects declining renal function.
Assists with treatment planning.
In general:
Higher GFR values indicate better filtration.
Lower GFR values suggest impaired kidney function.
BUN, creatinine, and GFR are frequently evaluated together because they provide complementary information about renal health.
Urinalysis
Urinalysis provides additional information that cannot be obtained from blood tests alone.
A urine examination may identify:
Protein leakage
Blood in the urine
Infection
Glucose abnormalities
Structural kidney disorders
For example, a patient with elevated BUN and abnormal urinary protein may be experiencing glomerular disease affecting the kidneys’ filtering structures.
Comprehensive Metabolic Panel and Basic Metabolic Panel
Because BUN is commonly included in both the basic metabolic panel and comprehensive metabolic panel, clinicians often evaluate it alongside:
Electrolytes
Glucose
Liver enzymes
Calcium
Creatinine
This broader perspective allows healthcare providers to identify patterns that may not be apparent when examining BUN alone.
Comprehensive Assessment of Renal Function
The most accurate evaluation of renal function involves integrating:
BUN values.
Creatinine measurements.
Estimated GFR.
Urinalysis findings.
Patient symptoms.
Medical history.
Physical examination findings.
For example, a patient with elevated BUN, elevated creatinine, reduced GFR, and proteinuria presents a much stronger picture of kidney dysfunction than a patient with an isolated increase in BUN alone.
Ultimately, interpreting BUN test results requires a comprehensive approach that considers both laboratory data and clinical context. High or low values can result from numerous physiological and pathological processes, making careful assessment essential. The BUN-to-creatinine ratio adds valuable diagnostic information, while additional kidney function tests such as creatinine, eGFR, and urinalysis provide a more complete picture of renal health. By evaluating these findings together, healthcare professionals can more accurately assess kidney function, identify underlying causes of abnormal results, and guide appropriate patient management.
Managing and Preventing Abnormal BUN Levels
Abnormal blood urea nitrogen values often serve as an important signal that further assessment or intervention may be necessary. However, effective management of abnormal BUN levels is not focused on correcting the laboratory value alone. Instead, the primary goal is to identify and address the underlying cause responsible for the abnormality.
Because blood urea nitrogen is influenced by kidney function, hydration status, dietary protein intake, liver function, medications, and various disease processes, management strategies vary significantly from one patient to another. A mildly elevated BUN caused by temporary dehydration requires a different approach than a markedly elevated value resulting from advanced kidney disease. Similarly, a low BUN related to poor nutrition must be managed differently than a low value caused by pregnancy or fluid overload.
The first step in managing abnormal results is understanding why the abnormality occurred. Healthcare providers typically evaluate:
The patient’s symptoms
Medical history
Medication use
Fluid status
Dietary habits
Other laboratory findings
Trends in previous BUN test results
This comprehensive approach helps determine whether the abnormal value represents a temporary physiological change or a more serious underlying condition.
Preventing abnormal BUN values also involves promoting overall health and supporting normal renal function. Since the kidneys play a central role in eliminating urea from the body, many preventive strategies focus on maintaining healthy kidney function and reducing factors that can contribute to kidney damage over time.
Addressing Elevated BUN Levels
When BUN levels rise above the expected BUN Normal Range, management focuses on identifying and correcting the specific factor responsible for the elevation.
Because elevated BUN levels can result from both renal and non-renal causes, treatment must be individualized.
Correcting Dehydration
One of the most common causes of high BUN is dehydration.
When fluid loss occurs due to:
Vomiting
Diarrhea
Fever
Excessive sweating
Inadequate fluid intake
the concentration of urea nitrogen in the blood increases because less fluid is available for filtration and waste removal.
Treatment typically involves:
Increasing oral fluid intake when appropriate
Administering intravenous fluids in more severe cases
Monitoring electrolyte balance
Reassessing laboratory values after hydration is restored
For example, an older adult admitted with dehydration secondary to gastroenteritis may demonstrate elevated BUN levels on admission. After receiving intravenous fluids, repeat laboratory testing often shows improvement as normal filtration and waste elimination are restored.
Managing Kidney Disease
When elevated BUN is caused by kidney disease, management focuses on slowing disease progression and preserving remaining kidney function.
Treatment may include:
Blood pressure control
Diabetes management
Medication adjustments
Dietary modifications
Monitoring renal function
Regular laboratory testing
Patients with chronic kidney disease often undergo periodic monitoring of:
Blood urea nitrogen
Creatinine
Estimated GFR
Urinalysis findings
Tracking these measurements helps healthcare providers evaluate disease progression and treatment effectiveness.
Reviewing Medications
Certain medications can affect BUN levels by altering kidney function, hydration status, or protein metabolism.
Examples include:
Diuretics
Nonsteroidal anti-inflammatory drugs (NSAIDs)
Corticosteroids
Some antibiotics
When medication-related elevations are suspected, healthcare providers may:
Adjust dosages
Substitute alternative medications
Increase monitoring
Assess renal function more frequently
Medication review is particularly important in older adults and individuals with existing kidney impairment.
Addressing Underlying Medical Conditions
Numerous conditions can contribute to elevated blood urea nitrogen, including:
Heart failure
Gastrointestinal bleeding
Severe infections
Acute kidney injury
Excessive protein breakdown
Successful management requires treatment of the underlying condition rather than focusing solely on the laboratory value.
For instance, a patient with heart failure may develop elevated BUN because reduced cardiac output decreases blood flow to the kidneys. Improving cardiac function may subsequently improve BUN values.
Dietary Considerations
In some cases, excessive protein intake contributes to elevated BUN concentrations.
Healthcare providers may recommend:
Reviewing dietary habits
Avoiding excessive protein supplementation
Following individualized nutritional recommendations
Consulting a registered dietitian when appropriate
It is important to note that dietary changes should be guided by clinical assessment because protein needs vary significantly among individuals.
Management of Severe Elevations
In advanced renal dysfunction or kidney failure, waste products may accumulate to dangerous levels.
When conservative management is insufficient, treatment may involve:
Specialized nephrology care
Intensive monitoring
Renal replacement therapy
Dialysis
These interventions help remove accumulated waste products and support physiological stability when the kidneys can no longer perform their normal functions effectively.
Supporting Healthy Kidney Function
Maintaining healthy kidneys is one of the most effective strategies for preventing abnormal BUN values and reducing the risk for long-term renal complications.
Because healthy kidneys filter urea and other waste products continuously, protecting renal health supports normal waste elimination and helps maintain the BUN Normal Range.
Maintain Adequate Hydration
Proper hydration supports normal kidney filtration and waste removal.
General recommendations include:
Drinking fluids regularly throughout the day
Increasing fluid intake during illness or exercise
Monitoring for signs of dehydration
Following individualized fluid recommendations when medical conditions are present
Adequate hydration helps ensure sufficient blood flow to the kidneys and promotes efficient elimination of metabolic waste.
Control Chronic Health Conditions
Several chronic diseases increase the risk for kidney disease.
These include:
Diabetes mellitus
Hypertension
Cardiovascular disease
Obesity
Effective management of these conditions can significantly reduce the likelihood of kidney damage over time.
For example, maintaining appropriate blood glucose levels in patients with diabetes can help prevent diabetic nephropathy, one of the leading causes of chronic kidney disease worldwide.
Follow a Balanced Diet
Nutritional habits play an important role in kidney health.
A balanced diet may help:
Support normal metabolism
Maintain healthy blood pressure
Reduce cardiovascular risk
Promote overall physiological function
Dietary recommendations often emphasize:
Fruits and vegetables
Whole grains
Lean protein sources
Appropriate sodium intake
Limited highly processed foods
Individuals with existing kidney disease may require specialized dietary guidance based on their specific clinical needs.
Avoid Nephrotoxic Substances
Certain substances can contribute to kidney damage when used improperly or excessively.
Examples include:
Some over-the-counter pain medications
Certain prescription medications
Recreational drugs
Environmental toxins
Using medications responsibly and following healthcare provider recommendations can help preserve renal function.
Participate in Routine Health Screening
Regular medical evaluations can identify abnormalities before significant kidney damage develops.
Routine screening may include:
Blood pressure monitoring
Blood glucose testing
Kidney function tests
Urinalysis
Periodic laboratory assessments
Early detection often allows intervention before serious complications occur.
Organizations such as the National Kidney Foundation emphasize the importance of preventive care, particularly for individuals with diabetes, hypertension, or a family history of kidney disease.
When Additional Evaluation Is Needed
Not all abnormal BUN values require extensive investigation. However, certain situations warrant additional evaluation to determine the underlying cause and assess potential health risks.
Persistent Abnormal Results
A single abnormal laboratory value may result from temporary factors such as dehydration or dietary changes.
Further evaluation is often indicated when:
Abnormalities persist on repeat testing
Values continue to worsen
Multiple laboratory abnormalities are present
Symptoms develop
Trend analysis frequently provides more meaningful information than an isolated result.
Accompanying Abnormal Kidney Function Tests
Additional assessment becomes particularly important when abnormal BUN occurs alongside:
Elevated creatinine
Reduced GFR
Abnormal urinalysis findings
Electrolyte disturbances
These combinations may suggest significant renal dysfunction requiring further investigation.
Signs and Symptoms of Kidney Disease
Healthcare providers may pursue additional evaluation when abnormal BUN values occur with symptoms such as:
Swelling of the hands, feet, or face
Persistent fatigue
Changes in urine output
Foamy urine
Nausea
Loss of appetite
Difficulty concentrating
These findings may indicate developing or advanced kidney dysfunction.
Evaluation for Acute Kidney Injury
Rapid changes in BUN may suggest acute kidney injury, particularly when accompanied by:
Reduced urine output
Significant illness
Recent surgery
Severe infection
Medication exposure
Prompt evaluation is essential because early treatment may improve outcomes and prevent permanent kidney damage.
Assessment of Underlying Conditions
Additional testing may also be needed when clinicians suspect:
Liver disease
Heart failure
Gastrointestinal bleeding
Severe malnutrition
Fluid balance disorders
Because BUN can be influenced by multiple organ systems, comprehensive assessment is often necessary to determine the precise cause of abnormal findings.
Diagnostic Tests That May Be Ordered
Depending on the clinical situation, healthcare providers may order:
Repeat blood urea nitrogen testing.
Serum creatinine measurement.
Estimated glomerular filtration rate assessment.
Urinalysis.
Urine protein testing.
Imaging studies such as renal ultrasound.
Additional metabolic and hematologic testing.
These investigations help establish an accurate diagnosis and guide treatment planning.
Referral to a Specialist
Referral to a nephrologist may be appropriate when:
Kidney disease is suspected.
Kidney function continues to decline.
Laboratory abnormalities persist.
Specialized treatment is required.
Early specialist involvement can help optimize patient outcomes and preserve kidney function.
Ultimately, managing and preventing abnormal BUN levels requires a comprehensive approach that focuses on the underlying cause rather than the laboratory value alone. Addressing elevated BUN may involve correcting dehydration, managing kidney disease, reviewing medications, or treating other contributing conditions. Long-term prevention centers on supporting healthy kidney function through adequate hydration, chronic disease management, balanced nutrition, and routine health monitoring. When abnormalities persist or are accompanied by concerning symptoms or laboratory findings, additional evaluation is essential to ensure accurate diagnosis and timely intervention.
Nursing Considerations for BUN Testing
Blood urea nitrogen testing is a routine component of patient assessment in many healthcare settings, including hospitals, outpatient clinics, dialysis centers, long-term care facilities, emergency departments, and community health environments. Although the laboratory test itself is relatively simple, nurses play a critical role in ensuring accurate specimen collection, interpreting results within the patient’s clinical context, monitoring trends, identifying potential complications, and educating patients about the significance of their findings.
Because blood urea nitrogen is influenced by numerous physiological and pathological factors, nursing assessment extends far beyond reviewing a laboratory value. Effective nursing practice requires an understanding of the relationship between BUN, hydration status, nutrition, medication use, renal function, and overall health status.
Nurses frequently encounter BUN results when caring for patients with:
Chronic kidney disease
Acute kidney injury
Diabetes mellitus
Hypertension
Heart failure
Liver disease
Fluid and electrolyte imbalances
Critical illnesses
Postoperative complications
In these situations, the nurse’s ability to recognize abnormal trends and communicate concerns promptly can contribute significantly to early intervention and improved patient outcomes.
Understanding the clinical significance of the BUN Normal Range is therefore an important component of nursing assessment, care planning, patient monitoring, and health education.
Patient Assessment and Interpretation
Accurate interpretation of BUN test results begins with a comprehensive patient assessment. Nurses should avoid viewing blood urea nitrogen values in isolation and instead evaluate them alongside other clinical findings and laboratory data.
Assessing Laboratory Findings
The first step is reviewing the patient’s laboratory results and determining whether the BUN value falls within the expected reference range.
However, interpretation should go beyond simply identifying whether the value is normal or abnormal. Nurses should consider:
Current BUN value
Previous BUN values
Trends over time
Associated laboratory abnormalities
Clinical symptoms
For example, a patient whose BUN increases from 14 mg/dL to 22 mg/dL to 35 mg/dL over several weeks may require further evaluation even if symptoms are initially mild.
Trend analysis often provides more meaningful information than a single laboratory result.
Evaluating Kidney Function
Because blood urea nitrogen is commonly used to assess kidney function, nurses should review additional indicators of renal health, including:
Creatinine
Estimated glomerular filtration rate (GFR)
Urine output
Urinalysis findings
Electrolyte levels
A patient with elevated BUN and rising creatinine levels may be experiencing worsening renal dysfunction, whereas an isolated increase in BUN may be more suggestive of dehydration or another non-renal cause.
Understanding the relationship between BUN and creatinine is particularly important because these tests are frequently interpreted together during the evaluation of renal function.
Assessing Hydration Status
Hydration assessment is a key nursing responsibility when abnormal BUN values are identified.
Because dehydration can significantly increase blood urea nitrogen levels, nurses should evaluate for signs such as:
Dry mucous membranes
Increased thirst
Reduced skin turgor
Hypotension
Tachycardia
Concentrated urine
Decreased urine output
Consider the following example:
An older adult is admitted after several days of vomiting and diarrhea. Laboratory testing reveals elevated BUN levels, while creatinine remains relatively stable. Physical assessment shows dry oral mucosa and poor skin turgor. In this scenario, dehydration may be the primary contributor to the abnormal laboratory findings.
Recognizing this relationship allows the healthcare team to initiate timely fluid replacement and monitor for improvement.
Monitoring Urine Output
Urine output provides valuable information about how well your kidneys are working.
Nurses should assess:
Total urine volume
Frequency of urination
Changes in urine characteristics
Fluid intake and output balance
Reduced urine output may indicate:
Acute kidney injury
Severe dehydration
Obstructive processes
Advanced renal dysfunction
Because the kidneys eliminate urea through urine, changes in urinary function often correlate with changes in BUN values.
Reviewing Medication History
Many medications can affect BUN levels directly or indirectly.
Examples include:
Diuretics
Nonsteroidal anti-inflammatory drugs (NSAIDs)
Corticosteroids
Certain antibiotics
Chemotherapy agents
Nurses should carefully review medication profiles and communicate concerns when drug-related renal effects are suspected.
For example, a patient receiving high-dose diuretic therapy may develop dehydration-related increases in blood urea nitrogen despite having no intrinsic kidney disease.
Assessing for Signs of Kidney Disease
Patients with abnormal BUN values should be assessed for symptoms associated with declining kidney function.
These may include:
Peripheral edema
Fatigue
Weakness
Nausea
Changes in urine output
Shortness of breath
Difficulty concentrating
Poor appetite
More advanced disease may be associated with symptoms of later-stage kidney disease, including significant fluid retention and metabolic disturbances.
Prompt recognition of these findings allows nurses to notify providers and facilitate further evaluation.
Identifying Risk Factors
Assessment should also include identification of factors that increase the risk for kidney disease.
Important risk factors include:
Diabetes mellitus
Hypertension
Cardiovascular disease
Advanced age
Family history of kidney disease
Smoking
Obesity
Understanding these risk factors helps place abnormal BUN values within the broader clinical context.
Understanding the BUN Blood Test
Patient Education About the BUN Test
Patient education is another essential nursing responsibility. Many patients become concerned when they hear that a laboratory result is abnormal, particularly when it involves kidney function. Clear, evidence-based education can reduce anxiety and promote informed participation in care.
Explaining What the BUN Test Is
Many patients are unfamiliar with the term blood urea nitrogen.
A simple explanation may include:
The BUN test measures the amount of a normal waste product in the blood. This waste product is produced when the body breaks down protein and is normally removed by the kidneys through urine.
Providing a straightforward explanation helps patients better understand the purpose of the test.
Explaining Why the Test Is Ordered
Patients should understand that healthcare providers may order a blood urea nitrogen test for many reasons, including:
Evaluating kidney function
Assessing hydration status
Monitoring chronic illnesses
Investigating abnormal symptoms
Monitoring treatment effectiveness
It is important to explain that the test does not automatically mean a patient has kidney disease.
For example, elevated values may occur because of dehydration, while reduced values may be associated with nutritional factors or liver conditions.
Educating Patients About Test Preparation
Patients often ask whether they need to prepare for testing.
Nurses should explain that:
Most individuals do not require extensive preparation.
Some patients may need to fast depending on accompanying laboratory studies.
Providers will give specific instructions if fasting is required.
Medications should only be adjusted under professional guidance.
Clarifying these points helps improve compliance and reduce confusion.
Explaining How the Test Is Performed
Many patients benefit from knowing what to expect during specimen collection.
The nurse can explain that:
A healthcare professional will obtain blood from a vein.
Usually a small amount of blood is required.
The procedure takes only a few minutes.
The blood sample is sent to a laboratory for analysis.
Providing this information can help reduce anxiety, especially in patients who are apprehensive about needles or laboratory testing.
Discussing Abnormal Results
Patients frequently assume that any abnormal laboratory value indicates serious illness.
Nurses should explain that:
A result outside the normal range does not automatically indicate disease.
Many factors can influence BUN values.
Additional testing may be necessary.
Results are interpreted together with other laboratory findings and clinical information.
For example, dehydration may temporarily increase BUN levels without causing permanent kidney damage.
Similarly, low protein intake may contribute to a low BUN value without indicating serious pathology.
Promoting Kidney Health
Patient education should also emphasize strategies that support healthy kidneys and help maintain values within the expected BUN Normal Range.
Key teaching points include:
Maintain Adequate Hydration
Encourage patients to:
Drink fluids regularly unless otherwise directed.
Increase fluid intake during illness when appropriate.
Recognize signs of dehydration.
Manage Chronic Conditions
Patients with diabetes or hypertension should understand the importance of:
Following prescribed treatment plans.
Monitoring blood pressure.
Controlling blood glucose levels.
Attending regular follow-up appointments.
These measures help reduce the risk of kidney damage.
Follow Healthy Lifestyle Practices
Recommendations may include:
Consuming a balanced diet.
Maintaining a healthy weight.
Avoiding tobacco use.
Engaging in regular physical activity.
Limiting unnecessary medication use.
Attend Recommended Monitoring Appointments
Patients with chronic kidney disease or other high-risk conditions should understand the importance of routine monitoring and follow-up testing.
Regular assessment allows healthcare providers to identify changes in renal function before serious complications develop.
Encouraging Questions and Participation
Effective patient education is a two-way process.
Nurses should encourage patients to ask questions such as:
What does my BUN result mean?
Do I need additional testing?
How can I improve my kidney health?
Should I change my diet or fluid intake?
What symptoms should I report?
Promoting patient engagement helps improve understanding, adherence, and overall health outcomes.
Ultimately, nursing care related to BUN testing extends well beyond obtaining a laboratory result. Nurses play a vital role in assessing hydration status, evaluating renal function, interpreting laboratory trends, monitoring for signs of kidney disease, and educating patients about the significance of their results. By combining thorough assessment with effective patient education, nurses help ensure accurate interpretation of blood urea nitrogen values and support optimal patient care across a wide range of clinical settings.
Confused about formatting or citations?
We’ll ensure your nursing assignment meets academic standards.
Understanding the BUN Normal Range is an important part of evaluating overall health, particularly the body’s ability to eliminate waste and maintain normal physiological balance. As one of the most commonly ordered laboratory measurements, blood urea nitrogen provides valuable information about protein metabolism, hydration status, and the efficiency with which the kidneys remove waste products from the bloodstream. Although a single BUN value cannot diagnose a specific condition, it serves as a useful starting point for assessing renal health and identifying potential abnormalities that may require further investigation.
Throughout this guide, it has become clear that BUN levels are influenced by a wide range of factors. While elevated values may be associated with dehydration, acute kidney injury, chronic kidney disease, or reduced blood flow to the kidneys, low values can result from conditions such as liver dysfunction, overhydration, malnutrition, or low protein intake. Because numerous variables can affect blood urea nitrogen levels, healthcare professionals must interpret results within the broader clinical context rather than relying on the test in isolation.
The relationship between BUN and creatinine, estimated glomerular filtration rate (GFR), urinalysis findings, and other kidney function tests is especially important. Together, these assessments provide a more complete picture of how well the kidneys are functioning and help clinicians distinguish between temporary physiological changes and significant underlying disease. This comprehensive approach improves diagnostic accuracy and supports appropriate treatment planning.
For nurses and other healthcare professionals, understanding BUN testing extends beyond recognizing normal and abnormal values. It involves assessing hydration status, identifying risk factors for kidney disease, monitoring trends in laboratory results, educating patients, and recognizing when additional evaluation is needed. These responsibilities play a critical role in promoting early detection, preventing complications, and supporting positive patient outcomes.
Ultimately, the BUN test remains a valuable tool in modern healthcare because it offers insight into one of the body’s most essential functions—the removal of metabolic waste. By understanding what blood urea nitrogen measures, how results are interpreted, and the factors that influence them, healthcare professionals and patients alike can make more informed decisions about kidney health, disease prevention, and long-term wellness.
Frequently Asked Questions
How to interpret BUN test results?
BUN (Blood Urea Nitrogen) test results should be interpreted alongside other factors such as creatinine levels, glomerular filtration rate (GFR), hydration status, symptoms, and medical history. A BUN value within the laboratory’s normal range generally indicates normal waste elimination, while high or low values may suggest dehydration, kidney dysfunction, liver disease, nutritional issues, or other medical conditions. Because many factors can affect BUN, healthcare providers rarely interpret it in isolation.
What is a dangerously high BUN?
There is no single BUN value that is considered dangerous for everyone because the significance depends on the patient’s overall condition. However, BUN levels above 50–60 mg/dL often warrant prompt medical evaluation, and levels exceeding 80–100 mg/dL may indicate severe kidney dysfunction, significant dehydration, gastrointestinal bleeding, or advanced kidney failure. The urgency depends on accompanying symptoms, creatinine levels, and overall clinical findings.
Should I worry about a low BUN?
Not necessarily. A low BUN is often less concerning than a high BUN and may result from factors such as low protein intake, pregnancy, overhydration, or mild nutritional deficiencies. However, persistently low values can sometimes be associated with liver disease, severe malnutrition, or other underlying health conditions. If a low BUN occurs alongside other abnormal test results or symptoms, further evaluation may be needed.
How do you fix a high BUN?
Treatment for a high BUN focuses on addressing the underlying cause rather than lowering the number itself. Depending on the reason for the elevation, management may include:
Increasing fluid intake if dehydration is present.
Treating underlying kidney disease or acute kidney injury.
Managing conditions such as heart failure or infections.
Reviewing medications that may affect kidney function.
Adjusting dietary protein intake when appropriate.
Receiving dialysis in severe cases of kidney failure.
The best approach depends on why the BUN level is elevated, so treatment should be guided by a healthcare professional after a complete evaluation.
Cranial Nerve Mnemonic: How to Remember the 12 Cranial Nerves, Anatomy, and Function
Introduction to the 12 Cranial Nerves
The cranial nerves are among the most important structures in the human nervous system because they directly connect the brain to the head, neck, and several vital sensory organs. These nerves play a central role in communication between the brain and the body, helping regulate essential activities such as vision, smell, hearing, facial movement, swallowing, eye movement, taste, and balance. Because many neurological conditions affect cranial nerve function, understanding these nerves is essential in anatomy, physiology, neurological assessment, and clinical practice.
Unlike spinal nerves, which emerge from the spinal cord, the cranial nerves originate in the brain and brainstem. Together, the cranial nerves are twelve pairs of nerves, and each pair has a distinct name, Roman numeral designation, anatomical pathway, and physiological role. The nerves are named and numbered from CN I through CN XII based on their location and order of emergence from the brain.
The 12 cranial nerves include:
Olfactory nerve (CN I)
Optic nerve (CN II)
Oculomotor nerve (CN III)
Trochlear nerve (CN IV)
Trigeminal nerve (CN V)
Abducens nerve (CN VI)
Facial nerve (CN VII)
Vestibulocochlear nerve (CN VIII)
Glossopharyngeal nerve (CN IX)
Vagus nerve (CN X)
Accessory nerve (CN XI)
Hypoglossal nerve (CN XII)
Each cranial nerve performs highly specialized functions. Some are responsible for sensory input, others control motor activity, and several perform both sensory and motor functions. For example:
The olfactory nerve is responsible for smell.
The optic nerve controls vision.
The vestibulocochlear nerve regulates hearing and balance.
The trigeminal nerve provides facial sensation and controls the muscles of mastication.
The hypoglossal nerve controls tongue movement.
The glossopharyngeal and vagus nerves contribute to swallowing and the gag reflex.
Because these nerves control many critical body processes, even minor cranial nerve dysfunction can produce noticeable neurological symptoms. A patient with facial nerve damage may develop facial paralysis, while dysfunction of the vestibulocochlear nerve may lead to hearing loss or impaired balance. Similarly, injury to the oculomotor, trochlear, or abducens nerves can affect eye movement and visual coordination.
One of the greatest challenges when studying the cranial nerves is memorization. Learners must remember:
The names of all twelve nerves
Their Roman numeral order
Whether they are sensory, motor, or mixed
Their anatomical pathways
Their major innervation patterns
Their clinical functions
Common examination findings associated with each nerve
This is where the use of a Cranial Nerve Mnemonic becomes extremely valuable. A mnemonic device simplifies complex neurological information into organized memory patterns that improve recall and understanding. Cranial nerves mnemonic techniques are widely used in anatomy education because they help learners quickly remember nerve names, functions, and classifications during exams and clinical assessments.
For example, many mnemonic strategies are designed to help remember:
The order of the 12 cranial nerves
Which nerves are sensory and motor
Major functions associated with each CN
Key examination findings during a neurological test
The use of a Cranial Nerve Mnemonic is particularly helpful during neurological exams because rapid recall is often necessary when assessing a patient. During bedside assessment, healthcare professionals may need to quickly identify which cranial nerve is responsible for abnormalities involving:
Facial sensation
Visual disturbances
Swallowing difficulty
Tongue deviation
Hearing impairment
Jaw weakness
Loss of smell
Neck movement abnormalities
Understanding cranial nerve anatomy also provides important insight into brain physiology and neurological disease processes. Since many cranial nerves originate in the brainstem, abnormalities affecting these structures may indicate stroke, trauma, tumors, infection, or neurodegenerative disease. Knowledge of cranial nerve innervation patterns therefore helps connect symptoms to specific neurological pathways and regions of the brain.
This guide provides a comprehensive discussion of cranial nerve anatomy, physiology, functions, mnemonic strategies, neurological examination techniques, and clinical relevance. It explores how the cranial nerves work individually and together, how they are tested during physical assessment, and how dysfunction can affect normal sensory and motor activities. In addition, the guide explains practical Cranial Nerve Mnemonic techniques designed to improve memorization, strengthen understanding, and support accurate neurological assessment in both academic and clinical settings.
Behind on multiple nursing assignments?
Our team will handle them while you focus on learning and clinical work.
Why Cranial Nerves Matter in Nursing and Brain Function
The cranial nerves are essential components of the nervous system because they serve as direct communication pathways between the brain and many sensory organs, muscles, and internal structures of the head and neck. These nerves regulate several vital activities required for normal daily function, including vision, smell, hearing, swallowing, eye movement, facial expression, tongue control, speech, and balance. Since many neurological disorders first present through cranial nerve abnormalities, understanding cranial nerve anatomy and physiology is extremely important in nursing assessment and patient care.
In healthcare settings, cranial nerve assessment helps identify whether neurological dysfunction is affecting the brain, brainstem, or peripheral nervous system. Changes involving sensory perception, motor movement, or reflex responses may indicate serious neurological conditions requiring immediate evaluation. For this reason, cranial nerve examination is considered an essential part of the neurological exam.
The cranial nerves influence numerous functions that nurses assess routinely, including:
Visual function
Hearing and balance
Facial sensation
Speech and swallowing
Tongue movement
Eye coordination
Neck strength
Sense of smell
Gag reflex responses
Abnormal findings during cranial nerve testing may help detect:
Stroke
Brain tumors
Increased intracranial pressure
Traumatic brain injury
Multiple sclerosis
Bell’s palsy
Brainstem lesions
Neuromuscular disorders
Infections affecting the nervous system
For example, a patient experiencing facial drooping on one side may have dysfunction involving the facial nerve (CN VII). Similarly, impaired eye movement may indicate abnormalities involving the oculomotor nerve (CN III), trochlear nerve (CN IV), or abducens nerve (CN VI). Difficulty swallowing and an absent gag reflex may suggest glossopharyngeal nerve (CN IX) or vagus nerve (CN X) dysfunction.
Because these nerves control highly specific anatomical structures, identifying which cranial nerve is affected can help localize neurological damage within the brain or brainstem. This makes cranial nerve assessment valuable in emergency medicine, critical care, neurology, trauma care, and routine physical examination.
Cranial nerves are also important because they regulate both sensory and motor activities. Some nerves carry sensory information from organs to the brain, while others transmit motor signals from the brain to muscles and glands. Several nerves perform sensory and motor functions simultaneously.
Examples include:
The olfactory nerve (CN I), which controls smell
The optic nerve (CN II), which controls vision
The vestibulocochlear nerve (CN VIII), which regulates hearing and balance
The trigeminal nerve (CN V), which provides facial sensation and controls the muscles of mastication
The hypoglossal nerve (CN XII), which controls tongue movement
The ability to distinguish sensory, motor, and mixed cranial nerves is an important neurological concept because different types of dysfunction produce different clinical findings. A purely sensory nerve injury may result in loss of sensation, while a motor nerve injury may produce weakness or paralysis. Mixed nerve dysfunction may affect both sensation and movement simultaneously.
One reason the cranial nerves are often difficult to learn is the large amount of information associated with each nerve. Learners must remember:
The cranial nerve name
Roman numeral designation
Anatomical origin
Sensory or motor classification
Innervation pattern
Physiological function
Clinical test findings
This is why the use of a Cranial Nerve Mnemonic is widely recommended in anatomy and neurological education. A mnemonic device helps organize complex information into memorable patterns that improve recall during study and patient assessment. Cranial nerves mnemonic strategies are especially useful when remembering:
The order of CN I–XII
Sensory and motor classifications
Major nerve functions
Common clinical associations
For example, many learners use a Cranial Nerve Mnemonic to remember that:
CN I is associated with smell
CN II controls visual input
CN VIII regulates cochlear and vestibular function
CN V controls jaw sensation and muscles of mastication
In clinical nursing practice, rapid recall of these functions is important because neurological changes can occur suddenly. Early recognition of cranial nerve dysfunction may help prevent complications and improve patient outcomes.
Cranial nerve knowledge is also closely connected to brain physiology. Since many of the cranial nerves originate in the brainstem, abnormalities affecting these nerves often reflect deeper neurological problems involving the midbrain, pons, or medulla. Damage to these areas may interfere with sensory processing, motor coordination, autonomic regulation, and consciousness.
In neurological assessment, the cranial nerves provide important information about overall brain function. Even subtle abnormalities involving vision, hearing, swallowing, eye movement, or facial sensation may signal significant underlying pathology. Because of this, cranial nerve testing remains a fundamental part of comprehensive patient evaluation.
Overview of Cranial Nerve Anatomy and Classification
The cranial nerves are twelve pairs of nerves that originate in the brain and brainstem. Unlike spinal nerves, which emerge from the spinal cord, cranial nerves primarily serve structures of the head and neck, although some extend into the thoracic and abdominal cavities. These nerves are named and numbered using Roman numerals from CN I through CN XII according to their anatomical position and sequence of emergence from the brain.
The twelve cranial nerves include:
Olfactory nerve (CN I)
Optic nerve (CN II)
Oculomotor nerve (CN III)
Trochlear nerve (CN IV)
Trigeminal nerve (CN V)
Abducens nerve (CN VI)
Facial nerve (CN VII)
Vestibulocochlear nerve (CN VIII)
Glossopharyngeal nerve (CN IX)
Vagus nerve (CN X)
Accessory nerve (CN XI)
Hypoglossal nerve (CN XII)
These cranial nerves are twelve pairs of nerves because each nerve exists on both the left and right sides of the body. Together, the twelve pairs of nerves create a highly organized communication system responsible for transmitting sensory information and motor commands between the brain and peripheral structures.
Cranial nerve anatomy is closely associated with the brainstem, which consists of:
The midbrain
The pons
The medulla oblongata
Most cranial nerves originate from one of these brainstem regions. However:
The olfactory nerve and optic nerve originate from the cerebrum
The accessory nerve partially arises from the spinal cord
The cranial nerves can be classified into three major functional categories:
Sensory Cranial Nerves
These nerves carry sensory information from sensory organs to the brain.
Purely sensory nerves include:
CN I (olfactory) — smell
CN II (optic) — vision
CN VIII (vestibulocochlear) — hearing and balance
These nerves are responsible for interpreting environmental stimuli and transmitting sensory signals to the central nervous system.
Motor Cranial Nerves
Motor cranial nerves control muscle movement and glandular activity.
Primarily motor nerves include:
CN III (oculomotor)
CN IV (trochlear)
CN VI (abducens)
CN XI (accessory)
CN XII (hypoglossal)
These nerves regulate:
Eye movement
Neck movement
Tongue movement
Shoulder elevation
For example:
The oculomotor nerve controls most extraocular muscles
The trochlear nerve controls superior oblique eye movement
The abducens nerve controls lateral eye movement
The hypoglossal nerve controls tongue muscles
Mixed Cranial Nerves
Mixed cranial nerves perform both sensory and motor functions.
These include:
CN V (trigeminal)
CN VII (facial)
CN IX (glossopharyngeal)
CN X (vagus)
These nerves participate in:
Facial sensation
Taste
Swallowing
Speech
Parasympathetic regulation
Muscles of mastication
The trigeminal nerve, for example, provides sensation to the face while also controlling jaw movement. The glossopharyngeal nerve contributes to swallowing and sense of taste, while the vagus nerve regulates autonomic functions affecting the heart, lungs, and digestive system.
Cranial nerve anatomy also involves complex innervation patterns. Each nerve travels through specific foramina in the skull and supplies targeted muscles, glands, or sensory receptors. Understanding these pathways is essential because lesions affecting different portions of a nerve may produce distinct neurological symptoms.
For example:
Damage to CN VIII may impair cochlear hearing or vestibular balance
Injury to CN V may affect facial sensation or jaw movement
Dysfunction involving CN III may produce pupil abnormalities and impaired eye movement
Lesions involving CN XII may cause tongue deviation
Because of the complexity of cranial nerve anatomy, many learners use a Cranial Nerve Mnemonic to improve memorization and recall. Mnemonic strategies help organize information related to nerve names, classifications, functions, and clinical findings into structured memory patterns that are easier to remember during exams and neurological assessment.
A strong understanding of cranial nerve anatomy and classification provides the foundation for accurate neurological examination, interpretation of clinical symptoms, and recognition of cranial nerve dysfunction in patient care settings.
Cranial Nerve Names, Numbers, and Functions
The cranial nerves are twelve pairs of nerves that originate in the brain and brainstem and are responsible for carrying sensory information, controlling motor activity, and regulating several autonomic functions. Each cranial nerve has a specific name, Roman numeral designation, anatomical pathway, and physiological role. Because the cranial nerves control many essential activities such as vision, hearing, swallowing, facial movement, smell, and balance, understanding their names, numbers, and functions is fundamental in neurological assessment and clinical practice.
The cranial nerves are named and numbered from CN I through CN XII according to the order in which they emerge from the brain. This numbering system uses Roman numerals and helps organize the nerves anatomically and clinically. Learning the correct order is important because neurological examinations, patient documentation, and clinical communication frequently refer to cranial nerves by their Roman numeral designation.
One of the most effective ways to remember the order of the nerves is through the use of a Cranial Nerve Mnemonic. Mnemonic devices simplify memorization by converting complex neurological information into structured memory patterns. A Cranial Nerve Mnemonic is commonly used in anatomy and physiology because learners must remember:
The names of all twelve nerves
Their Roman numeral order
Their sensory and motor classifications
Their major functions
Important clinical associations
The 12 cranial nerves include:
Roman Numeral
Cranial Nerve Name
Primary Function Type
CN I
Olfactory
Sensory
CN II
Optic
Sensory
CN III
Oculomotor
Motor
CN IV
Trochlear
Motor
CN V
Trigeminal
Mixed
CN VI
Abducens
Motor
CN VII
Facial
Mixed
CN VIII
Vestibulocochlear
Sensory
CN IX
Glossopharyngeal
Mixed
CN X
Vagus
Mixed
CN XI
Accessory
Motor
CN XII
Hypoglossal
Motor
These cranial nerves work together to coordinate communication between the brain and structures throughout the head and neck. Some nerves primarily carry sensory signals to the brain, while others transmit motor commands from the brain to muscles and glands. Several nerves perform both sensory and motor functions simultaneously.
Understanding these functions is essential because dysfunction affecting a specific cranial nerve often produces characteristic neurological symptoms.
For example:
Damage to the optic nerve may cause visual loss.
Injury to the facial nerve may produce facial paralysis.
Dysfunction involving the vestibulocochlear nerve may affect hearing and balance.
Lesions involving the hypoglossal nerve may impair tongue movement.
Trigeminal nerve abnormalities may affect facial sensation and jaw movement.
Because of the large amount of information associated with each nerve, many learners use cranial nerves mnemonic strategies to improve memory and rapid recall during neurological exams and patient assessment.
The 12 Cranial Nerves in Order
CN I — Olfactory Nerve
The olfactory nerve is a purely sensory cranial nerve responsible for smell. Specialized receptors within the nose detect odor molecules and transmit signals to the olfactory bulbs and brain.
Primary function:
Sense of smell
Clinical relevance:
Loss of smell may occur in head trauma, neurodegenerative disease, or upper respiratory disorders.
CN II — Optic Nerve
The optic nerve is responsible for visual input. It carries information from the retina to the visual cortex of the brain.
Primary function:
Vision
Clinical relevance:
Damage may cause visual field defects, blindness, or impaired pupillary responses.
CN III — Oculomotor Nerve
The oculomotor nerve is primarily motor and controls most eye movements. It also regulates pupil constriction and eyelid elevation.
Primary functions:
Eye movement
Pupillary constriction
Eyelid elevation
Clinical relevance:
Dysfunction may cause ptosis, pupil dilation, and impaired eye movement.
CN IV — Trochlear Nerve
The trochlear nerve controls the superior oblique muscle of the eye.
Primary function:
Downward and inward eye movement
Clinical relevance:
Injury may produce diplopia and difficulty looking downward.
CN V — Trigeminal Nerve
The trigeminal nerve is the largest cranial nerve and performs both sensory and motor functions.
Sensory functions:
Facial sensation
Sensation from the scalp, cornea, and oral cavity
Motor functions:
Muscles of mastication
Clinical relevance:
CN V dysfunction may cause jaw weakness, facial numbness, or trigeminal neuralgia.
CN VI — Abducens Nerve
The abducens nerve controls the lateral rectus muscle.
Primary function:
Lateral eye movement
Clinical relevance:
Damage may prevent lateral gaze and cause diplopia.
CN VII — Facial Nerve
The facial nerve performs sensory and motor functions.
Functions include:
Facial expression
Taste from the anterior tongue
Tear and saliva production
Clinical relevance:
Dysfunction may produce Bell’s palsy, facial drooping, or loss of taste.
CN VIII — Vestibulocochlear Nerve
The vestibulocochlear nerve is a sensory nerve responsible for:
Hearing
Balance
The cochlear division regulates hearing, while the vestibular division controls equilibrium and spatial orientation.
Clinical relevance:
Dysfunction may cause vertigo, hearing loss, tinnitus, or balance disorders.
CN IX — Glossopharyngeal Nerve
The glossopharyngeal nerve performs sensory and motor functions.
Functions include:
Swallowing
Taste from the posterior tongue
Gag reflex contribution
Clinical relevance:
Damage may impair swallowing and gag reflex responses.
CN X — Vagus Nerve
The vagus nerve is one of the most important mixed cranial nerves because it extends beyond the head and neck into the thoracic and abdominal cavities.
Functions include:
Swallowing
Speech
Parasympathetic regulation
Heart and digestive activity
Clinical relevance:
Dysfunction may cause hoarseness, swallowing difficulty, or autonomic instability.
CN XI — Accessory Nerve
The accessory nerve controls muscles of the neck and shoulders.
Primary functions:
Head rotation
Shoulder elevation
Clinical relevance:
Injury may cause weakness during head turning or shoulder shrugging.
CN XII — Hypoglossal Nerve
The hypoglossal nerve controls tongue movement.
Primary function:
Tongue movement during speech and swallowing
Clinical relevance:
Dysfunction may cause tongue deviation and speech difficulty.
Sensory, Motor, and Mixed Cranial Nerve Function
The cranial nerves are classified according to whether they perform sensory, motor, or mixed functions. This classification helps explain how the nervous system processes information and coordinates movement.
Sensory Cranial Nerves
Sensory cranial nerves carry information from sensory organs to the brain.
Pure sensory nerves include:
CN I — Olfactory
CN II — Optic
CN VIII — Vestibulocochlear
These nerves regulate:
Smell
Vision
Hearing
Balance
Sensory dysfunction commonly presents as:
Hearing loss
Visual disturbances
Loss of smell
Vertigo
Motor Cranial Nerves
Motor cranial nerves transmit signals from the brain to muscles.
Primarily motor nerves include:
CN III — Oculomotor
CN IV — Trochlear
CN VI — Abducens
CN XI — Accessory
CN XII — Hypoglossal
These nerves regulate:
Eye movement
Neck movement
Tongue movement
Shoulder movement
Motor dysfunction may produce:
Weakness
Paralysis
Abnormal eye positioning
Difficulty speaking
Mixed Cranial Nerves
Mixed cranial nerves perform both sensory and motor functions.
Mixed nerves include:
CN V — Trigeminal
CN VII — Facial
CN IX — Glossopharyngeal
CN X — Vagus
These nerves coordinate:
Facial sensation
Taste
Swallowing
Speech
Muscles of mastication
Parasympathetic activity
Because mixed nerves perform multiple roles, dysfunction often affects both sensation and movement simultaneously.
For example:
Facial nerve injury may impair both facial movement and taste.
Glossopharyngeal dysfunction may affect swallowing and sensory reflexes.
Trigeminal nerve injury may alter facial sensation and jaw movement.
Understanding these classifications is important during neurological exams because symptoms often help identify whether sensory pathways, motor pathways, or both are involved.
Key Innervation and Physiology Concepts
Cranial nerve physiology involves the transmission of electrical signals between the brain and peripheral structures. These nerves use specialized fibers to transmit sensory information and motor commands rapidly and accurately.
Each cranial nerve follows a specific innervation pattern, meaning it supplies designated muscles, glands, sensory organs, or tissues.
Examples include:
The optic nerve innervates structures associated with visual processing.
The trigeminal nerve innervates facial sensory regions and muscles of mastication.
The facial nerve innervates muscles responsible for facial expression.
The hypoglossal nerve innervates tongue muscles.
The vagus nerve provides parasympathetic innervation to thoracic and abdominal organs.
Many cranial nerves originate in the brainstem, specifically within:
The midbrain
The pons
The medulla oblongata
Because of this close relationship, brainstem lesions frequently affect cranial nerve function.
Physiology concepts associated with cranial nerves include:
Sensory signal transmission
Motor coordination
Reflex regulation
Autonomic control
Balance and equilibrium
Visual processing
Hearing pathways
For example:
The vestibulocochlear nerve contains cochlear fibers for hearing and vestibular fibers for balance.
The oculomotor, trochlear, and abducens nerves coordinate eye movement together.
The glossopharyngeal and vagus nerves contribute to swallowing physiology and gag reflex responses.
Understanding cranial nerve physiology is essential because it explains how neurological dysfunction develops. Damage affecting a nerve pathway may interrupt normal sensory transmission or motor control, resulting in predictable clinical symptoms.
Because the amount of anatomical and physiological information can be extensive, many learners rely on a Cranial Nerve Mnemonic to improve memorization and strengthen understanding of cranial nerve classification, innervation, and function.
The 12 Cranial Nerve Mnemonic
Cranial Nerve Mnemonic Strategies and Memory Tips
Learning the cranial nerves is often considered one of the more challenging parts of neuroanatomy because each nerve must be remembered according to its name, Roman numeral designation, anatomy, sensory or motor classification, innervation pattern, and physiological function. In addition, many neurological exams require rapid recall of cranial nerve information during patient assessment. Because of the large amount of detail involved, the use of a Cranial Nerve Mnemonic is one of the most effective methods for improving memorization and long-term retention.
A mnemonic is a structured memory device designed to help organize complex information into simpler and easier-to-remember patterns. In anatomy and physiology education, mnemonic strategies are widely used because they improve memory recall, strengthen understanding, and reduce confusion when studying large groups of related concepts. Cranial nerves mnemonic techniques are especially valuable because the twelve cranial nerves must be remembered in precise order from CN I through CN XII.
A well-developed Cranial Nerve Mnemonic can help improve recall of:
The names of the 12 cranial nerves
Roman numeral order
Sensory, motor, and mixed classifications
Major physiological functions
Key examination findings
Clinical associations linked to cranial nerve dysfunction
Many learners initially struggle because the cranial nerves contain unfamiliar terminology such as:
Oculomotor
Trochlear
Vestibulocochlear
Glossopharyngeal
Hypoglossal
Without an organized memory strategy, remembering these names and functions can become difficult. Mnemonic devices simplify this process by creating memorable verbal associations that improve retention during exams and clinical application.
Another reason Cranial Nerve Mnemonic strategies are important is that neurological assessment often requires rapid thinking. During patient evaluation, healthcare professionals may need to quickly identify:
Which nerve controls a specific function
Whether a nerve is sensory or motor
Which cranial nerve is associated with a particular symptom
How a neurological deficit relates to brain anatomy
For example:
Facial drooping may suggest facial nerve dysfunction.
Difficulty swallowing may involve the glossopharyngeal or vagus nerves.
Visual disturbances may indicate optic nerve abnormalities.
Jaw weakness may involve CN V and the muscles of mastication.
Impaired eye movement may indicate dysfunction involving CN III, CN IV, or CN VI.
Because neurological findings often depend on accurate cranial nerve identification, strong memorization techniques can improve both confidence and clinical reasoning.
Effective Cranial Nerve Mnemonic strategies usually combine:
Repetition
Visualization
Association
Active recall
Clinical application
Combining these methods strengthens memory pathways within the brain and improves long-term retention of complex neurological concepts.
Classic Cranial Nerves Mnemonic Devices
Classic mnemonic devices are among the most commonly used study tools for remembering the names and classifications of the cranial nerves. These mnemonic phrases organize information into memorable word patterns that correspond directly to the Roman numeral order of the nerves.
Mnemonic for Cranial Nerve Names
One of the most widely recognized Cranial Nerve Mnemonic phrases for remembering the names of the nerves is:
“Oh, Oh, Oh, To Touch And Feel Very Good Velvet, AH!”
This mnemonic corresponds to:
Roman Numeral
Cranial Nerve
CN I
Olfactory
CN II
Optic
CN III
Oculomotor
CN IV
Trochlear
CN V
Trigeminal
CN VI
Abducens
CN VII
Facial
CN VIII
Vestibulocochlear
CN IX
Glossopharyngeal
CN X
Vagus
CN XI
Accessory
CN XII
Hypoglossal
This type of mnemonic device helps learners remember the correct sequence of the cranial nerves quickly and efficiently.
Mnemonic for Sensory, Motor, and Mixed Functions
Another important Cranial Nerve Mnemonic helps classify nerves according to whether they are sensory, motor, or both sensory and motor.
A commonly used mnemonic is:
“Some Say Marry Money, But My Brother Says Big Brains Matter More.”
This corresponds to:
S = Sensory
M = Motor
B = Both sensory and motor
Cranial Nerve
Classification
CN I
Sensory
CN II
Sensory
CN III
Motor
CN IV
Motor
CN V
Both
CN VI
Motor
CN VII
Both
CN VIII
Sensory
CN IX
Both
CN X
Both
CN XI
Motor
CN XII
Motor
This mnemonic is particularly useful during neurological exams because classification often helps identify the type of dysfunction present.
For example:
Sensory nerve damage may affect vision, smell, hearing, or sensation.
Motor nerve damage may produce weakness or abnormal movement.
Mixed nerve dysfunction may affect both sensation and movement simultaneously.
Why Classic Mnemonics Work
Classic mnemonic devices improve memorization because they:
Organize information into predictable patterns
Reduce cognitive overload
Improve recall speed
Strengthen long-term memory retention
Make complex terminology easier to remember
They are especially useful when studying:
Cranial nerve order
Sensory and motor functions
Neurological exam findings
Anatomy and physiology concepts
Repeated use of a Cranial Nerve Mnemonic during review sessions gradually strengthens recall pathways within the brain, making it easier to retrieve information during tests and patient care.
Mnemonics to Remember Cranial Nerve Function
Remembering the names of the cranial nerves is only one part of neurological learning. It is also important to remember the primary function of each nerve and how dysfunction affects patient presentation.
Functional mnemonic strategies help connect individual cranial nerves with their major physiological roles.
Functional Associations for Memory
Many learners remember cranial nerve function by associating each nerve with its most recognizable clinical role.
Examples include:
Cranial Nerve
Primary Function Association
CN I
Smell
CN II
Vision
CN III
Eye movement
CN IV
Downward eye movement
CN V
Facial sensation and jaw movement
CN VI
Lateral eye movement
CN VII
Facial expression
CN VIII
Hearing and balance
CN IX
Swallow and gag reflex
CN X
Voice and swallowing
CN XI
Neck movement
CN XII
Tongue movement
Breaking cranial nerve physiology into functional categories makes memorization easier because the brain retains organized information more effectively than isolated facts.
Grouping Similar Functions
Another effective memory tip involves grouping nerves according to related physiological activities.
Cranial Nerves Involved in Eye Movement
CN III
CN IV
CN VI
Cranial Nerves Associated With Taste and Swallowing
CN VII
CN IX
CN X
Cranial Nerves Responsible for Hearing and Balance
CN VIII
Cranial Nerves Involved in Facial Sensation and Movement
CN V
CN VII
Grouping related nerves improves understanding of anatomy and physiology while reducing memorization difficulty.
Clinical Function Associations
Linking cranial nerve function to patient symptoms also improves memory retention.
Examples:
Facial paralysis → CN VII dysfunction
Tongue deviation → CN XII dysfunction
Loss of smell → CN I dysfunction
Hearing loss → CN VIII dysfunction
Difficulty swallowing → CN IX or CN X dysfunction
Jaw weakness → CN V dysfunction
This method strengthens clinical reasoning while reinforcing neurological anatomy concepts.
Visual Memory Techniques and Study Tips for Nurses
Visual learning strategies are highly effective for mastering cranial nerve anatomy because the nervous system involves complex pathways and interconnected brain structures. Visual memory techniques help learners create mental images that strengthen understanding and improve recall during exams and neurological assessments.
Using Anatomical Diagrams
One of the most effective study methods involves repeatedly reviewing labeled anatomical diagrams of:
The brainstem
Cranial nerve pathways
Sensory and motor regions
Innervation patterns
Visual repetition improves familiarity with:
Cranial nerve origin points
Pathways through the skull
Target muscles and sensory organs
Brainstem anatomy
Color-coded diagrams can further improve memorization by separating:
Sensory nerves
Motor nerves
Mixed nerves
Creating Visual Associations
Visual association techniques involve linking a cranial nerve to an image representing its function.
Examples:
Olfactory nerve → nose and smell
Optic nerve → eyes and vision
Vestibulocochlear nerve → ears and balance
Hypoglossal nerve → tongue movement
These visual connections help reinforce long-term memory retention.
Flashcards and Active Recall
Flashcards remain one of the most effective memory tools for cranial nerve study.
Useful flashcard topics include:
Cranial nerve names
Roman numerals
Functions
Sensory and motor classifications
Clinical dysfunction findings
Active recall techniques force the brain to retrieve information repeatedly, which strengthens memory pathways and improves long-term retention.
Repetition and Spaced Review
Repeated review is essential for mastering cranial nerve anatomy and physiology. Spaced repetition helps prevent forgetting by reviewing information at gradually increasing intervals.
This method improves:
Memory retention
Recall speed
Exam performance
Clinical confidence
Applying Mnemonics During Neurological Exams
Using a Cranial Nerve Mnemonic during patient assessment can improve organization and accuracy during neurological testing.
For example, during a cranial nerve exam:
CN I may be tested using smell identification.
CN II may be evaluated through visual testing.
CN V may be assessed using facial sensation and jaw movement.
CN VIII may be tested using hearing and balance assessments.
CN XII may be evaluated through tongue movement.
Connecting mnemonic recall directly to physical examination strengthens both memory and clinical understanding.
Study Tips for Long-Term Retention
Effective study strategies for cranial nerves include:
Reviewing cranial nerves daily
Using mnemonic devices consistently
Practicing neurological assessments
Drawing cranial nerve diagrams
Explaining functions aloud
Associating symptoms with dysfunction
Using clinical case examples
Combining these techniques with a strong Cranial Nerve Mnemonic improves memorization, strengthens neurological understanding, and enhances confidence during exams and patient care.
Functional Anatomy of the Cranial Nerves
The functional anatomy of the cranial nerves refers to the relationship between cranial nerve structure, innervation pathways, physiology, and the specific functions each nerve performs within the body. The cranial nerves are twelve pairs of nerves that originate in the brain and brainstem and are responsible for regulating essential sensory and motor activities involving the head, neck, and several internal structures. Understanding the functional anatomy of these nerves is important because neurological symptoms often develop when specific cranial nerve pathways become damaged or impaired.
Each cranial nerve has:
A unique anatomical origin
A specialized pathway
A designated innervation pattern
A distinct physiological role
Some cranial nerves are purely sensory, others are primarily motor, and several perform both sensory and motor functions. Together, the nerves coordinate activities such as:
Smell
Vision
Eye movement
Facial sensation
Facial expression
Hearing
Balance
Swallowing
Speech
Tongue movement
Functional anatomy also explains why different cranial nerve lesions produce characteristic symptoms. For example:
Damage to the optic nerve affects vision.
Dysfunction involving the vestibulocochlear nerve impairs hearing and balance.
Injury to the facial nerve alters facial expression.
Because the cranial nerves travel through highly organized anatomical pathways, identifying symptoms often helps localize dysfunction to a specific nerve or region of the brainstem.
A strong understanding of functional anatomy is also important during neurological exams because clinicians must connect patient symptoms with underlying nerve physiology and innervation patterns. This process is made easier through the use of a Cranial Nerve Mnemonic, which helps organize the nerves according to their names, functions, and classifications.
Cranial Nerves Responsible for Smell, Vision, and Eye Movement
Several cranial nerves are responsible for special sensory functions involving smell and vision, while others coordinate the complex motor movements required for eye positioning and visual tracking.
Olfactory Nerve (CN I) — Smell
The olfactory nerve is a purely sensory cranial nerve responsible for smell. It originates from specialized olfactory receptor cells located within the upper portion of the nasal cavity. These receptors detect odor molecules and transmit sensory information through the olfactory bulbs to the brain.
Primary function:
Sense of smell
Anatomy and physiology:
Olfactory receptors are located within the nasal mucosa.
Nerve fibers pass through the cribriform plate of the ethmoid bone.
Signals travel directly to the olfactory cortex.
Unlike many sensory pathways, olfactory processing reaches the brain without first passing through the thalamus. This unique physiology explains the strong connection between smell, memory, and emotional responses.
Clinical relevance:
Loss of smell may occur after head trauma, viral infection, neurodegenerative disease, or tumors affecting the frontal lobe.
Damage involving the cribriform plate may sever olfactory fibers and impair smell permanently.
Example: A patient who reports inability to detect coffee or perfume odors following a traumatic head injury may have olfactory nerve dysfunction.
Optic Nerve (CN II) — Vision
The optic nerve is responsible for transmitting visual information from the retina to the brain. It is considered an extension of the central nervous system because it develops directly from the brain during embryological formation.
Primary function:
Vision
Anatomy and physiology:
Retinal photoreceptors detect light stimuli.
Signals travel through retinal ganglion cells into the optic nerve.
Fibers partially cross at the optic chiasm.
Visual information continues through the optic tracts to the visual cortex.
The optic nerve is essential for:
Visual acuity
Peripheral vision
Color perception
Pupillary reflexes
Clinical relevance:
Optic nerve damage may produce blindness, blurred vision, or visual field defects.
Increased intracranial pressure may cause papilledema affecting the optic disc.
Diseases such as glaucoma and optic neuritis may impair optic nerve function.
Example: A patient with sudden unilateral visual loss and eye pain may have optic neuritis involving the optic nerve.
Oculomotor Nerve (CN III) — Eye Movement
The oculomotor nerve is primarily a motor cranial nerve that controls most extraocular eye muscles.
Primary functions:
Eye movement
Eyelid elevation
Pupillary constriction
Innervation includes:
Superior rectus muscle
Inferior rectus muscle
Medial rectus muscle
Inferior oblique muscle
Levator palpebrae superioris
Parasympathetic fibers also regulate pupil constriction.
Clinical relevance:
CN III dysfunction may produce ptosis, pupil dilation, and abnormal eye positioning.
Compression from increased intracranial pressure may affect the oculomotor nerve early.
Example: A patient with a dilated pupil and inability to move the eye upward may have oculomotor nerve compression.
Trochlear Nerve (CN IV) — Superior Oblique Eye Movement
The trochlear nerve controls the superior oblique muscle.
Primary function:
Downward and inward eye movement
The trochlear nerve is unique because:
It is the smallest cranial nerve.
It exits the dorsal surface of the brainstem.
Clinical relevance:
Dysfunction may produce vertical diplopia.
Patients may tilt the head to compensate for impaired eye movement.
Abducens Nerve (CN VI) — Lateral Eye Movement
The abducens nerve controls the lateral rectus muscle.
Primary function:
Lateral movement of the eye
Clinical relevance:
CN VI dysfunction causes inability to move the eye laterally.
Increased intracranial pressure commonly affects the abducens nerve.
Together, CN III, CN IV, and CN VI coordinate synchronized eye movement and visual tracking. Dysfunction affecting these nerves may result in:
Diplopia
Visual imbalance
Abnormal gaze
Impaired coordination
Cranial Nerves Involved in Facial Sensation, Expression, and Hearing
Several cranial nerves regulate sensory and motor functions involving the face, jaw, ears, and auditory pathways.
Trigeminal Nerve (CN V) — Facial Sensation and Mastication
The trigeminal nerve is the largest cranial nerve and performs both sensory and motor functions.
Sensory functions:
Facial sensation
Corneal sensation
Sensation from the scalp, nose, mouth, and teeth
Motor functions:
Muscles of mastication
The trigeminal nerve contains three major branches:
Ophthalmic division
Maxillary division
Mandibular division
Clinical relevance:
CN V dysfunction may produce facial numbness or jaw weakness.
Trigeminal neuralgia causes severe facial pain.
Example: A patient unable to clench the jaw properly may have trigeminal motor dysfunction affecting the muscles of mastication.
Facial Nerve (CN VII) — Facial Expression and Taste
The facial nerve performs sensory and motor functions.
Patients may present with facial drooping and inability to close one eye.
Example: A patient with unilateral facial weakness and loss of forehead movement may have peripheral facial nerve paralysis.
Vestibulocochlear Nerve (CN VIII) — Hearing and Balance
The vestibulocochlear nerve is a sensory cranial nerve responsible for hearing and balance.
It contains:
Cochlear fibers for hearing
Vestibular fibers for equilibrium
Physiology:
Cochlear receptors detect sound vibrations.
Vestibular receptors detect head position and movement.
Clinical relevance:
CN VIII dysfunction may cause vertigo, hearing loss, tinnitus, or imbalance.
Inner ear disorders often affect vestibulocochlear physiology.
Example: A patient with dizziness, nausea, and impaired balance may have vestibular dysfunction involving CN VIII.
Cranial Nerves That Control Swallowing, Speech, and Tongue Movement
Several lower cranial nerves regulate swallowing, speech, tongue movement, and autonomic functions.
Glossopharyngeal Nerve (CN IX)
The glossopharyngeal nerve performs sensory and motor functions.
Functions include:
Swallowing
Sense of taste from the posterior tongue
Gag reflex sensation
Clinical relevance:
Dysfunction may impair swallowing and gag reflex responses.
Vagus Nerve (CN X)
The vagus nerve is one of the most functionally important cranial nerves because it extends beyond the head and neck into thoracic and abdominal organs.
Functions include:
Swallowing
Speech
Parasympathetic regulation
Heart rate control
Gastrointestinal activity
Innervation includes:
Laryngeal muscles
Pharyngeal muscles
Thoracic organs
Abdominal organs
Clinical relevance:
Vagus nerve dysfunction may produce hoarseness, dysphagia, or autonomic instability.
Example: A patient with a weak voice and difficulty swallow may have vagus nerve impairment.
Accessory Nerve (CN XI)
The accessory nerve controls:
Sternocleidomastoid muscle
Trapezius muscle
Functions include:
Neck movement
Shoulder elevation
Clinical relevance:
Dysfunction may impair head rotation and shoulder shrugging.
Hypoglossal Nerve (CN XII)
The hypoglossal nerve is a motor cranial nerve responsible for tongue movement.
Functions include:
Tongue positioning
Speech articulation
Swallowing assistance
Clinical relevance:
Damage may cause tongue deviation toward the affected side.
Speech and swallowing may become impaired.
Example: During a neurological exam, tongue deviation on protrusion may indicate hypoglossal nerve dysfunction.
Together, CN IX, CN X, CN XI, and CN XII coordinate highly complex activities involving speech, swallowing, airway protection, and tongue control. Dysfunction involving these nerves may significantly affect nutrition, communication, and respiratory safety.
Because the functional anatomy of the cranial nerves is highly detailed, many learners use a Cranial Nerve Mnemonic to improve memorization of nerve names, functions, classifications, and innervation patterns. These mnemonic strategies help organize complex neurological information into structured memory systems that improve recall during exams and clinical practice.
Cranial Nerve Test and Neurological Exam Techniques
Cranial nerve assessment is an essential component of the neurological exam because it helps evaluate the integrity of the brain, brainstem, sensory pathways, and motor pathways. Since the cranial nerves regulate important activities such as vision, hearing, facial sensation, swallowing, balance, speech, and eye movement, abnormalities identified during testing may indicate neurological dysfunction involving specific regions of the nervous system.
A cranial nerve test allows healthcare professionals to assess:
Sensory function
Motor function
Reflex activity
Coordination
Muscle strength
Brainstem integrity
Neurological examination of the cranial nerves is important in many clinical settings, including:
Emergency departments
Intensive care units
Neurology clinics
Trauma care
Postoperative assessment
Routine physical examination
Changes involving cranial nerve function may indicate:
Stroke
Increased intracranial pressure
Brain tumors
Traumatic brain injury
Bell’s palsy
Multiple sclerosis
Meningitis
Brainstem lesions
Neurodegenerative disorders
Because the cranial nerves are twelve pairs of nerves that originate in the brain, systematic testing helps localize neurological abnormalities accurately. During examination, each cranial nerve is evaluated individually according to its anatomy, physiology, innervation pattern, and primary function.
One challenge during neurological exams is remembering:
The order of the cranial nerves
Which functions belong to each nerve
Which examination techniques assess specific nerves
How abnormalities relate to neurological dysfunction
For this reason, many learners and healthcare professionals use a Cranial Nerve Mnemonic to improve recall during patient assessment. Cranial nerves mnemonic techniques help organize neurological information efficiently and reduce confusion during exams.
For example, a Cranial Nerve Mnemonic may help quickly identify:
CN I → smell
CN II → vision
CN III, IV, VI → eye movement
CN V → facial sensation and jaw movement
CN VIII → hearing and balance
CN IX and X → swallowing and gag reflex
CN XII → tongue movement
Rapid recall is particularly important in emergency situations where neurological deterioration may occur suddenly.
Step-by-Step Cranial Nerve Exam Methods
A complete cranial nerve exam follows a systematic approach from CN I through CN XII. Each nerve is assessed according to its sensory, motor, or sensory and motor functions.
CN I — Olfactory Nerve Test
Primary function:
Smell
Testing method:
Ask the patient to close one nostril at a time.
Present familiar odors such as coffee or peppermint.
Ask the patient to identify the smell.
Normal findings:
Accurate smell identification bilaterally
Abnormal findings:
Loss of smell
Reduced smell sensation
Clinical relevance:
Dysfunction may occur in head trauma, neurodegenerative disease, or nasal pathology.
CN II — Optic Nerve Test
Primary function:
Vision
Testing methods:
Visual acuity assessment
Visual field testing
Pupillary response examination
Fundoscopic exam
Visual field testing:
The patient identifies objects within peripheral vision.
Pupillary assessment:
Light is directed into each eye to assess constriction.
Normal findings:
Intact visual fields
Equal pupil reaction
Normal visual acuity
Abnormal findings:
Visual loss
Peripheral field defects
Abnormal pupillary responses
CN III, CN IV, and CN VI — Eye Movement Tests
These nerves work together to coordinate eye movement.
Functions:
CN III → most eye movement and pupil constriction
CN IV → superior oblique movement
CN VI → lateral eye movement
Testing methods:
Assess extraocular movement using the six cardinal fields of gaze.
Observe for smooth eye tracking.
Evaluate pupil size and reactivity.
Normal findings:
Coordinated eye movement
No nystagmus
Equal pupils
Abnormal findings:
Diplopia
Ptosis
Abnormal gaze
Limited eye movement
Example: Failure of lateral eye movement may indicate abducens nerve dysfunction.
CN V — Trigeminal Nerve Test
Functions:
Facial sensation
Muscles of mastication
Sensory testing:
Assess forehead, cheek, and jaw sensation using light touch.
Motor testing:
Ask the patient to clench the jaw.
Evaluate strength of the muscles of mastication.
Reflex testing:
Corneal reflex assessment
Normal findings:
Symmetrical facial sensation
Strong jaw movement
Abnormal findings:
Facial numbness
Jaw weakness
Loss of corneal reflex
CN VII — Facial Nerve Test
Functions:
Facial expression
Taste
Tear production
Testing methods: Ask the patient to:
Smile
Raise eyebrows
Puff cheeks
Close eyes tightly
Normal findings:
Symmetrical facial movement
Abnormal findings:
Facial drooping
Inability to close the eye
Forehead weakness
Clinical relevance:
Bell’s palsy commonly affects CN VII.
CN VIII — Vestibulocochlear Nerve Test
Functions:
Hearing
Balance
Testing methods:
Whisper test
Weber test
Rinne test
Balance assessment
Normal findings:
Intact hearing
Stable balance
Abnormal findings:
Hearing loss
Vertigo
Tinnitus
Impaired balance
The vestibulocochlear nerve contains:
Cochlear fibers for hearing
Vestibular fibers for balance
CN IX and CN X — Glossopharyngeal and Vagus Nerve Test
Functions:
Swallowing
Gag reflex
Speech
Testing methods:
Assess swallowing ability.
Evaluate gag reflex.
Observe palate elevation.
Listen for voice quality.
Normal findings:
Symmetrical palate movement
Intact gag reflex
Clear speech
Abnormal findings:
Dysphagia
Hoarseness
Absent gag reflex
CN XI — Accessory Nerve Test
Functions:
Neck movement
Shoulder elevation
Testing methods:
Ask the patient to shrug shoulders against resistance.
Assess head rotation strength.
Normal findings:
Symmetrical shoulder strength
Strong neck movement
Abnormal findings:
Weak shoulder shrug
Impaired head rotation
CN XII — Hypoglossal Nerve Test
Primary function:
Tongue movement
Testing methods:
Ask the patient to protrude the tongue.
Assess tongue strength and symmetry.
Normal findings:
Midline tongue movement
Abnormal findings:
Tongue deviation
Fasciculations
Speech difficulty
Common Cranial Nerve Test Findings
Cranial nerve dysfunction often produces recognizable neurological patterns that help identify the affected nerve.
Common CN I Findings
Loss of smell
Reduced smell sensation
Common CN II Findings
Visual field loss
Blurred vision
Abnormal pupil responses
Common CN III, IV, VI Findings
Diplopia
Ptosis
Abnormal eye movement
Nystagmus
Common CN V Findings
Facial numbness
Jaw weakness
Impaired corneal reflex
Common CN VII Findings
Facial paralysis
Asymmetrical smile
Inability to close the eye
Common CN VIII Findings
Hearing impairment
Balance disturbances
Vertigo
Common CN IX and X Findings
Difficulty swallowing
Hoarseness
Abnormal gag reflex
Common CN XI Findings
Weak neck movement
Shoulder weakness
Common CN XII Findings
Tongue deviation
Slurred speech
Recognizing these findings is important because cranial nerve abnormalities may indicate serious neurological disease.
For example:
Unilateral facial paralysis may suggest Bell’s palsy or stroke.
Sudden visual changes may indicate optic nerve pathology.
Dysphagia may increase aspiration risk.
Vertigo may indicate vestibular dysfunction.
Practical Exam Tips for Nursing Students
Cranial nerve examination can initially seem overwhelming because learners must remember anatomy, physiology, innervation patterns, functions, and examination techniques simultaneously. However, structured study methods and repeated practice significantly improve confidence and retention.
Use a Cranial Nerve Mnemonic Consistently
A Cranial Nerve Mnemonic improves recall of:
Cranial nerve order
Sensory and motor classification
Major functions
Examination findings
Using the same mnemonic repeatedly strengthens memory pathways and improves speed during exams.
Learn the Nerves in Functional Groups
Grouping cranial nerves according to shared functions improves understanding.
Examples:
Eye movement → CN III, CN IV, CN VI
Hearing and balance → CN VIII
Swallowing and speech → CN IX and CN X
Facial sensation and mastication → CN V
Connect Anatomy to Clinical Symptoms
Linking nerve dysfunction to patient symptoms improves long-term retention.
Visual learning methods improve memorization of cranial nerve pathways and innervation patterns.
Helpful visual tools include:
Brainstem diagrams
Cranial nerve charts
Flashcards
Labeled anatomical illustrations
Focus on High-Yield Clinical Findings
Certain cranial nerve findings are frequently tested during exams and clinical assessment.
High-yield examples include:
CN III → ptosis and pupil dilation
CN VII → facial paralysis
CN VIII → hearing and balance dysfunction
CN XII → tongue deviation
Understanding these associations strengthens clinical reasoning and neurological assessment skills.
Mastering cranial nerve testing requires repetition, organization, and application of both anatomy and physiology concepts. Consistent use of a Cranial Nerve Mnemonic, combined with practical neurological assessment experience, improves memorization, diagnostic accuracy, and confidence during patient care.
Cranial Nerve Dysfunction and Clinical Relevance
Cranial nerve dysfunction occurs when one or more of the cranial nerves become damaged, compressed, inflamed, or impaired due to disease, trauma, vascular compromise, infection, or neurological degeneration. Since the cranial nerves are responsible for essential sensory and motor functions involving the brain, head, neck, and several internal structures, dysfunction can produce significant neurological symptoms that affect communication, mobility, balance, swallowing, vision, hearing, and patient safety.
The cranial nerves are twelve pairs of nerves that originate in the brain and brainstem. Because each nerve has a specialized anatomical pathway and innervation pattern, abnormalities involving a specific nerve often produce characteristic clinical findings. Understanding these dysfunction patterns is important because cranial nerve abnormalities frequently provide early clues about underlying neurological disease.
Cranial nerve dysfunction may develop from:
Stroke
Traumatic brain injury
Brain tumors
Multiple sclerosis
Meningitis
Increased intracranial pressure
Bell’s palsy
Diabetes mellitus
Neurodegenerative disorders
Brainstem lesions
Peripheral nerve injury
In many clinical situations, neurological symptoms involving the cranial nerves help localize where damage is occurring within the nervous system. For example:
Visual deficits may indicate optic nerve dysfunction.
Facial weakness may suggest facial nerve injury.
Difficulty swallowing may involve the glossopharyngeal or vagus nerves.
Hearing impairment and balance problems may indicate vestibulocochlear nerve dysfunction.
Because of the complexity of cranial nerve anatomy and physiology, identifying the affected nerve requires strong understanding of:
Sensory and motor functions
Innervation pathways
Reflex responses
Anatomical relationships
Neurological examination findings
A Cranial Nerve Mnemonic is often helpful when evaluating dysfunction because it improves rapid recall of nerve order, function, and classification during patient assessment. In emergency situations, the ability to quickly identify which cranial nerve controls a specific activity may improve recognition of neurological deterioration and guide urgent intervention.
For example:
CN III dysfunction may indicate increased intracranial pressure.
CN VII abnormalities may indicate Bell’s palsy or stroke.
CN VIII dysfunction may signal vestibular disease or acoustic neuroma.
CN IX and CN X abnormalities may increase aspiration risk.
Cranial nerve dysfunction can affect both quality of life and patient survival because these nerves regulate several activities essential for communication, airway protection, nutrition, coordination, and sensory processing.
Common Signs and Symptoms of Cranial Nerve Dysfunction
The symptoms of cranial nerve dysfunction depend on:
Which cranial nerve is affected
Whether the nerve is sensory, motor, or mixed
The severity of the lesion
Whether the dysfunction is central or peripheral
Since different cranial nerves regulate different body functions, dysfunction often produces highly specific neurological findings.
Visual Disturbances
Visual abnormalities commonly occur when dysfunction affects:
Optic nerve (CN II)
Oculomotor nerve (CN III)
Trochlear nerve (CN IV)
Abducens nerve (CN VI)
Symptoms may include:
Blurred vision
Double vision
Loss of peripheral vision
Ptosis
Abnormal pupil responses
Impaired eye movement
Example: A patient with inability to move one eye laterally may have abducens nerve dysfunction.
Visual abnormalities may indicate:
Stroke
Brain tumors
Increased intracranial pressure
Optic neuritis
Brainstem injury
Loss of Smell
The olfactory nerve controls smell, and dysfunction may cause:
Anosmia
Reduced smell sensation
Common causes include:
Head trauma
Viral infections
Neurodegenerative disease
Frontal lobe tumors
Because smell contributes to taste and appetite, olfactory dysfunction may affect nutrition and quality of life.
Common Cranial Nerve Test Findings
Facial Weakness and Facial Sensation Changes
Facial abnormalities commonly involve:
Trigeminal nerve (CN V)
Facial nerve (CN VII)
Symptoms may include:
Facial drooping
Facial numbness
Jaw weakness
Loss of corneal reflex
Difficulty chewing
CN V dysfunction may impair:
Facial sensation
Muscles of mastication
CN VII dysfunction commonly affects:
Facial expression
Eye closure
Taste sensation
Example: A patient with Bell’s palsy may present with unilateral facial paralysis and inability to close one eye.
Hearing and Balance Abnormalities
Vestibulocochlear nerve dysfunction may affect:
Hearing
Cochlear processing
Vestibular balance
Symptoms may include:
Hearing loss
Vertigo
Tinnitus
Dizziness
Impaired balance
These symptoms may develop in:
Vestibular neuritis
Ménière disease
Acoustic neuroma
Brainstem lesions
Example: A patient with severe dizziness and nausea during movement may have vestibular dysfunction involving CN VIII.
Swallowing and Speech Problems
Glossopharyngeal and vagus nerve dysfunction may affect:
Swallowing
Speech
Gag reflex
Airway protection
Symptoms may include:
Dysphagia
Hoarseness
Choking
Aspiration
Weak cough
These abnormalities are clinically important because impaired swallowing increases aspiration pneumonia risk.
Tongue and Neck Movement Abnormalities
Accessory and hypoglossal nerve dysfunction may produce:
Weak neck movement
Shoulder weakness
Tongue deviation
Slurred speech
Hypoglossal dysfunction affects tongue movement and articulation, while accessory nerve injury impairs shoulder elevation and head rotation.
Disorders Associated With Specific Cranial Nerves
Different neurological disorders affect specific cranial nerves according to their anatomy, blood supply, and physiological pathways.
Olfactory Nerve Disorders
Conditions affecting CN I include:
Head trauma
Alzheimer disease
Parkinson disease
Nasal tumors
Loss of smell may occur early in neurodegenerative disease.
Optic Nerve Disorders
Common optic nerve disorders include:
Optic neuritis
Glaucoma
Ischemic optic neuropathy
Increased intracranial pressure
These conditions may impair vision permanently if untreated.
Oculomotor, Trochlear, and Abducens Disorders
CN III, CN IV, and CN VI dysfunction may result from:
Diabetes mellitus
Brain aneurysm
Brainstem stroke
Increased intracranial pressure
Symptoms may include:
Diplopia
Abnormal gaze
Ptosis
Pupil abnormalities
Trigeminal Nerve Disorders
Important CN V disorders include:
Trigeminal neuralgia
Brainstem lesions
Facial trauma
Trigeminal neuralgia produces severe episodic facial pain and is often triggered by chewing or touching the face.
Facial Nerve Disorders
The most recognized facial nerve disorder is Bell’s palsy.
Symptoms include:
Facial paralysis
Inability to close the eye
Facial asymmetry
Loss of taste
Stroke may also affect facial movement, although forehead sparing often helps distinguish central from peripheral dysfunction.
Vestibulocochlear Disorders
CN VIII disorders include:
Acoustic neuroma
Vestibular neuritis
Ménière disease
These conditions may affect:
Hearing
Balance
Vestibular physiology
Cochlear function
Glossopharyngeal and Vagus Disorders
Disorders involving CN IX and CN X may occur in:
Stroke
Brainstem lesions
Neuromuscular disease
Symptoms commonly include:
Dysphagia
Absent gag reflex
Hoarseness
Aspiration risk
Hypoglossal Nerve Disorders
CN XII dysfunction may develop from:
Stroke
Brain tumors
Motor neuron disease
Common findings include:
Tongue deviation
Fasciculations
Speech impairment
Understanding these disorder patterns helps connect neurological symptoms with specific cranial nerve anatomy and function.
Clinical Importance of Cranial Nerve Anatomy in Nursing Practice
Knowledge of cranial nerve anatomy is highly important in nursing practice because cranial nerve assessment helps identify early neurological deterioration, monitor patient stability, and guide clinical decision-making.
Nurses frequently assess cranial nerve function in patients with:
Stroke
Head injury
Neurological disease
Brain surgery
Altered mental status
Seizure disorders
Brain tumors
Cranial nerve assessment is particularly important because subtle neurological changes may occur before more severe deterioration develops.
For example:
New pupil asymmetry may indicate increasing intracranial pressure.
Sudden facial drooping may suggest stroke.
Difficulty swallowing may increase aspiration risk.
Balance abnormalities may increase fall risk.
Understanding cranial nerve anatomy helps nurses:
Recognize abnormal neurological findings
Perform accurate assessments
Communicate effectively with healthcare teams
Monitor disease progression
Improve patient safety
Knowledge of sensory and motor functions is also essential during neurological documentation and patient evaluation.
Nursing assessment may include:
Vision testing
Facial sensation evaluation
Eye movement assessment
Gag reflex examination
Hearing tests
Swallow assessment
Tongue movement evaluation
Because cranial nerve pathways originate in the brainstem and cerebral structures, abnormalities often reflect significant neurological disease processes. Nurses therefore play a critical role in early detection of cranial nerve dysfunction.
Clinical application of cranial nerve anatomy is important in:
Stroke assessment
Airway management
Aspiration prevention
Fall prevention
Neurological monitoring
Rehabilitation planning
A strong understanding of cranial nerve physiology and innervation patterns also improves interpretation of patient symptoms. For example:
Dysphagia may indicate vagus nerve dysfunction.
Jaw weakness may involve the trigeminal nerve.
Hearing abnormalities may involve vestibulocochlear pathways.
Tongue deviation may indicate hypoglossal nerve injury.
Because remembering all twelve cranial nerves and their functions can be challenging, many healthcare learners continue using a Cranial Nerve Mnemonic throughout clinical practice. Mnemonic strategies improve recall during neurological exams and help organize complex anatomy and physiology concepts into structured memory systems.
Consistent understanding of cranial nerve dysfunction and clinical relevance strengthens neurological assessment skills, improves patient safety, and supports more accurate recognition of neurological disease in healthcare settings.
Behind on multiple nursing assignments?
Our team will handle them while you focus on learning and clinical work.
Mastering the cranial nerves is an essential part of understanding neurological anatomy, physiology, and clinical assessment. Because the cranial nerves regulate critical sensory and motor functions such as smell, vision, hearing, facial sensation, swallowing, tongue movement, speech, and balance, they play a major role in both normal body function and neurological evaluation. A strong understanding of these nerves allows healthcare professionals to connect patient symptoms with underlying neurological pathways and identify potential dysfunction early.
Throughout this guide, the relationship between cranial nerve anatomy, innervation, physiology, and clinical relevance has been explored in detail. Understanding how the twelve pairs of nerves originate in the brain and brainstem helps explain why specific neurological conditions produce characteristic signs and symptoms. Disorders affecting individual cranial nerves may alter sensory perception, impair movement, disrupt coordination, or interfere with protective reflexes such as swallowing and the gag reflex. As a result, cranial nerve assessment remains a foundational component of neurological examination and patient monitoring.
One of the greatest challenges when studying the cranial nerves is remembering the large amount of associated information. Learners must recall:
Cranial nerve names
Roman numeral order
Sensory and motor classifications
Major functions
Anatomical pathways
Clinical test findings
Common dysfunction patterns
This is why the use of a Cranial Nerve Mnemonic is so valuable. Mnemonic devices simplify memorization by organizing complex neurological concepts into structured memory patterns that improve recall during exams and clinical practice. Whether remembering the order of the nerves, distinguishing sensory and motor functions, or identifying clinical abnormalities, a well-developed Cranial Nerve Mnemonic can significantly strengthen long-term retention and understanding.
Equally important is the ability to apply this knowledge clinically. Recognizing abnormalities such as facial weakness, impaired eye movement, hearing loss, tongue deviation, dysphagia, or balance disturbances can help identify neurological emergencies and guide patient care decisions. Understanding cranial nerve dysfunction also supports safer practice by improving recognition of aspiration risk, airway compromise, stroke symptoms, and neurological deterioration.
Consistent review of cranial nerve anatomy, repeated neurological assessment practice, and use of visual memory techniques can improve both confidence and clinical reasoning. Combining foundational anatomy knowledge with mnemonic strategies allows learners to better organize information and apply it effectively in patient assessment settings.
Ultimately, the cranial nerves represent one of the most important communication systems within the nervous system. Developing a strong understanding of their anatomy, function, physiology, and clinical relevance provides an important foundation for neurological assessment, critical thinking, and safe patient care across many healthcare environments.
Frequently Asked Questions
How to remember the 12 cranial nerves mnemonic?
One of the easiest ways to remember the 12 cranial nerves is by using a Cranial Nerve Mnemonic such as: “Oh, Oh, Oh, To Touch And Feel Very Good Velvet, AH!” This phrase helps remember the nerves in order from CN I to CN XII.
What are the 12 cranial nerves with mnemonic?
Cranial Nerve
Mnemonic Word
Olfactory (CN I)
Oh
Optic (CN II)
Oh
Oculomotor (CN III)
Oh
Trochlear (CN IV)
To
Trigeminal (CN V)
Touch
Abducens (CN VI)
And
Facial (CN VII)
Feel
Vestibulocochlear (CN VIII)
Very
Glossopharyngeal (CN IX)
Good
Vagus (CN X)
Velvet
Accessory (CN XI)
AH
Hypoglossal (CN XII)
!
The full Cranial Nerve Mnemonic is: “Oh, Oh, Oh, To Touch And Feel Very Good Velvet, AH!”
What is the mnemonic brother of the cranial nerves?
The “brother mnemonic” commonly refers to the mnemonic used to remember whether cranial nerves are sensory, motor, or both: “Some Say Marry Money, But My Brother Says Big Brains Matter More.”
S = Sensory
M = Motor
B = Both sensory and motor
What does “oh oh oh to touch and feel” mean?
The phrase is part of a Cranial Nerve Mnemonic used to remember the names of the cranial nerves in order. Each word represents one nerve:
Oh = Olfactory
Oh = Optic
Oh = Oculomotor
To = Trochlear
Touch = Trigeminal
And = Abducens
Feel = Facial
The remaining words continue the sequence for CN VIII–XII.